


- Food Ingredients & Additives
- Clean Label Starch Market
Clean Label Starch Market Size, Share, Growth, and Regional Forecast, 2026 - 2033
Clean Label Starch Market by Product Type (Native Starch, Modified, Pre-gelatinized Starch, Resistant Starch, and Starch Blends), by Source (Corn, Potato, Tapioca, Rice, Wheat, Legume-based, and Others), Application (Food & Beverage, Animal Feed Industry, Pharmaceutical, Others) by End User (Food & Beverage Manufacturers, Specialty & Organic Food Brands, Contract Manufacturers, Cosmetics & Personal Care Companies, and Pet Food Manufacturers), and Regional Analysis from 2026 - 2033
Clean Label Starch Market Share and Trend Analysis
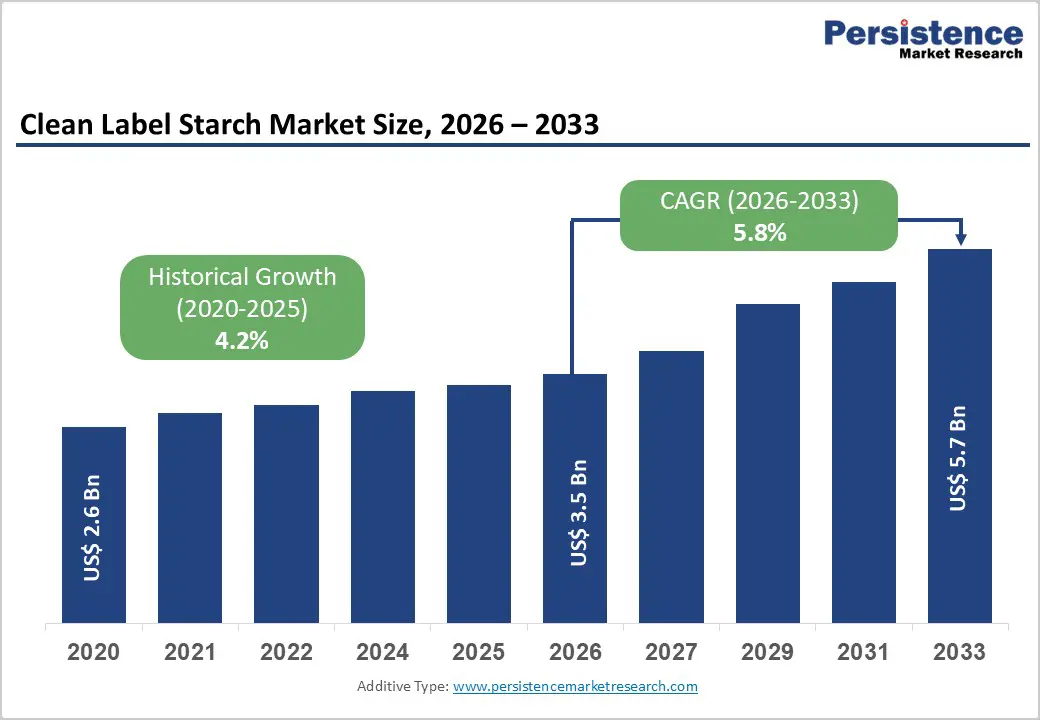
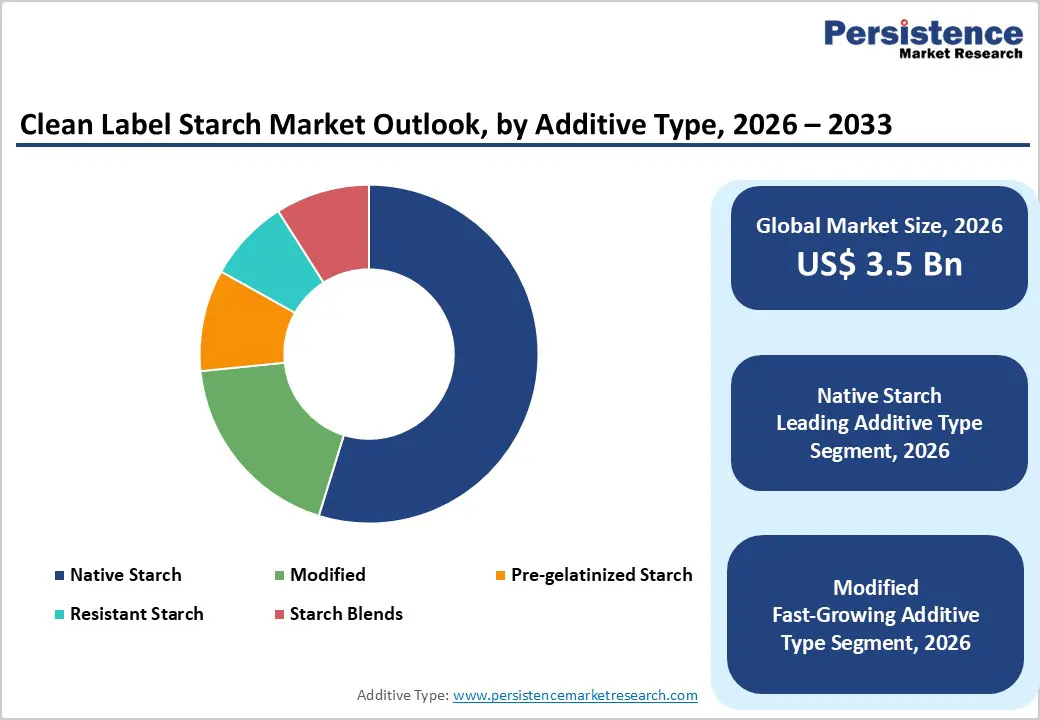
The global clean label starch market size is estimated to grow from US$ 3.5 Bn in 2026 to US$ 5.7 Bn by 2033. The market is projected to record a CAGR of 5.8% during the forecast period from 2026 to 2033.
Growing consumer inclination toward natural, minimally processed foods is significantly accelerating the adoption of clean label starch across global food systems. Manufacturers are increasingly incorporating these starches to maintain product texture, stability, and shelf life while ensuring simple and recognizable ingredient lists. Clean label starch plays a vital role in improving mouthfeel, viscosity, and consistency in processed foods such as sauces, bakery items, and ready-to-eat meals. With rising scrutiny around artificial additives, food producers are actively reformulating offerings to align with transparency and health-focused preferences. Additionally, advancements in starch processing technologies are enhancing functional performance without chemical modification. Expanding demand for convenience foods, coupled with premium and organic product trends, continues to strengthen the relevance of clean label starch in modern food manufacturing.
Key Industry Highlights
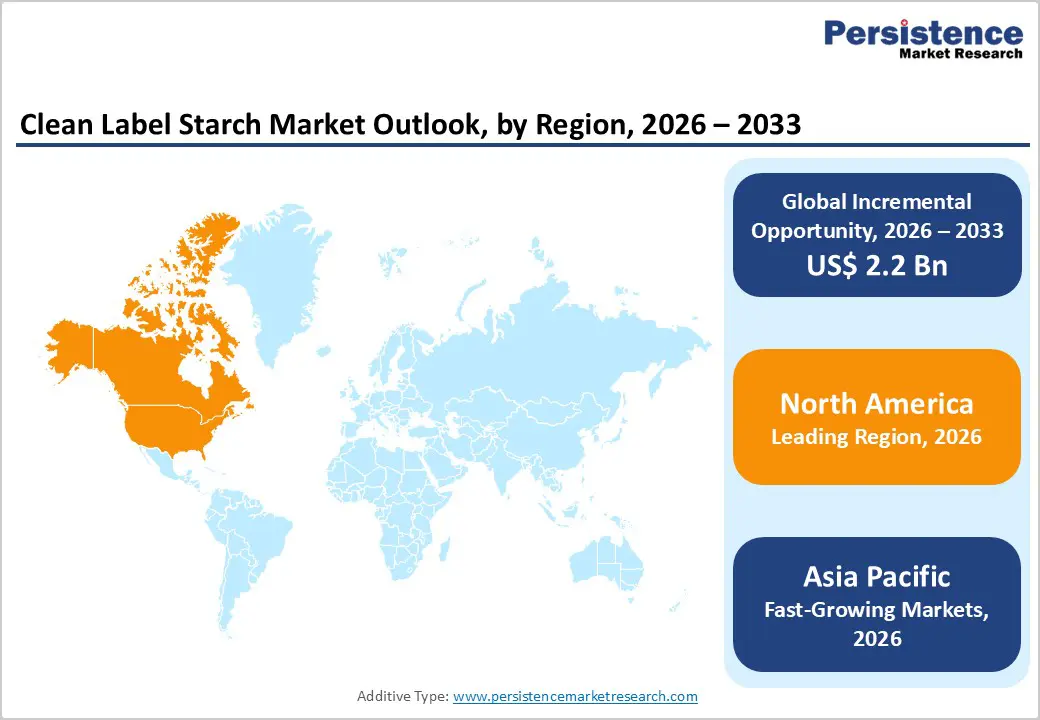
- Leading Region: North America holds 46.7% share, supported by strong demand for transparent labeling, advanced food processing capabilities, and rapid adoption of natural ingredient solutions across packaged food categories.
- Fastest-Growing Region: Asia Pacific is witnessing robust expansion, driven by increasing consumption of processed foods, rising disposable incomes, and growing awareness regarding clean label ingredients in emerging economies.
- Leading Product Type Segment: Native starch leads due to its natural origin, ease of labeling, and ability to deliver essential functionalities without chemical modification.
- Fastest-Growing Product Type Segment: Resistant starch is gaining traction as demand rises for functional ingredients that support digestive health and low-glycemic formulations.
- Leading Application Segment: Food & beverage remains the largest segment, fueled by extensive use in texture enhancement, stabilization, and clean label reformulation across diverse product lines.
- Fastest-Growing Application Segment: Pharmaceuticals are emerging steadily as manufacturers explore clean label excipients for improved safety, compatibility, and regulatory acceptance.
| Key Insights | Details |
|---|---|
|
Clean Label Starch Market Size (2026E) |
US$ 3.5 Bn |
|
Market Value Forecast (2033F) |
US$ 5.7 Bn |
|
Projected Growth (CAGR 2026 to 2033) |
5.8% |
|
Historical Market Growth (CAGR 2020 to 2025) |
4.2 % |
Market Dynamics
Driver - Rising Consumer Preference for Natural Ingredients and Transparent Labeling
A major factor accelerating adoption is the growing consumer inclination toward foods made with recognizable, minimally processed ingredients. Increasing awareness about the potential health implications of artificial additives has pushed manufacturers to reformulate products using natural alternatives such as clean label starch. This shift is particularly evident across processed food categories where texture, stability, and shelf life must be maintained without compromising ingredient simplicity. Clean label starch offers functional benefits including thickening, binding, and moisture retention while aligning with consumer expectations for transparency.
In addition, regulatory bodies across key markets are emphasizing clearer labeling practices, prompting food producers to eliminate chemically modified ingredients. The rise of premium and organic product segments has further reinforced demand, as these categories heavily rely on natural ingredient positioning. Technological advancements in starch processing have enabled manufacturers to enhance performance characteristics without chemical modification, making clean label solutions more viable. Emerging economies are also witnessing a gradual shift toward packaged foods with clean ingredient claims. Collectively, evolving dietary preferences, regulatory pressures, and innovation in formulation are strengthening the role of clean label starch in modern food systems.
Restraints - Functional Limitations and Cost Pressures Compared to Modified Alternatives
Despite strong demand, certain performance limitations continue to restrict broader adoption. Clean label starch, being minimally processed, often lacks the stability and tolerance required under extreme processing conditions such as high heat, shear, or acidic environments. This can limit its applicability in complex food formulations where consistency and shelf stability are critical. Manufacturers may face challenges in achieving the same level of viscosity control or texture uniformity compared to chemically modified starches, leading to potential trade-offs in product quality.
Cost considerations further compound the issue, as clean label variants typically involve higher production expenses due to specialized processing techniques and sourcing requirements. Fluctuations in raw material availability, particularly for crops like tapioca and potato, can also impact pricing stability. Additionally, reformulating existing products to incorporate clean label starch requires significant R&D investment, which may not be feasible for smaller players. Variability in global regulatory definitions of “clean label” adds another layer of complexity, creating inconsistencies in product positioning. These factors collectively pose operational and economic challenges for widespread adoption.
Opportunity - Expansion Across Plant-Based, Convenience Foods, and Emerging Markets
Significant growth potential lies in the expanding demand for plant-based and convenience food products, where clean label starch serves as a critical functional ingredient. As consumers increasingly adopt vegetarian and vegan diets, manufacturers require natural texturizers and stabilizers to replicate the sensory attributes of traditional products. Clean label starch is well-positioned to meet these needs, particularly in dairy alternatives, meat substitutes, and ready-to-eat meals.
Furthermore, rapid urbanization and changing lifestyles are driving consumption of packaged foods in emerging markets, creating new avenues for clean label ingredient integration. Rising disposable incomes and improving awareness around food quality are encouraging consumers to shift toward premium offerings with transparent labeling. Innovations in starch extraction and processing technologies are also enabling the development of variants with enhanced performance, bridging the gap with modified alternatives. Additionally, sustainability trends, including the use of non-GMO and locally sourced raw materials, are opening new differentiation strategies for manufacturers. These combined factors present a strong foundation for long-term market expansion and innovation.
Category-wise Analysis
By Product Type Insights
Native starch is projected to dominate the global clean label starch market in 2026, accounting for 54.8% of total revenue. Its leadership stems from its natural origin and ability to deliver essential functionalities such as thickening, binding, and texture enhancement without chemical modification. Food manufacturers increasingly prefer native variants to meet clean label requirements while maintaining product quality and sensory appeal. These starches are widely used across bakery, dairy, and processed food applications due to their compatibility with simple ingredient declarations. Moreover, growing consumer scrutiny toward synthetic additives has accelerated the shift toward minimally processed ingredients. While modified starches offer enhanced stability under extreme processing conditions, native starch continues to gain traction due to its transparency and alignment with evolving regulatory standards and consumer expectations.
By Application Insights
The food & beverage segment is expected to hold the largest share in 2026, contributing 71.3% of total revenue. This dominance is driven by the widespread incorporation of clean label starch across a broad spectrum of products, including soups, sauces, ready meals, and dairy items. These starches play a crucial role in delivering desired viscosity, mouthfeel, and stability while supporting simplified ingredient lists. Increasing demand for processed yet “natural-positioned” foods has encouraged manufacturers to reformulate products using clean label alternatives. Additionally, the rise of convenience foods, coupled with premiumization trends, has further boosted adoption. Compared to industrial applications, the food sector demonstrates higher sensitivity to labeling and ingredient transparency, making it the primary consumer of clean label starch solutions globally.
By End-user Insights
Food & beverage manufacturers are anticipated to account for 46.5% of total market revenue in 2026, positioning them as the leading end-user segment. Their dominance is supported by the ongoing shift toward clean label product portfolios, driven by consumer demand for recognizable and natural ingredients. Large-scale manufacturers are actively reformulating existing offerings to eliminate chemically modified components, thereby increasing reliance on clean label starch. Additionally, multinational food companies are investing in product innovation to maintain competitive differentiation while complying with stringent labeling standards. The segment also benefits from high production volumes and continuous demand across both developed and emerging markets. As clean label claims become a key purchasing criterion, manufacturers are expected to further integrate these starches into diverse product categories, reinforcing their market leadership.
Region-wise Insights
North America Clean Label Starch Market Trends
North America is projected to account for 46.7% of the global clean label starch market value in 2026, with the United States serving as the primary growth engine. The region’s leadership is supported by a mature food processing industry that places strong emphasis on ingredient transparency and product labeling. Consumers increasingly demand recognizable, non-GMO, and minimally processed ingredients, prompting manufacturers to shift toward clean label starch solutions. Regulatory oversight by authorities such as the FDA has further reinforced the need for clear labeling practices, accelerating product reformulation initiatives.
In addition, large food corporations are investing heavily in R&D to develop starches that maintain performance under varying processing conditions while meeting clean label standards. The growing popularity of organic and plant-based foods has also contributed to increased utilization of native and specialty starches. Retailers and private label brands are playing a pivotal role by promoting clean ingredient positioning. Furthermore, advancements in supply chain traceability and sourcing transparency are strengthening consumer trust, ensuring sustained demand across multiple food categories in the region.
Europe Clean Label Starch Market Trends
Europe represents a highly regulated and quality-focused market, characterized by strong consumer awareness regarding food ingredients and sustainability. Key countries including Germany, France, the Netherlands, Spain, and the United Kingdom are major contributors, supported by well-established food manufacturing sectors. The region has been at the forefront of clean label adoption, driven by strict regulations governing food additives and labeling practices. As a result, manufacturers are increasingly replacing chemically modified starches with natural alternatives to comply with evolving standards.
Consumer preference for organic, non-GMO, and sustainably sourced products continues to shape market dynamics, encouraging the use of plant-based starches derived from sources such as potato and wheat. Additionally, the European food industry emphasizes environmental responsibility, prompting investments in sustainable sourcing and production techniques. Collaboration between ingredient suppliers and food manufacturers has accelerated innovation in functional clean label solutions. Ongoing efforts to reduce carbon footprint and improve supply chain efficiency further support market expansion, positioning Europe as a key hub for clean label ingredient development.
Asia Pacific Clean Label Starch Market Trends
Asia Pacific is expected to be the fastest-growing region, expanding at a CAGR of approximately 7.3% between 2026 and 2033. Growth is fueled by rapid urbanization, rising disposable incomes, and increasing consumption of processed and convenience foods. Countries such as China and India are at the forefront, supported by expanding food processing industries and evolving dietary preferences. As awareness regarding food safety and ingredient quality increases, consumers are gradually shifting toward products with simplified and natural ingredient lists.
The region is witnessing significant investments in domestic manufacturing capabilities, enabling large-scale production of clean label starch from diverse raw materials such as tapioca and rice. Additionally, multinational companies are expanding their presence to tap into the growing demand for premium and health-oriented food products. Government initiatives aimed at improving food quality standards and encouraging local production further support market growth. The rising influence of western dietary patterns, combined with increasing demand for packaged foods, continues to accelerate adoption, making Asia Pacific a high-potential market for clean label starch.
Competitive Landscape
The global clean label starch market is highly competitive, with strong participation from Archer Daniels Midland Company, Tate & Lyle PLC, Roquette Frères S.A., Cargill, Incorporated, BENEO GmbH, and Emsland Group. These companies leverage advanced processing technologies, clean-label formulation expertise, and integrated supply chains to strengthen their market presence while enhancing product functionality, texture, and shelf stability across food and beverage applications. Rising demand for natural, minimally processed ingredients is accelerating innovation, with manufacturers expanding production capacities, improving transparency, ensuring regulatory compliance, and investing in R&D to develop next-generation clean label starch solutions for diverse industrial applications.
Key Developments:
- In April 2025, Ingredient supplier Ulrick & Short broadened its clean label portfolio by introducing Synergie A, a new range of starches developed to enhance thickening and stabilization in food products while enabling simpler, more transparent ingredient labeling.
- In February 2024, Ingredion Incorporated (NYSE: INGR), a global leader in specialty ingredient solutions, introduced NOVATION® Indulge 2940 starch, further expanding its clean label texturizer portfolio. This innovation marks the first non-GMO functional native corn starch designed to deliver enhanced gelling and co-texturizing properties, particularly for dairy, plant-based alternatives, and dessert applications.
Companies Covered in Clean Label Starch Market
- Archer Daniels Midland Company
- Tate & Lyle PLC
- Roquette Frères S.A.
- Cargill, Incorporated
- BENEO GmbH
- Emsland Group
- Cooperatie Koninklijke Avebe U.A.
- MGP Ingredients, Inc.
- Ingredion Incorporated
- AGRANA Beteiligungs-AG
- KMC Kartoffelmelcentralen A.M.B.A.
- Tereos SCA
- Tereos Starch & Sweeteners Europe SAS
- Gulshan Polyols Ltd.
- Kent Corporation
- Others
Frequently Asked Questions
The global clean label starch market is projected to be valued at US$ 49.8 Bn in 2026.
Rising consumer demand for natural, clean-label, and additive-free food ingredients along with stringent labeling regulations and growing health consciousness are driving market growth.
The global clean label starch market is poised to witness a CAGR of 5.5% between 2026 and 2033.
Expansion into plant-based foods, emerging markets, and non-food applications (pharma, cosmetics) along with technological innovations in starch processing creates significant growth opportunities.
Archer Daniels Midland Company, Tate & Lyle PLC, Roquette Frères S.A., Cargill, Incorporated, BENEO GmbH, and Emsland Group. are some of the key players in the clean label starch market.


