


- Communication Infrastructure & Services
- U.S. Telecom Services Market
U.S. Telecom Services Market Size, Share, and Growth Forecast, 2026 - 2033
U.S. Telecom Services Market by Service Type (Fixed Internet/Broadband Services, Mobile Data Services, Mobile Voice Services, Machine-to-Machine (Mobile IoT) Services, Fixed Voice Services, Pay TV/IPTV Services, Misc.), Transmission (Wireline, Wireless), Industry (Consumer / Residential, IT & Telecom, Manufacturing, Healthcare, BFSI), and Regional Analysis for 2026 - 2033
U.S. Telecom Services Market Size and Trends Analysis
The U.S. telecom services market size was valued at US$218.9 billion in 2026 and is projected to reach US$244.7 billion by 2033, growing at a CAGR of 1.6% between 2026 and 2033.
The market advanced from US$190.5 billion in 2020 at a historical CAGR of 2.5%, reflecting a structural transition from legacy voice services toward data-centric connectivity architectures. The primary catalysts include accelerated 5G network deployment across North America with 314 million 5G connections as of Q1 2025, representing 83% population penetration (5G Americas) sustained fibre-optic infrastructure expansion led by AT&T's US$ 250 billion five-year investment commitment announced, and Machine-to-Machine (M2M) IoT connectivity proliferation across healthcare, manufacturing, and automotive verticals.
Key Industry Highlights:
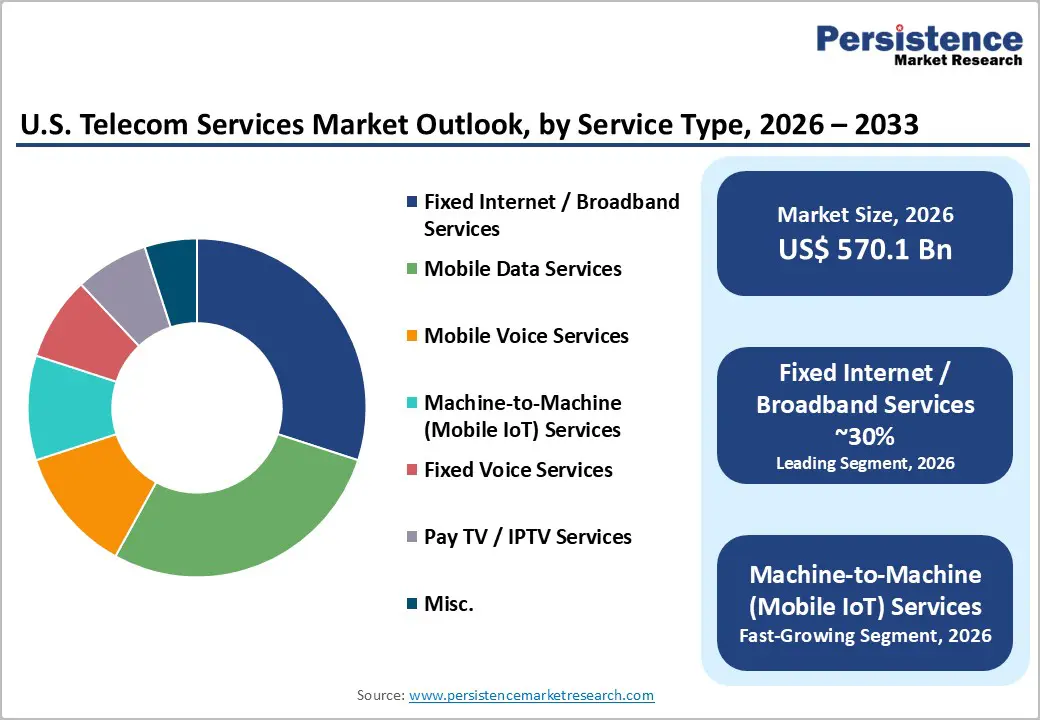
- Key Fixed Internet/Broadband Leads Service Share: Fixed internet/broadband services hold 30% market share in 2026, driven by nationwide fiber deployment and strong demand for high-speed connectivity across all major U.S. regions.
- Machine-to-Machine (Mobile IoT) Fastest-Growing Segment: M2M services are expanding rapidly, fueled by IoT adoption in healthcare, smart cities, manufacturing, and transportation.
- Consumer/Residential End-Use Dominance: The consumer/residential segment commands 40% market share, reflecting widespread adoption of broadband, mobile data, and digital entertainment services.
- IT & Telecom Segment Rapid Growth: Enterprise IT and telecom end-users represent the fastest-growing category, driven by digital transformation, cloud adoption, AI workloads, and edge computing needs.
- 5G Deployment Drives Mobile Data & FWA: Extensive 5G rollout with 314 million connections as of Q1 2025 is enabling next-gen mobile data services and fixed wireless access, supporting new connectivity tiers.
- Fiber-Optic Infrastructure Investment Expands Reach: AT&T, Frontier, and Spectrum added nearly 1.8 million new fiber locations in six months, enhancing coverage and broadband speeds in urban, suburban, and rural areas.
| Key Insights | Details |
|---|---|
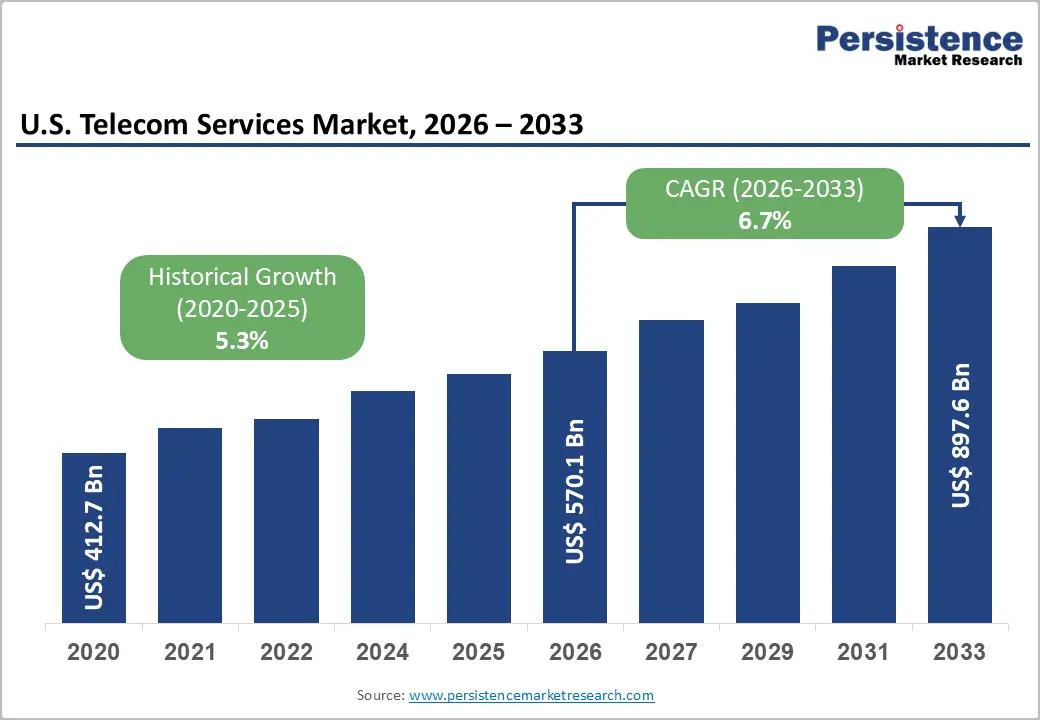
| U.S. Telecom Services Market Size (2026E) | US$ 570.1 Bn |
| Market Value Forecast (2033F) | US$ 897.6 Bn |
| Projected Growth (CAGR 2026 to 2033) | 6.7% |
| Historical Market Growth (CAGR 2020 to 2025) | 5.3% |
Market Dynamics
Drivers - 5G Network Infrastructure Deployment at Scale
The comprehensive rollout of 5G wireless infrastructure across the United States represents a foundational structural transformation of the national telecommunications architecture, fundamentally altering network capacity, latency characteristics, and the range of services that can be delivered through mobile connectivity. As of Q1 2025, North America reached 314 million 5G connections, representing 83% of the population, with cellular data traffic for all generations hitting 40 million terabytes, or 104.6 GB per person, up to fifteen times higher than in some global regions.
North America's 5G footprint is forecasted to expand, reaching a penetration rate of around 197% as multiple devices per person connect to 5G networks. With more than 18 commercial 5G networks deployed across North America, the industry is entering a transformative phase where standalone 5G is gaining traction, mid-band spectrum is fueling high-capacity performance, and the adoption of 5G-enabled devices and services is accelerating across sectors. This pervasive 5G deployment directly drives mobile data services revenue within the U.S. Telecom Services Market, enabling new service tiers, supporting emerging IoT applications, and creating demand for complementary fixed-wireless access (FWA) offerings that leverage 5G infrastructure to deliver residential broadband services.
Fibre-Optic Broadband Infrastructure Capital Deployment
The sustained capital commitment to fibre-optic broadband infrastructure across incumbent local exchange carriers (ILECs), multiple system operators (MSOs), and competitive overbuilders is fundamentally reshaping the U.S. fixed internet/broadband landscape and establishing the physical layer for next-generation connectivity services.
According to the FCC Broadband Data Collection (BDC) release in May 2025, reflecting data through December 2024, fibre deployment momentum continues nationwide, with AT&T deploying 965,986 new fibre locations in the second half of 2024 (6% growth), Frontier adding 479,809 locations (9% growth), and Spectrum expanding by 343,818 locations (35% growth). America's telecom providers invested nearly US$ 90 billion in communications infrastructure in 2024, continuing a near-record pace that has totalled over US$ 2.2 trillion since 1996, with the 2020–2024 period averaging US$ 90.4 billion per year, the highest sustained investment phase in U.S. broadband history.
Federal Broadband Equity Programs Accelerating Rural and Underserved Market Connectivity
The federal government's Broadband Equity, Access, and Deployment (BEAD) program, authorized under the Infrastructure Investment and Jobs Act, represents the largest single federal broadband funding initiative in U.S. history and is structurally expanding the addressable base for telecom services by driving deployment into previously unserved and underserved markets.
The BEAD program provides funding to all 50 states, Washington D.C., and 5 U.S. territories to finance deployment projects prioritising universal broadband access, with states selecting Internet service providers (ISPs) to execute infrastructure builds in federally defined eligible areas.
California alone received over US$ 1.86 billion in BEAD program funds following NTIA approval of its Initial Proposal Volume 2 on October 4, 2024, unlocking last-mile funding to connect unserved and underserved communities across the state (CPUC).
The FCC's May 2025 BDC update documented that 38 states and the District of Columbia now have 60% or more of Speedtest users experiencing the FCC's minimum standard for fixed broadband speeds of 100 Mbps downstream and 20 Mbps upstream, up from just 22 states and D.C. in the second half of 2024, reflecting the accelerated pace of broadband deployment driven by federal funding programs. This federally subsidised infrastructure expansion directly enlarges the total addressable market for the U.S. Telecom Services Market by enabling service availability in historically uneconomic rural geographies, driving new subscriber acquisition for fixed internet and mobile data services.
Restraint - Fixed Voice Services Revenue Structural Decline
The U.S. Telecom Services Market faces sustained structural revenue contraction in the fixed voice services segment as consumer and enterprise subscribers continue to abandon traditional landline telephony in favour of mobile-first communication strategies and Voice over Internet Protocol (VoIP) alternatives.
According to the latest data, 78% of U.S. households are now wireless-only phone users, up from 71% just one year ago, meaning more than 208 million Americans rely solely on mobile phones for voice communication. Over the past five years, landline phone use has declined by 40.9 million households, and in the last year alone, 6.5 million have cut the landline cord nationwide. A 2022 survey by the U.S. Centers for Disease Control and Prevention revealed that only about 29% of adults in the U.S. lived in households with a landline, a sharp decline from over 90% in 2004, with the tipping point occurring in 2015, coinciding with the smartphone surge (CNET). This structural erosion of fixed voice services revenue represents a significant headwind that offsets growth in mobile data and broadband segments, compressing overall market growth rates within the sector.
Opportunities - Healthcare Sector Telemedicine Infrastructure Demand
The healthcare sector's structural transformation toward telemedicine and remote patient monitoring is driving substantial demand for dedicated, high-reliability, and compliant telecom infrastructure to support mission-critical medical applications nationwide. Telehealth remains a cornerstone of modern healthcare delivery, enabling providers to reach patients in rural and underserved areas, and its expansion requires high-speed, secure broadband networks that meet HIPAA compliance standards.
The USAC Healthcare Connect Fund (HCF) helps healthcare providers offset the costs of building and maintaining these networks, ensuring even small rural clinics have the bandwidth to support telehealth platforms. The transition to next-generation broadband technologies, such as 5G and fibre-optic networks, is accelerating in 2025, providing the speed and reliability needed for innovations such as AI diagnostics and remote surgery. The expansion of 5G networks presents a promising avenue for enhancing telemedicine experiences, with 5 G's high speed and low latency capable of revolutionising real-time video consultations and remote monitoring, driving greater user satisfaction. Telemedicine infrastructure development involves building the technological foundation for delivering medical services remotely, including integrating hardware components such as video conferencing tools and monitoring devices, along with software solutions that enable secure data transmission and real-time interactions.
This structural demand creates a targeted opportunity for the U.S. Telecom Services Market to develop and deliver healthcare-specific connectivity solutions that combine fixed internet/broadband services, mobile data services, and dedicated private network configurations. Hospitals and clinics are adopting telemedicine infrastructure to extend medical services to remote patients, streamline appointments, and manage patient loads more effectively, while telemedicine service providers develop platforms that connect healthcare professionals and patients, optimising the telehealth experience through user-friendly interfaces, data security, and seamless communication.
The integration of artificial intelligence for enhanced diagnostics and personalised care, expansion of 5G networks enabling high-quality real-time interactions, enhanced data analytics providing insights for better patient outcomes, and remote patient monitoring technologies for chronic disease management collectively represent a multifaceted opportunity for telecom operators to deliver specialised service bundles targeting this high-value, compliance-driven vertical.
Banking, Financial Services, and Insurance (BFSI) Sector Network Modernisation
The Banking, Financial Services, and Insurance (BFSI) sector represents a strategically significant opportunity for the U.S. Telecom Services Market as financial institutions accelerate digital transformation initiatives requiring secure, high-bandwidth, low-latency, and redundant connectivity infrastructure to support core banking solutions, real-time trading platforms, mobile banking applications, and AI-driven fraud detection systems. For BFSI companies, ensuring customer satisfaction and driving business optimization are two major focus areas, and given the large volume of data and sensitive information managed by these firms, they must invest in scalable and secure telecom networks. BFSI companies are deploying several telecom and IT solutions to achieve higher efficiencies and remain competitive, including point-to-point (P2P) leased lines, MPLS, MPLS-VPN, ISDN lines, broadband, VPN, P2P Ethernet, primary rate interface (PRI) lines, Centrex, VSATs, and IPLCs for WAN and interbranch connectivity.
BFSI players are increasingly adopting core banking solutions, especially as they extend their reach into rural areas, with platforms enabling all major operations to be carried out from a centralised data centre. ATMs in rural areas are generally connected to a central ATM switch through VSAT, providing cost-effective backup links for all branches, including those located in remote areas.
Most BFSI companies use a multi-tiered telecom setup comprising a mix of standard connectivity tools and various IT applications and platforms, including P2P leased lines, MPLS, MPLS-VPN, ISDN lines, broadband, VPN, P2P Ethernet, PRI lines, Centrex, VSATs, and IPLCs. The seamless integration of MPLS networks with the rest of the system via network-to-network interface circuits remains a major concern, as one service provider often does not allow other operators to link to their network, preventing companies from fully leveraging their MPLS networks. This presents a strategic opportunity for telecom operators to deliver comprehensive, interoperable, and redundant network solutions that address the BFSI sector's stringent security, reliability, and compliance requirements, positioning specialised fixed internet/broadband services, dedicated mobile data services, and Machine-to-Machine (Mobile IoT) services as critical enablers of financial sector digital infrastructure.
Category-wise Analysis
Service Type Insights
Fixed Internet/Broadband Services hold the largest share of the U.S. Telecom Services Market at 30% in 2026, underpinned by the structural and sustained shift of consumer and enterprise activities toward digital platforms requiring high-speed, always-on connectivity for remote work, cloud computing, streaming media, online education, and e-commerce. The latest FCC Broadband Data Collection (BDC) release in May 2025, reflecting data through December 2024, documented continued momentum in fibre deployment across the United States, with growth reflecting efforts to replace legacy infrastructure such as copper and hybrid fibre-coaxial (HFC) systems, as well as to expand coverage into unserved and underserved communities.
Key drivers behind the surge in fiber deployment include incumbent local exchange carriers (ILECs) upgrading legacy copper networks to support faster, more reliable internet service, overbuilders, including several newer providers backed by strong funding looking to grow their market presence through competitive fibre builds, and multiple-system operators (MSOs) transitioning away from legacy HFC technology to more future-proof and lower-cost fiber networks.
The FCC's May 2025 BDC update documented that 38 states and the District of Columbia now have 60% or more Speedtest users experiencing the FCC's minimum standard for fixed broadband speeds of 100 Mbps downstream and 20 Mbps upstream, up from just 22 states and D.C. in the second half of 2024.
Machine-to-Machine (Mobile IoT) Services represent the fastest-growing segment of the U.S. Telecom Services Market, driven by the rapid proliferation of connected devices across industrial automation, connected vehicles, remote healthcare monitoring, smart city infrastructure, and agricultural IoT applications that require cellular connectivity for device-to-device communication and real-time data transmission.
The U.S. market for cellular M2M connectivity services is experiencing significant growth, driven by the widespread integration of IoT devices across industries such as healthcare, transportation, manufacturing, and retail. Demand for real-time data transmission, enhanced security, and seamless device management is a key driver. Advancements in network infrastructure, including 4G LTE and emerging 5G networks, are facilitating higher data speeds and lower latency, further fueling market expansion.
End -user Insights
Consumer/Residential holds the dominant position in the U.S. Telecom Services Market at 40% share in 2026, underpinned by the structural and sustained demand for fixed internet/broadband services, mobile voice services, mobile data services, and pay TV/IPTV services across the nation's approximately 130 million households. U.S. retail e-commerce sales reached approximately US$ 310.3 billion (seasonally adjusted) in Q3 2025, representing 16.4% of total retail sales, driving substantial consumer demand for high-speed broadband connectivity to support online shopping, streaming media consumption, remote work, and digital entertainment. As of Q1 2025, North America reached 314 million 5G connections, representing 83% of the population, with cellular data traffic across all generations hitting 40 million terabytes, or 104.6 GB per person — up to 15 times higher than in some global regions.
The vast majority of new home broadband subscriptions in 2023 used 5G via Fixed Wireless Access (FWA), with consumers opting for 5 G over fibre or other fixed-line connections such as DSL in areas where fibre infrastructure has not yet been deployed.
IT & Telecom represents the fastest-growing end-use segment within the U.S. Telecom Services Market, driven by the structural digital transformation of enterprise operations, accelerated adoption of cloud computing architectures, exponential growth of AI workloads requiring high-bandwidth connectivity, and the proliferation of edge computing infrastructure that demands low-latency, high-reliability network services across data centre interconnections and distributed computing nodes.
Competitive Landscape
The U.S. Telecom Services Market is largely oligopolistic, dominated by a handful of national players including AT&T, Verizon Communications, T-Mobile US, Comcast, Charter Communications, and Dish Network, which collectively hold the majority of subscribers across wireless, broadband, and pay-TV services. These leading operators benefit from extensive infrastructure, strong brand recognition, and bundled service offerings, creating high barriers to entry for smaller competitors. While regional providers like Lumen, Frontier Communications, and Altice serve niche or underserved areas, their scale and reach remain limited compared to the national giants.
Recent consolidation through mergers, such as the T-Mobile–Sprint merger and AT&T’s fiber acquisitions, has further strengthened the market power of top players. Market growth is slowing, with low churn rates in cable and wireless services indicating a mature subscriber base, making advanced broadband, 5G expansion, and bundled services critical for differentiation. Smaller players focus on niche offerings or underserved regions but face structural challenges in scaling.
Key Industry Developments:
- March 10, 2026 , AT&T announced a US$250 billion investment over five years to expand and modernize its U.S. fiber, 5G wireless, and satellite networks, enhancing always-on connectivity across urban, suburban, and rural areas, strengthening FirstNet for first responders, and supporting the next generation of AI, cloud, and digital services.
Companies Covered in U.S. Telecom Services Market
- AT&T Inc.
- Verizon Communications Inc.
- Comcast
- T-Mobile
- Charter Communications, Inc.
- United States Cellular Corporation
- Lumen Technologies Inc.
- Altice USA, Inc.
- Cox Communications, Inc.
Frequently Asked Questions
The U.S. Telecom Services Market is projected to be valued at US$ 570.1 Bn in 2026.
The Fixed Internet / Broadband Services segment is expected to account for approximately 30% of the U.S. Telecom Services Market by Service Type in 2026.
The market is expected to witness a CAGR of 6.7% from 2026 to 2033.
The U.S. Telecom Services Market growth is driven by large-scale 5G network rollout, sustained fibre-optic broadband infrastructure investment, and federal broadband equity programs expanding connectivity to rural and underserved areas.
Key market opportunities in the U.S. Telecom Services Market lie in providing specialised telecom infrastructure for the healthcare sector’s telemedicine expansion and the BFSI sector’s network modernisation, enabling high-speed, secure, and compliant connectivity solutions.
Key players in the Telecom Services Market include AT&T, Verizon Communications, T-Mobile US, Comcast, Charter Communications, and Dish Network.


