


- Metals & Minerals
- High Purity Alumina Market
High Purity Alumina Market Size, Share, and Growth Forecast, 2026 - 2033
High Purity Alumina Market by Grade (4N (99.99%), 5N (99.999%), and 6N (99.9999%), By Application (LED, Battery Separator, Semiconductor, Phosphor, and Others), and Regional Analysis for 2026 - 2033
High Purity Alumina Market Size and Trends Analysis
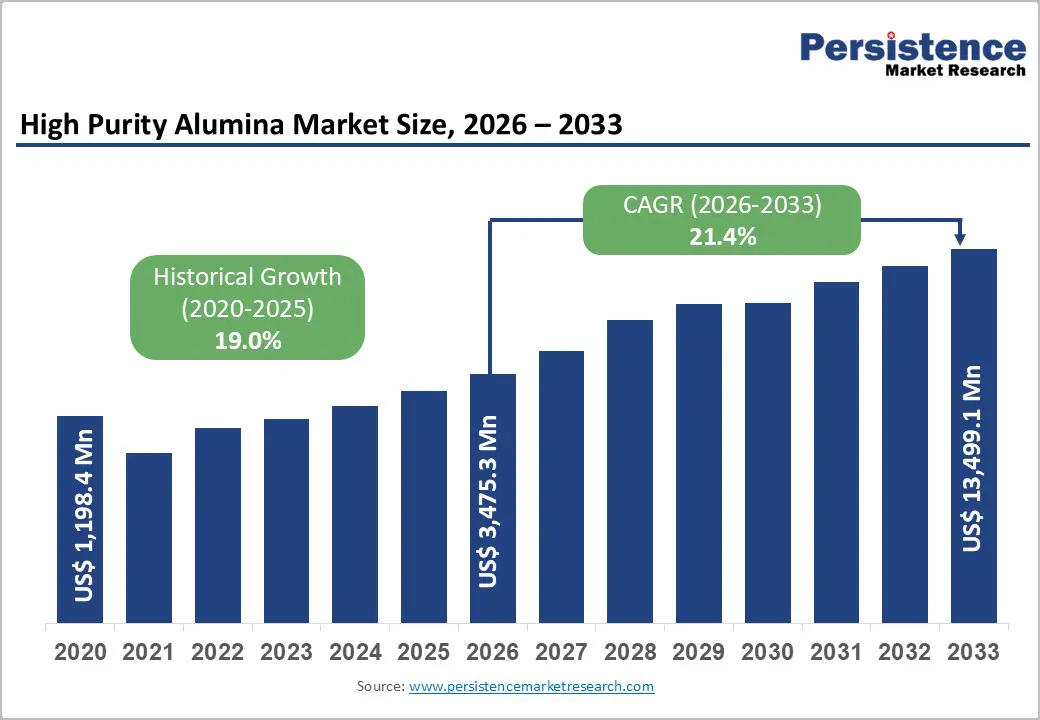
The global high purity alumina (HPA) market size was valued at US$ 1,198.3 million in 2020 and reached an estimated US$ 3,475.3 million in 2026, demonstrating robust expansion. The market is projected to reach US$ 13,499.1 million by 2033, growing at a CAGR of 21.4% from 2026 to 2033, with a historical CAGR of 19% (2020 - 2026).
The exponential growth is primarily driven by surging demand from the electric vehicle (EV) battery sector, where high-purity alumina serves as a critical material for lithium-ion battery separators, enhancing thermal stability and operational safety. The rapid expansion of LED lighting technology and the global transition from incandescent to energy-efficient lighting solutions continue to drive substantial HPA consumption.
Additionally, accelerating semiconductor manufacturing across the Asia Pacific, combined with technological advancements in optical and electronic applications, creates sustained market momentum. These factors, coupled with increasing governmental focus on sustainable energy and emission standards, position the HPA market for sustained double-digit growth over the forecast period.
Key Industry Highlights:
- Global HPA market is projected to grow from US$3,475.3 million in 2026 to US$13,499.1 million by 2033, representing a robust 21.4% CAGR, driven primarily by electric vehicle battery separator demand and semiconductor manufacturing expansion.
- Grade Analysis: The 4N (99.99%) grade segment dominates with above 57% revenue share; however, the 5N (99.999%) grade emerges as the fastest-growing category, demonstrating market evolution toward higher purity specifications for advanced applications.
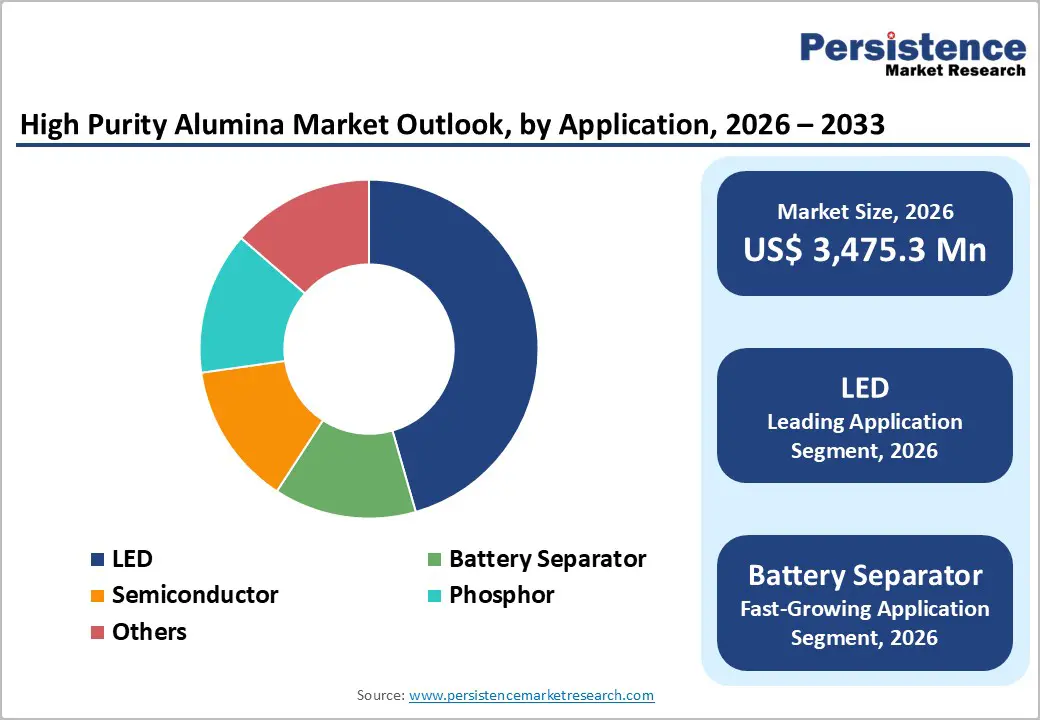
- Application: Battery separator applications represent the fastest-growing segment at 22-25% CAGR, with LED applications commanding the largest current revenue share at 47%, indicating a strategic opportunity to focus on emerging battery technology adoption.
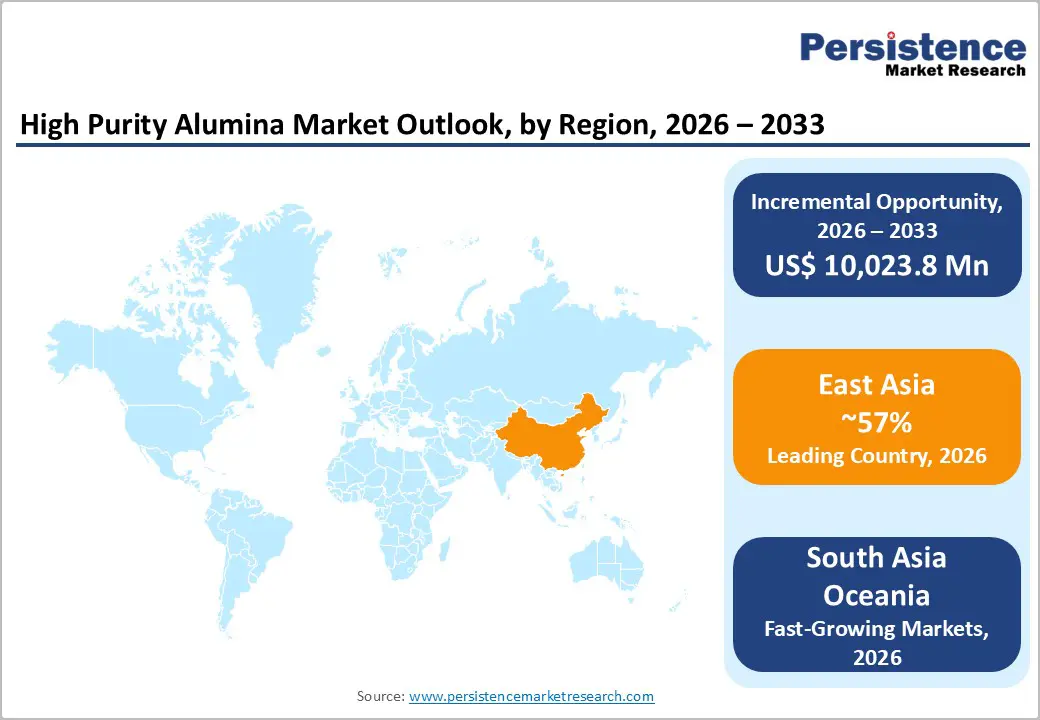
- Regional Analysis: East Asia commands above 56% global market share, with South Asia and Oceania expanding at 25% CAGR, representing the fastest-growing region and creating significant geographic diversification opportunities.
- Alpha HPA's AU$400 million Gladstone facility investment (2024 - 2027) and Sumitomo Chemical's ultra-fine NXA-series commercialization (2024) represent landmark strategic developments establishing production capacity diversification and specialty product market expansion.
- Structural supply constraints and rising demand from semiconductor, battery, and LED applications support favorable pricing dynamics and producer margin expansion through 2033.
| Key Insighst | Details |
|---|---|
| High Purity Alumina Market Size (2026E) | US$ 3,475.3 Mn |
| Market Value Forecast (2033F) | US$ 13,499.1 Mn |
| Projected Growth (CAGR 2026 to 2033) | 21.4% |
| Historical Market Growth (CAGR 2020 to 2025) | 19.0% |
Market Dynamics
Key Growth Drivers
Stringent Regulatory Frameworks and Green Building Certifications
The global electric vehicle (EV) market is undergoing an unprecedented acceleration, with EV sales projected to expand at a CAGR of 13.4% by 2030, driving exponential demand for lithium-ion batteries. Within this value chain, high-purity alumina (HPA) plays a critical role in the production of ceramic-coated battery separators, where it significantly improves thermal stability and reduces the risk of thermal runaway, one of the most critical safety challenges in advanced battery systems. As battery performance and safety requirements become more stringent, manufacturers are increasingly mandating ultra-high-purity HPA grades, particularly 5N (99.999%) and 6N (99.9999%), to ensure long-term durability, consistent performance, and compliance with OEM safety standards.
This demand momentum is strongly reinforced by rapid EV adoption trends. According to the International Energy Agency, global electric car sales exceeded 17 million units in 2024, accounting for more than 20% of all new passenger car sales worldwide. Sales grew by over 25% year-on-year, with the incremental 3.5 million EVs sold in 2024 alone surpassing total global EV sales recorded in 2020. China continues to dominate the market, with more than 11 million electric cars sold in 2024 exceeding total global sales from just two years earlier.
Looking ahead, Asia-Pacific is expected to account for over 45% of global EV production by 2030, directly translating into proportional growth in HPA consumption. Concurrently, major OEMs such as Tesla, BYD, and Volkswagen are expanding EV production capacity at annual rates of 35-40%, accelerating HPA demand for battery separators at an estimated CAGR of 26.7%, significantly outpacing overall HPA market growth. This structural linkage between EV electrification and battery material requirements positions HPA as a sustainable, multi-decade growth driver, underpinned by long-term capital investments and supply chain commitments from leading battery manufacturers.
Market Restraining Factors
High-Purity Alumina Market Faces Production Constraints and Margin Pressures
Production complexity and supply chain constraints remain critical challenges for the high-purity alumina (HPA) market. Manufacturing HPA requires highly sophisticated processing technologies, including aluminum alkoxide hydrolysis and advanced ultra-filtration systems capable of removing trace contaminants to part-per-million levels. These stringent technical requirements significantly limit production scalability. Global HPA capacity is heavily concentrated in China, Europe, and Japan, which together account for nearly 78% of total supply, exposing the market to regional disruptions and logistical vulnerabilities.
Although end-use demand is expanding at a rapid 21.4% pace, production growth is restricted to only 8-12% annually, leading to recurring supply-demand imbalances that affect pricing stability and customer availability. Additionally, raw material sourcing remains exposed to geopolitical uncertainties and tightening environmental regulations around bauxite mining. High entry barriers further restrict new capacity additions, as fully integrated HPA facilities require capital investments ranging from US$ 150 million to US$ 250 million.
Cost pressures are intensifying these challenges. HPA manufacturing is energy-intensive, particularly during thermal processing stages, making producers highly sensitive to rising electricity and fuel costs. Market prices for 4N HPA typically range between US$ 30,742 and US$ 45,000 per ton, while 6N grades command significantly higher prices of US$ 163,539 to US$ 199,882 per ton. However, increasing competition from lower-purity alternatives and emerging suppliers has resulted in margin compression of 15-20% in select customer segments. Price-sensitive applications, such as phosphors and technical ceramics, are increasingly shifting toward cost-efficient substitutes, constraining HPA demand growth in lower-margin markets.
High Purity Alumina Market Trends and Opportunities
Upgrading Purity and Battery Integration Drive High-Purity Alumina Market Opportunities
For high-purity alumina (HPA) manufacturers, a major growth opportunity lies in moving up the purity curve from conventional 4N grades to advanced 5N and 6N products tailored for semiconductors, phosphors, and next-generation electronics. Market assessments indicate that global HPA volumes are expected to nearly triple over the next decade, driven by strong expansion in electronics, electric vehicles, advanced displays, and data-center infrastructure. Semiconductor fabs are increasingly specifying ultra-high-purity alumina components and coatings to withstand aggressive plasma and chemical environments while minimizing particle generation and metal contamination. These requirements are intensifying as AI, high-performance computing, and advanced node architectures become more defect-sensitive and thermally demanding.
Recent investments underscore this shift, including a major greenfield project in Australia targeting more than 10,000 tons per year of ultra-high-purity alumina for advanced electronics and AI cooling applications. In parallel, mini-LED and micro-LED displays depend on ultra-clean phosphors and sapphire substrates derived from 5N-6N HPA. Process innovations such as multi-stage crystallization, advanced filtration, and precision calcination support premium pricing, long-term contracts, and stronger supply chain positioning.
At the same time, locking into EV battery and energy-storage supply chains represents a significant opportunity, particularly for 4N HPA used in ceramic separator coatings. The HPA-coated separator segment is projected to more than double between 2025 and 2032, supported by double-digit growth across the broader lithium-ion battery market. Regional battery localization strategies in Asia, Europe, and North America further encourage co-located HPA production and collaborative partnerships, enabling suppliers to secure long-term offtake, enhanced pricing power, and resilient revenue streams.
High Purity Alumina Market Insights and Trends
Product Type Insights
Structural Materials Dominate Green Building Market While Exterior Solutions Accelerate Growth
The 4N purity grade (99.99%) remains the leading segment in the global market, accounting for over 57% of total revenue across applications. Its dominance is driven by an optimal balance between performance, scalability, and cost efficiency, enabling reliable large-volume production. 4N-grade HPA is widely used in core end-use sectors, including LED lighting (35,000-40,000 metric tons annually), battery separator coatings (45,000-50,000 metric tons), and standard ceramic applications.
A large installed customer base in Asia-Pacific, combined with mature supply chains, further strengthens its market leadership. Global 4N production capacity is estimated at 85,000-95,000 metric tons per year, with around 68% located in China, 15% in Japan and South Korea, and the remainder spread across other regions.
In contrast, the 6N purity grade (99.9999%) represents the fastest-growing premium segment, projected to expand at a 25% CAGR from 2026 to 2033. Demand is driven by advanced semiconductor manufacturing below 3nm, aerospace thermal barrier coatings, and emerging solid-state battery technologies. However, complex multi-stage purification processes limit yields to 65-75% and raise production costs to US$ 4,000-6,500 per metric ton. With only 12-14 capable producers globally, constrained supply supports premium pricing and is expected to create a supply deficit by 2027-2028.
End Use Insights
Commercial Construction Dominates, Residential Segment Emerges as Fastest-Growing Demand Driver
LED lighting remains the dominant application for High Purity Alumina (HPA), accounting for over 47% of total revenue and representing the most mature and stable demand segment. LED chip manufacturers rely on 4N-grade sapphire substrates produced from HPA, with material costs contributing approximately 15-18% of total chip production expenses. Continued global expansion of the LED market, supported by government-led phase-outs of incandescent lighting and rising consumer preference for energy-efficient solutions, drives steady HPA consumption growth of around 8-10% annually.
Demand is well diversified across industrial LED installations, outdoor infrastructure, automotive lighting (with LED headlights adopted in nearly 73% of new vehicles by 2024), and large-scale residential fixture replacements. The segment’s relatively low price elasticity ensures stable purchasing behavior even during commodity price fluctuations. Currently, LED applications consume roughly 38,000-42,000 metric tons of HPA per year, forming the core revenue base for producers.
In contrast, battery separators represent the fastest-growing application, expanding at a projected CAGR of 26.7%. Growth is fueled by rapid electric vehicle adoption and large-scale energy storage deployment. HPA is used as an ultra-fine ceramic coating on polymer separators to enhance thermal and chemical stability. Rising lithium-ion battery capacity additions are expected to significantly increase HPA demand, offering long-term volume growth and pricing stability through multi-year supply contracts.
Regional Insights and Trends
East Asia Leads Global Market Through Semiconductors, Batteries, And Policy Support
East Asia dominates the global market, accounting for over 56% share, with a valuation of approximately US$ 1,945 million in 2026 and projected to reach US$ 7,559 million by 2033, reflecting a robust CAGR of 21.2%. The region’s leadership is primarily driven by China, which shapes overall market dynamics through its aggressive semiconductor manufacturing ambitions and extensive government subsidies supporting domestic chip production. Expansion in battery manufacturing capacity, aligned with electric vehicle output exceeding 60% of global production, further strengthens demand.
High refinery utilization rates, reaching 98.2% in Q1 2025, indicate tightening supply conditions. Additionally, large-scale renewable energy infrastructure-particularly hydroelectric capacity in Yunnan Province and wind and solar projects in Inner Mongolia-creates structural cost advantages for low-carbon alumina production, with certified sustainable products commanding pricing premiums of 5-15%.
Japan remains a key demand center, supported by advanced semiconductor packaging, optical components, and LED technologies. Leading producers such as Sumitomo Chemical continue to drive innovation through ultra-fine and specialty product commercialization. South Korea is emerging as a high-growth market, driven by OLED display manufacturing, semiconductor applications, and battery separator demand linked to domestic players such as Samsung SDI.
Regulatory frameworks further reinforce regional strength. China’s aluminum capacity caps limit primary expansion while encouraging a shift toward high-margin products such as HPA. Japan’s stringent environmental standards sustain demand for ultra-high-purity materials, while South Korea’s technology-focused policies promote specialty ceramic development. Investment trends indicate supply diversification through non-China sources and rising manufacturing relocation to Southeast Asia, creating additional regional demand.
South Asia and Oceania Drive Rapid HPA Market Growth Opportunities
South Asia and Oceania represent the fastest-growing regional market, expanding at a robust CAGR of 25%, significantly outpacing global average growth rates. The regional market is valued at approximately US$ 410 million in 2026 and is projected to reach nearly US$ 2,225 million by 2033, reflecting strong structural demand across high-growth industries.
India remains a key growth engine, driven by ambitious semiconductor manufacturing plans supported by production-linked incentive schemes and capacity subsidies. These initiatives are stimulating rising demand for high-purity alumina (HPA) in substrate manufacturing and thermal interface applications. In parallel, the rapid construction of battery manufacturing facilities, particularly for electric vehicle applications, is generating proportional demand for HPA used in separator coatings.
Southeast Asian countries such as Vietnam, Thailand, and Indonesia are attracting battery and electronics manufacturing investments as companies seek geographic diversification away from China. Established smartphone and display component manufacturing bases in Thailand and Vietnam continue to sustain demand for HPA in optical applications. Australia further strengthens the regional outlook through favorable renewable energy resources and critical minerals policies. Alpha HPA’s AU$ 400 million investment highlights growing regional production capacity, supporting supply security and export potential. Overall, expanding semiconductor and battery capacity across the region presents long-term investment opportunities.
Competitive Landscape
The high purity alumina market exhibits moderate-to-high concentration characteristics, with leading producers controlling approximately 60-65% of global supply capacity. Chalco (China), Sumitomo Chemical (Japan), and emerging producer Alpha HPA (Australia) represent the primary global competitors, supplemented by regional producers in China (Coalco and independent refineries) and other Asian manufacturers. Market structure reflects capital intensity barriers, technology complexity, and established supply relationships favoring incumbent producers.
New entrant competition remains limited, with Alpha HPA's recent commercialization at significant scale representing the first major new entrant in over a decade. Production capacity remains constrained relative to demand expansion, supporting favorable pricing dynamics and limited competitive discount pressure. Geographic supply concentration in East Asia creates customer geographic risk exposure and demand for production capacity development in other regions, particularly Australia, India, and Southeast Asia.
Key Industry Developments
- In May 2025, Andromeda Metals Ltd. announced a breakthrough: production of HPA at 99.9985% purity (4N) using its novel flowsheet and high-quality kaolin feedstock from its Great White Project, positioning for further commercialisation.
- In May 2024, Alpha HPA took Final Investment Decision (FID) for Stage Two of its Gladstone high-purity alumina refinery, confirming construction of a 10 hectare facility to produce over 10,000 tpa of HPA and aluminium materials.
- In April 2024, Alpha HPA Ltd. secured AU$400 m in Australian Government backed financing support (NAIF & EFA) to advance its “HPA First Project” in Gladstone, Queensland toward full-scale high-purity aluminum products production.
- In August 2023, Sumitomo Chemical Co., Ltd. launched its NXA series ultra fine α alumina (HPA) products, beginning mass production at its Ehime Works, targeting a ~30% increase in ultrahigh purity alumina business revenue by FY 2025.
Companies Covered in High Purity Alumina Market
- Sumitomo Chemical Co., Ltd.
- Nippon Light Metal Holdings Co., Ltd.
- Altech Batteries Ltd
- Baikowski SA
- CHALCO Advanced Material Co., Ltd.
- Alpha HPA Ltd.
- Zibo Honghe Chemical Co., LTD.
- Sasol Limited
- Xuancheng Jingrui New Material Co., Ltd.
- Hebei Heng Bo New Materials Technology Co. Ltd.
- Advanced Energy Minerals (AEM)
- CADOUX (emerging developer)
- Andromeda Metals (emerging developer)
- Polar Performance Materials (emerging developer)
- Other Market Players
Frequently Asked Questions
The High Purity Alumina market is estimated to be valued at US$ 3,475.3 Mn in 2026.
The primary demand driver for the High Purity Alumina market is the rapid expansion of LED lighting and lithium-ion battery manufacturing, supported by global energy-efficiency regulations and electrification trends.
In 2026, the East Asia region will dominate the market with an exceeding 55% revenue share in the global High Purity Alumina market.
Among applications, LED has the highest preference, capturing beyond 47% of the market revenue share in 2026, surpassing other applications.
Sumitomo Chemical Co., Ltd., Nippon Light Metal Holdings Co., Ltd., Altech Batteries Ltd, Baikowski SA, CHALCO Advanced Material Co., Ltd., Alpha HPA Ltd., and Zibo Honghe Chemical Co., LTD.


