Green Ammonia Market Size, Share, and Growth Forecast, 2025 - 2032

Green Ammonia Market by Production Process (Solid Oxide Electrolysis, Alkaline Water Electrolysis), End-user (Power Generation, Transportation, Fertilizer, Industrial Feedstock, and Others), and Regional Analysis for 2025 - 2032

ID: PMRREP33588
Calendar

October 2025

192 Pages

Author : Satender Singh

Green Ammonia Market Size and Trend Analysis

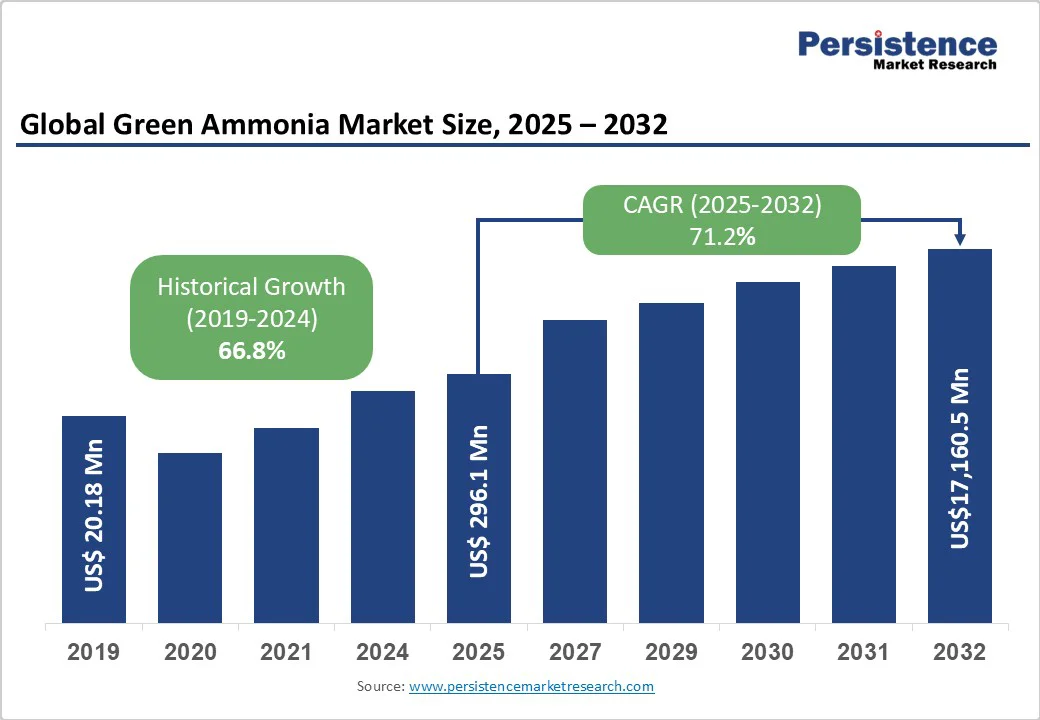
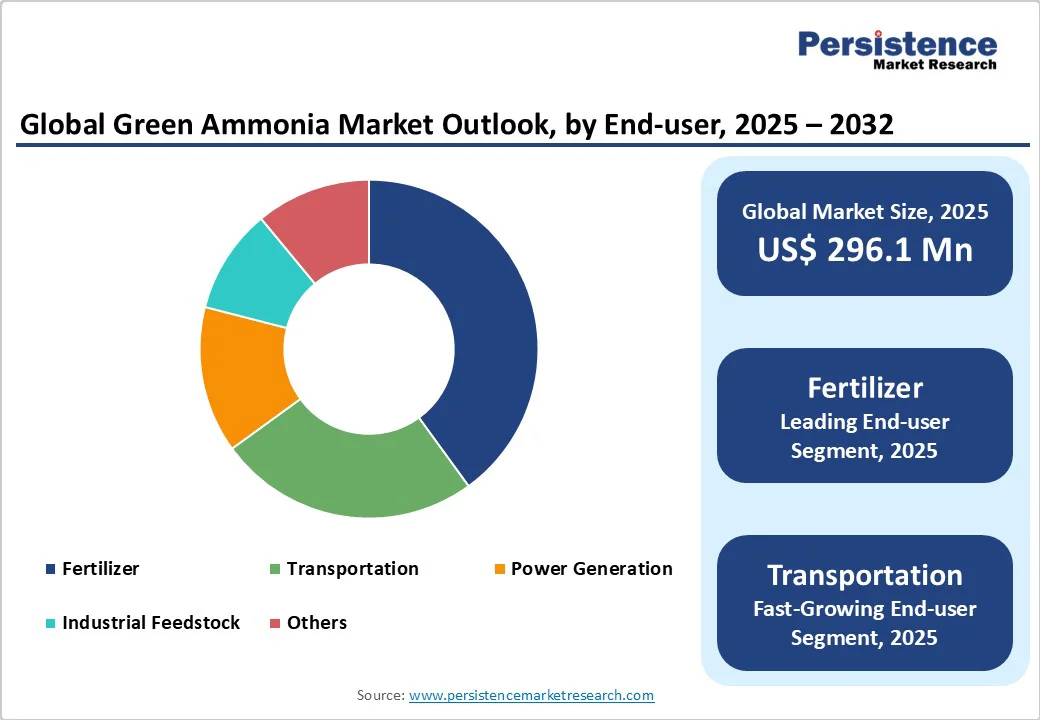
The global green ammonia market size is likely to be valued at US$296.1 million in 2025. It is expected to reach US$17,160.5 million by 2032, growing at a CAGR of 71.2% during the forecast period from 2025 to 2032. 

The global push for decarbonization and renewable energy. Investments in hydrogen and ammonia production, technological advancements in electrolysis, and supportive policies are enabling the development of low-carbon ammonia solutions. Growing demand from transportation, agriculture, and industrial applications is accelerating the adoption of sustainable ammonia, positioning it as a key contributor to the transition toward cleaner energy systems.

Key Industry Highlights

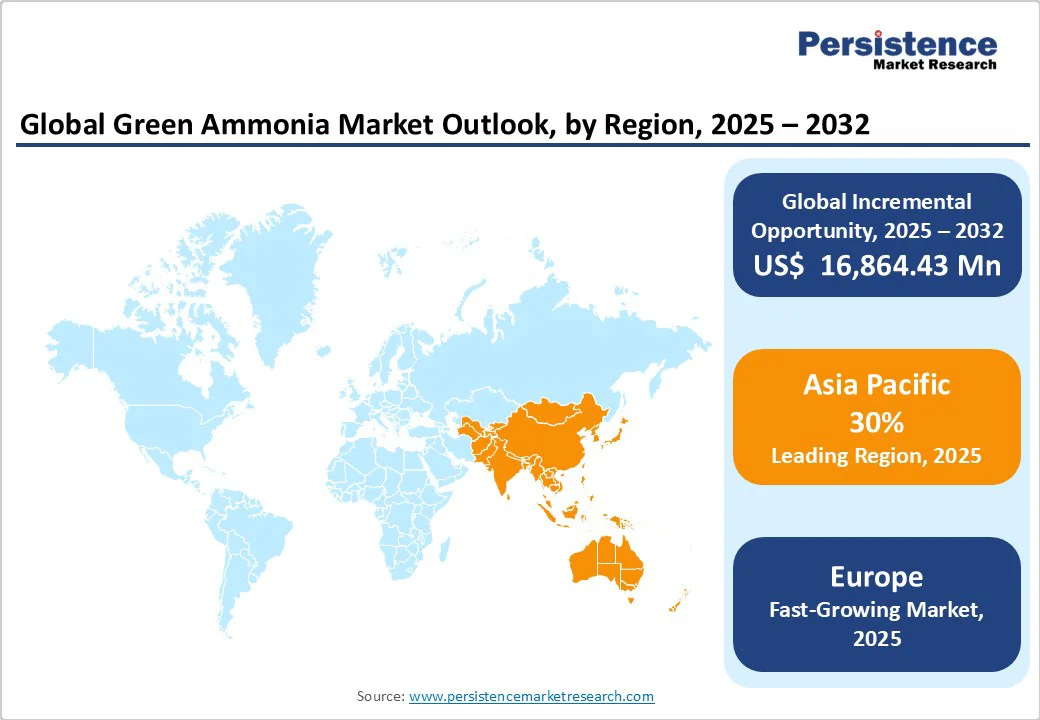
  • Leading Region: Asia Pacific dominates with 35% global green ammonia market share in 2025, expanding rapidly, driven by China’s renewable energy leadership and India’s green ammonia projects, fostering large-scale sustainable hydrogen and ammonia production.
  • Fastest-Growing Region: Europe is experiencing rapid expansion in the green ammonia market, driven by stringent decarbonization goals, the integration of renewable energy, and investments in hydrogen-based technologies. Government policies, rising demand for sustainable fertilizers, and its potential as a clean fuel for shipping and power generation are accelerating market adoption across the region.
  • Dominant Production Process: Alkaline water electrolysis holds a dominant 77.7% share in the green ammonia market, owing to its technological maturity, cost-effectiveness, and wide-scale deployment. Its reliability, lower capital costs, and suitability for large-scale hydrogen production make it the preferred method, driving its leading position over emerging electrolysis technologies.
  • Dominant End-user: The fertilizer sector leads with a 54.4% share; transportation exhibits the fastest growth due to maritime decarbonization mandates.   
  • Key Developments: In February 2025, Uniper SE and Kyuden International signed an MoU for ammonia trading, and Avaada partnered with Casale to develop India’s largest green ammonia plant.
Key Insights Details

Green Ammonia Market Size (2025E)

US$296.1 Mn

Market Value Forecast (2032F)

US$17,160.5 Mn

Projected Growth (CAGR 2025 to 2032)

71.2%

Historical Market Growth (CAGR 2019 to 2024)

66.8%

global-green-ammonia-market-size-2025-2032

Market Dynamics

Driver: Global Push for Decarbonization and Renewable Energy Integration

The green ammonia market is experiencing strong growth, driven by the global emphasis on decarbonization and the adoption of renewable energy. Green ammonia, produced using renewable sources such as solar and wind power, offers a sustainable alternative to conventional ammonia derived from fossil fuels. This shift is crucial for reducing greenhouse gas emissions and meeting international climate targets. Governments worldwide are supporting this transition through policies and initiatives that promote the production and use of green ammonia. For instance, India’s National Green Hydrogen Mission aims to scale up green hydrogen and its derivatives, including green ammonia, by supporting cost-efficient production, domestic consumption, and export potential.

A concrete example of this trend is the ACME Group’s green ammonia project in Gopalpur, Odisha, developed in partnership with Japan’s IHI Corporation. This project will produce green ammonia entirely using renewable energy, directly contributing to India’s decarbonization targets and demonstrating the feasibility of large-scale green ammonia production. Such initiatives underscore the role of government support and international collaboration in accelerating the transition to a low-carbon energy future.

Restraint: High Production Costs and Infrastructure Limitations

One of the primary restraints of the green ammonia market is the high cost of production. Unlike conventional ammonia, green ammonia relies on renewable energy sources and electrolysis processes, which require significant capital investment and advanced technology. The cost of green hydrogen, a key input, remains relatively high due to limited economies of scale, making green ammonia more expensive than its fossil fuel-based counterpart. This price disparity can slow adoption, particularly in regions where conventional ammonia remains economically competitive.

Infrastructure limitations further challenge market growth. The production, storage, and transportation of green ammonia require specialized facilities and safety measures, which are not yet widely established. The limited availability of renewable energy infrastructure and supporting supply chains can hinder large-scale deployment, thereby restricting the industry’s ability to meet the growing global demand for sustainable ammonia solutions.

Opportunity: Technological Advancements and Policy Support in Emerging Markets

The green ammonia market is gaining momentum due to rapid technological advancements and strong policy support, particularly in emerging markets. Innovations in electrolysis, renewable energy integration, and ammonia synthesis are significantly improving production efficiency while reducing costs. These technological improvements make green ammonia increasingly competitive with conventional ammonia, opening new avenues for adoption across industrial, agricultural, and energy sectors.

Emerging markets are also benefiting from supportive government policies and strategic initiatives that aim to promote sustainable energy solutions. Incentives such as subsidies, tax benefits, and funding for research and development are accelerating the deployment of green ammonia projects. Countries in Asia, the Middle East, and South America are actively encouraging investment in renewable energy infrastructure, which directly supports the production of large-scale green ammonia. Combined, technological innovation and proactive policy frameworks create a favorable environment for market expansion, positioning green ammonia as a key component in achieving global decarbonization goals and facilitating a transition toward a low-carbon energy economy.

Category-wise Insights

Production Process Insights

Alkaline Water Electrolysis dominates the green ammonia market with 77.7% market share, benefiting from its mature technology status, cost-effectiveness, and proven scalability for large-scale hydrogen production. This technology offers lower operating costs compared to emerging alternatives, with stack costs of €225 per kW for large deployments and the ability to operate at high pressures up to 30 bar, reducing compression requirements for ammonia synthesis. The segment's dominance reflects its compatibility with renewable energy sources and established supply chains for system components.

Proton Exchange Membrane (PEM) electrolysis represents the fastest-growing technology segment, driven by its superior performance characteristics including high current densities, rapid response times, and high-purity hydrogen output. PEM systems demonstrate enhanced operational flexibility for integrating dynamic renewable energy, making them particularly suitable for variable wind and solar power applications. The PEM electrolyzer market is projected to reach $2.3 billion by 2031, growing at a 38% CAGR, reflecting the increasing adoption of high-performance green ammonia applications.

End-user Insights

Fertilizer applications command the dominant market position with 54.4% share, representing the largest established use case for ammonia in global agriculture. The agriculture sector accounts for 58.6% of the green ammonia market and is projected to grow at a 65% CAGR through 2032, driven by increasing demand for sustainable fertilizers and carbon-neutral agricultural practices. This segment benefits from existing distribution infrastructure, established customer relationships, and growing environmental regulations requiring reduced carbon footprint in food production systems.

Transportation emerges as the fastest-growing application segment, driven by maritime decarbonization mandates and the shipping industry's adoption. The International Maritime Organization's emissions reduction targets and ammonia's carbon-free combustion characteristics position it as a preferred marine fuel alternative. Shipping companies are already ordering ammonia-powered vessels, with projections indicating ammonia will comprise 35% to 50% of the marine fuel mix by 2050. The segment's growth reflects urgent industry decarbonization needs and ammonia's practical advantages over hydrogen for maritime applications.

global-green-ammonia-market-outlook-by-end-user-2025-2032

Regional Insights

North America Green Ammonia Market Trends

In 2025, North America market, driven by strong government support, advanced renewable energy infrastructure, and the adoption of low-carbon technologies. The region’s focus on decarbonizing industrial processes and transportation has accelerated the use of ammonia produced from renewable sources as a sustainable energy carrier. Significant investments in wind, solar, and hydrogen production facilities are enabling the development of large-scale projects. Supportive policies, tax incentives, and research initiatives in the U.S. and Canada are fostering innovation and reducing production costs, reinforcing North America’s leadership in advancing clean ammonia solutions globally.

Europe Green Ammonia Market Trends

Europe is the fastest-growing region in the green ammonia market, driven by the region’s ambitious decarbonization targets and strong emphasis on renewable energy adoption. Governments across the EU are implementing policies and incentives to promote the production of green hydrogen and ammonia, supporting the industrial and transportation sectors in reducing carbon emissions. Advanced renewable energy infrastructure, particularly in wind and solar, enables large-scale green ammonia projects. Ongoing research and innovation in electrolysis and storage technologies further enhance production efficiency. Combined, regulatory support, technological advancements, and sustainability initiatives position Europe as a key contributor to the global transition toward low-carbon ammonia solutions.

Asia Pacific Green Ammonia Market Trends

The Asia Pacific dominates the green ammonia market, holding a 30% market share in 2025, driven by rapid industrialization and ambitious government initiatives across key markets. China's coal-to-gas infrastructure revamps and India's National Green Hydrogen Mission, targeting 5 million metric tonnes annual production, create substantial demand. Japan and South Korea pioneer ammonia bunkering pilots and co-firing applications in power generation, while regional policy packages offer renewable-power wheeling and tax rebates to reduce delivered costs.

The region benefits from manufacturing cost advantages, skilled labor availability, and government investments in pipeline networks and offshore exploration programs. ASEAN countries present emerging opportunities through energy infrastructure development and increasing industrial energy consumption. Years.

global-green-ammonia-market-outlook-by-region-2025-2032

Competitive Landscape

The global green ammonia market is highly competitive, characterized by ongoing innovation and technological advancements aimed at improving production efficiency and reducing costs. Companies are focusing on strategic collaborations, joint ventures, and capacity expansions to strengthen their market presence. Investment in research and development is driving breakthroughs in electrolysis, storage, and renewable energy integration. Market participants are also exploring sustainable supply chains and large-scale project implementations to meet growing global demand, positioning the industry for long-term growth and resilience.

Key Developments

  • February 2025: Uniper SE and Kyuden International Corporation signed a Memorandum of Understanding (MoU) to explore collaboration in hydrogen and ammonia trading, renewable energy, and carbon capture, utilization, and storage (CCUS). The partnership aims to create business opportunities by exchanging knowledge and developing additional value in these sectors.
  • January 2025: Avaada Group partnered with Switzerland-based Casale to develop India’s largest green ammonia plant in Gopalpur, Odisha. The facility will have a production capacity of 1,500 tonnes per day, operating entirely on renewable energy and utilizing advanced ammonia production technology to ensure a carbon-free process.
  • May 2025: OCI Energy and Greenko signed a contract for the production of 250,000 metric tons of low-carbon ammonia annually. The ammonia will be produced using renewable energy and is aimed at supporting sustainable transportation applications

Companies Covered in Green Ammonia Market

  • CF Industries Holdings, Inc
  • BASF SE
  • Yara International ASA
  • Maire Tecnimont S.p.A.
  • ACME Group
  • Fertiglobe plc
  • NEL Hydrogen
  • ThyssenKrupp AG
  • ITM Power
  • Holder Topsoe
  • Green Hydrogen Systems
  • Greenfield Nitrogen LLC
  • Siemens
  • Others
Frequently Asked Questions

The green ammonia market is projected to reach US$296.1 mn in 2025, driven by renewable energy and transportation fuel demand.

Decarbonization efforts, renewable energy integration, and sustainable agriculture fuel market growth.

The green ammonia market will grow from US$296.1 Mn in 2025 to US$17,160.5 mn by 2032, with a CAGR of 71.2%.

Electrolysis advancements and policy support in emerging markets drive opportunities in transportation and fertilizers.

Leading players include CF Industries Holdings, Inc., BASF SE, Yara International ASA, Maire Tecnimont S.p.A., ACME Group, Fertiglobe plc, NEL Hydrogen, ThyssenKrupp AG, ITM Power, Haldor Topsoe, Green Hydrogen Systems, Greenfield Nitrogen LLC, and Siemens.

Global Green Ammonia Market Report Scope
Report Attribute Details

Historical Data/Actuals

2019 - 2024      

Forecast Period

2025 - 2032

Market Analysis

Value: US$ Mn, Volume: As Applicable

Geographical Coverage

  • North America
  • Europe
  • East Asia
  • South Asia and Oceania
  • Latin America
  • Middle East and Africa

Segmental Coverage

  • Production Process
  • End-user
  • Region

Competitive Analysis

  • CF Industries Holdings, Inc
  • BASF SE
  • Yara International ASA
  • Maire Tecnimont S.p.A.
  • ACME Group
  • Fertiglobe plc
  • NEL Hydrogen
  • ThyssenKrupp AG
  • ITM Power
  • Holder Topsoe
  • Green Hydrogen Systems
  • Greenfield Nitrogen LLC
  • Siemens
  • Others

Report Highlights

  • Market Forecast and Trends
  • Competitive Intelligence and Share Analysis
  • Growth Factors and Challenges
  • Strategic Growth Initiatives
  • Pricing Analysis
  • Future Opportunities and Revenue Pockets
  • Market Analysis Tools
Market Segmentation

By Production Process

  • Proton Exchange Membrane
  • Alkaline Water Electrolysis

By End-user

  • Fertilizer
  • Transportation
  • Power Generation
  • Industrial Feedstock
  • Others

By Region

  • North America
  • Europe
  • East Asia
  • South Asia and Oceania
  • Latin America
  • Middle East and Africa

Related Reports

  1. Executive Summary
    1. Global Green Ammonia Market Snapshot 2025 and 2032
    2. Market Opportunity Assessment, 2025-2032, US$ Mn
    3. Key Market Trends
    4. Industry Developments and Key Market Events
    5. Demand Side and Supply-Side Analysis
    6. PMR Analysis and Recommendations
  2. Market Overview
    1. Market Scope and Definitions
    2. Value Chain Analysis
    3. Macro-Economic Factors
      1. Global GDP Outlook
      2. Global Chemical Industry Overview
      3. Global Transportation Industry Overview
    4. Forecast Factors – Relevance and Impact
    5. COVID-19 Impact Assessment
    6. PESTLE Analysis
    7. Porter's Five Forces Analysis
    8. Geopolitical Tensions: Market Impact
    9. Regulatory and Technology Landscape
  3. Market Dynamics
    1. Drivers
    2. Restraints
    3. Opportunities
    4. Trends
  4. Price Trend Analysis, 2019 – 2032
    1. Region-wise Price Analysis
    2. Price by Segments
    3. Price Impact Factors
  5. Global Green Ammonia Market Outlook: Historical (2019 – 2024) and Forecast (2025 – 2032)
    1. Key Highlights
    2. Global Green Ammonia Market Outlook: Production Process
      1. Introduction/Key Findings
      2. Historical Market Size (US$ Mn) and Volume (Units) Analysis by Production Process, 2019-2024
      3. Current Market Size (US$ Mn) and Volume (Units) Forecast, by Production Process, 2025-2032
        1. Solid Oxide Electrolysis
        2. Alkaline Water Electrolysis
      4. Market Attractiveness Analysis: Production Process
    3. Global Green Ammonia Market Outlook: End-User
      1. Introduction/Key Findings
      2. Historical Market Size (US$ Mn) and Volume (Units) Analysis by End-User , 2019-2024
      3. Current Market Size (US$ Mn) and Volume (Units) Forecast, by End-User , 2025-2032
        1. Fertilizer
        2. Transportation
        3. Power Generation
        4. Industrial Feedstock
        5. Others
      4. Market Attractiveness Analysis: End-User
  6. Global Green Ammonia Market Outlook: Region
    1. Key Highlights
    2. Historical Market Size (US$ Mn) and Volume (Units) Analysis by Region, 2019-2024
    3. Current Market Size (US$ Mn) and Volume (Units) Forecast, by Region, 2025-2032
      1. North America
      2. Europe
      3. East Asia
      4. South Asia & Oceania
      5. Latin America
      6. Middle East & Africa
    4. Market Attractiveness Analysis: Region
  7. North America Green Ammonia Market Outlook: Historical (2019 – 2024) and Forecast (2025 – 2032)
    1. Key Highlights
    2. Pricing Analysis
    3. North America Market Size (US$ Mn) and Volume (Units) Forecast, by Country, 2025-2032
      1. U.S.
      2. Canada
    4. North America Market Size (US$ Mn) and Volume (Units) Forecast, by Production Process, 2025-2032
      1. Solid Oxide Electrolysis
      2. Alkaline Water Electrolysis
    5. North America Market Size (US$ Mn) and Volume (Units) Forecast, by End-User , 2025-2032
      1. Fertilizer
      2. Transportation
      3. Power Generation
      4. Industrial Feedstock
      5. Others
  8. Europe Green Ammonia Market Outlook: Historical (2019 – 2024) and Forecast (2025 – 2032)
    1. Key Highlights
    2. Pricing Analysis
    3. Europe Market Size (US$ Mn) and Volume (Units) Forecast, by Country, 2025-2032
      1. Germany
      2. Italy
      3. France
      4. U.K.
      5. Spain
      6. Russia
      7. Rest of Europe
    4. Europe Market Size (US$ Mn) and Volume (Units) Forecast, by Production Process, 2025-2032
      1. Solid Oxide Electrolysis
      2. Alkaline Water Electrolysis
    5. Europe Market Size (US$ Mn) and Volume (Units) Forecast, by End-User , 2025-2032
      1. Fertilizer
      2. Transportation
      3. Power Generation
      4. Industrial Feedstock
      5. Others
  9. East Asia Green Ammonia Market Outlook: Historical (2019 – 2024) and Forecast (2025 – 2032)
    1. Key Highlights
    2. Pricing Analysis
    3. East Asia Market Size (US$ Mn) and Volume (Units) Forecast, by Country, 2025-2032
      1. China
      2. Japan
      3. South Korea
    4. East Asia Market Size (US$ Mn) and Volume (Units) Forecast, by Production Process, 2025-2032
      1. Solid Oxide Electrolysis
      2. Alkaline Water Electrolysis
    5. East Asia Market Size (US$ Mn) and Volume (Units) Forecast, by End-User , 2025-2032
      1. Fertilizer
      2. Transportation
      3. Power Generation
      4. Industrial Feedstock
      5. Others
    6. East Asia Market Size (US$ Mn) and Volume (Units) Forecast, by , 2025-2032
  10. South Asia & Oceania Green Ammonia Market Outlook: Historical (2019 – 2024) and Forecast (2025 – 2032)
    1. Key Highlights
    2. Pricing Analysis
    3. South Asia & Oceania Market Size (US$ Mn) and Volume (Units) Forecast, by Country, 2025-2032
      1. India
      2. Southeast Asia
      3. ANZ
      4. Rest of SAO
    4. South Asia & Oceania Market Size (US$ Mn) and Volume (Units) Forecast, by Production Process, 2025-2032
      1. Solid Oxide Electrolysis
      2. Alkaline Water Electrolysis
    5. South Asia & Oceania Market Size (US$ Mn) and Volume (Units) Forecast, by End-User , 2025-2032
      1. Fertilizer
      2. Transportation
      3. Power Generation
      4. Industrial Feedstock
      5. Others
  11. Latin America Green Ammonia Market Outlook: Historical (2019 – 2024) and Forecast (2025 – 2032)
    1. Key Highlights
    2. Pricing Analysis
    3. Latin America Market Size (US$ Mn) and Volume (Units) Forecast, by Country, 2025-2032
      1. Brazil
      2. Mexico
      3. Rest of LATAM
    4. Latin America Market Size (US$ Mn) and Volume (Units) Forecast, by Production Process, 2025-2032
      1. Solid Oxide Electrolysis
      2. Alkaline Water Electrolysis
    5. Latin America Market Size (US$ Mn) and Volume (Units) Forecast, by End-User , 2025-2032
      1. Fertilizer
      2. Transportation
      3. Power Generation
      4. Industrial Feedstock
      5. Others
  12. Middle East & Africa Green Ammonia Market Outlook: Historical (2019 – 2024) and Forecast (2025 – 2032)
    1. Key Highlights
    2. Pricing Analysis
    3. Middle East & Africa Market Size (US$ Mn) and Volume (Units) Forecast, by Country, 2025-2032
      1. GCC Countries
      2. South Africa
      3. Northern Africa
      4. Rest of MEA
    4. Middle East & Africa Market Size (US$ Mn) and Volume (Units) Forecast, by Production Process, 2025-2032
      1. Solid Oxide Electrolysis
      2. Alkaline Water Electrolysis
    5. Middle East & Africa Market Size (US$ Mn) and Volume (Units) Forecast, by End-User , 2025-2032
      1. Fertilizer
      2. Transportation
      3. Power Generation
      4. Industrial Feedstock
      5. Others
  13. Competition Landscape
    1. Market Share Analysis, 2024
    2. Market Structure
      1. Competition Intensity Mapping
      2. Competition Dashboard
    3. Company Profiles
      1. CF Industries Holdings, Inc
        1. Company Overview
        2. Product Portfolio/Offerings
        3. Key Financials
        4. SWOT Analysis
        5. Company Strategy and Key Developments
      2. BASF SE
      3. Yara International ASA
      4. Maire Tecnimont S.p.A.
      5. ACME Group
      6. Fertiglobe plc
      7. NEL Hydrogen
      8. ThyssenKrupp AG
      9. ITM Power
      10. Holder Topsoe
      11. Green Hydrogen Systems
      12. Greenfield Nitrogen LLC
  14. Appendix
    1. Research Methodology
    2. Research Assumptions
    3. Acronyms and Abbreviations

Research Methodology Framework for Market Research Excellence

At Persistence Market Research, we implement a comprehensive, validated, and multi-dimensional approachto market analysis that delivers actionable insights across complex market landscapes. Our methodology combines the analytical rigor of leading consulting firms with innovative research techniques, ensuring robust market assessments that guide strategic decision-making with confidence.

Core Research Philosophy

Our methodology is built on four foundational pillars:

Research Philosophy Image

At Persistence Market Research, our methodology is designed to transcend conventional market studies by combining analytical rigor, multi-source validation, and future-focused insights.

We integrate advanced research frameworks, robust data collection strategies, cutting-edge analytics, and innovative technologies to deliver a 360-degree view of complex markets.

We integrate advanced research frameworks, robust data collection strategies, cutting-edge analytics, and innovative technologies to deliver a 360-degree view of complex markets.

Each stage spanning from strategic scoping and hypothesis-building to competitive intelligence, quality validation, and actionable recommendations is engineered to provide clients with unmatched clarity, precision, and confidence in decision-making.

By embedding innovation and technology at the core, our approach ensures that insights are not only comprehensive but also predictive, empowering businesses to seize opportunities, mitigate risks, and achieve sustainable growth

Research Philosophy Image

Capturing Key Information and Events

During this phase, key research objectives focus on essential information and data points for assessing the market, including:

Research Philosophy Image

TAM-SAM-SOM Framework Implementation

We employ both top-down and bottom-up approaches to ensure accurate market sizing.

Top-Down Market SizingBottom-Up Market Sizing
Universe Definition: Total global/regional market identificationUnit Economics: Average transaction values, purchase frequencies, customer lifecycle
Segmentation Filters: Geographic, demographic, and behavioral constraintsCustomer Segmentation: Detailed buyer persona development and sizing
Market Share Analysis: Competitive landscape assessment and share allocationPenetration Analysis: Market penetration rates by segment and geography
Growth Rate Application: Historical trends and forward-looking growth assumptionsScaling Methodology: Extrapolation techniques with confidence intervals

Validation & Cross-Verification

  • Triangulation: Comparing top-down and bottom-up results for consistency
  • Sensitivity Analysis: Testing key assumptions and parameter variations
  • Peer Benchmarking: Comparison with analogous markets and industry benchmarks
  • Expert Review: External validation through industry specialist consultation

Research Philosophy Image

Forecasting & Projection Modeling

Our proprietary forecasting models incorporate multiple variables and scenarios.

Forecasting Components

  • Historical Trend Analysis: 10-year historical growth patterns and cyclical variations
  • Driver-Based Modeling: Economic indicators, demographic shifts, technology adoption
  • Scenario Planning: Base case, optimistic, and conservative projections
  • Monte Carlo Simulations: Probability-weighted outcomes and risk assessments

Model Validation

  • Back-Testing: Historical accuracy assessment over 3–5-year periods
  • Cross-Validation: Multiple modeling approaches for result comparison
  • External Benchmarking: Comparison with established market forecasts
  • Continuous Calibration: Quarterly model updates based on new data

Comprehensive Data Collection Strategy

Our secondary research phase establishes a robust knowledge base utilizing diverse, credible sources.

Secondary Data Sourcess

  • Industry Publications & Reports
  • Government & Regulatory Data
  • Financial Intelligence (filings & reports)
  • Academic Research & Digital Intelligence

Quality Assurance Protocol

  • Source credibility assessment and publication date validation
  • Data consistency checks across multiple sources
  • Bias identification and neutralization techniques
  • Information gap tracking for primary research prioritization

Research Philosophy Image

Primary Research Excellence

Our primary research methodology employs best-in-class techniques to capture unique market insights.

Quantitative Research Methods

  • Large-Scale Surveys: Statistically representative samples with 95% confidence intervals
  • Survey Methodology: Multi-channel deployment (online, telephone, in-person)
  • Question Architecture and Response Optimization

Qualitative Research Methods

  • Executive Interviews
  • Focus Groups
  • Expert Consultations

Quality Assurance & Validation Framework

Multi-Stage Validation Process

  • Source Verification and Consistency Testing
  • Outlier Detection and Bias Assessment
  • Peer Review Process and External Validation
  • Sensitivity Analysis and Confidence Intervals

Research Philosophy Image

Methodology Validation & Credibility

Our research methodology has been extensively validated through:

  • Academic Partnerships: Collaborations with top-tier business schools and research institutions
  • Client Success Stories: Documented case studies demonstrating research impact and ROI
  • Continuous Benchmarking: Performance comparison with leading global research firms

This comprehensive methodology framework positions Persistence Market Research at the forefront of market intelligence, combining the analytical sophistication of top-tier consulting firms with innovative research techniques. Our approach ensures that every market assessment delivers precise, actionable, and strategically valuable insights that drive business success in competitive market environments.

Ready to unlock your market potential? Contact our research experts to discuss how our validated methodology can transform your strategic decision-making with data-driven market intelligence.

Copyright © 2026 Persistence Market Research. All Rights Reserved

Connect With Us -
Green Ammonia Market Size and Forecast, 2032