


- Specialty & Fine Chemicals
- Bio-Lubricants Market
Bio-Lubricants Market Size, Share, and Growth Forecast 2026 - 2033
Bio-Lubricants Market by Product Type (Hydraulic Fluids, Metalworking Fluids, Gear Oils, Grease, Process Oils, Compressor Oils, Transmission Fluids, Others), Raw Material (Vegetable Oils, Synthetic Esters & Glycols, Animal Fats, Others), End-Use (Automotive, Aerospace & Defence, Construction & Mining, Marine & Shipping, Agriculture, Oil & Gas, Food, Distribution Channel (OEM, Aftermarket), and Regional Analysis, 2026 - 2033
Bio-Lubricants Market Size and Trend Analysis
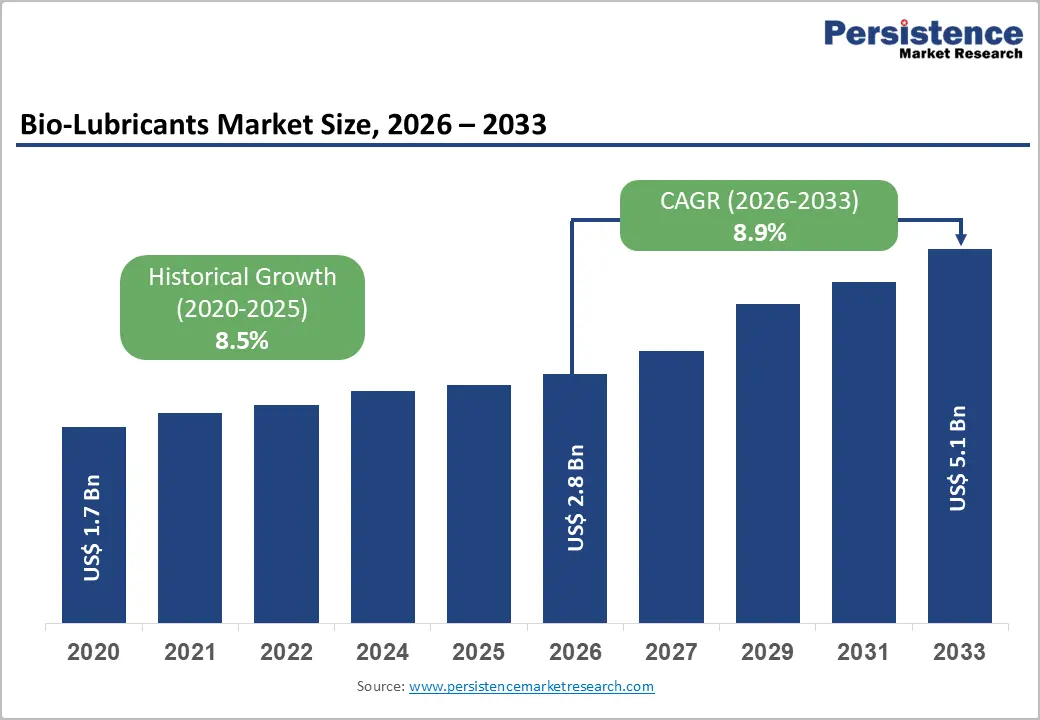
The global bio-lubricants market size is expected to be valued at US$ 2.8 billion in 2026 and projected to reach US$ 5.1 billion by 2033, growing at a CAGR of 8.9% between 2026 and 2033.
This steady growth trajectory is principally driven by tightening global environmental regulations that mandate the use of biodegradable lubricants in environmentally sensitive applications, combined with a broad industry pivot toward sustainability. The U.S. Environmental Protection Agency (EPA)'s Vessel General Permit (VGP) and the EU Ecolabel program both require the deployment of Environmentally Acceptable Lubricants (EALs) at all oil-to-sea interfaces, creating structural and recurring demand.
The surge in adoption across automotive, construction, marine, and food processing sectors, where biodegradability, low toxicity, and performance advantages align with both regulatory requirements and corporate ESG commitments, is accelerating the replacement of conventional petroleum-based lubricants with bio-based alternatives globally.
Key Industry Highlights
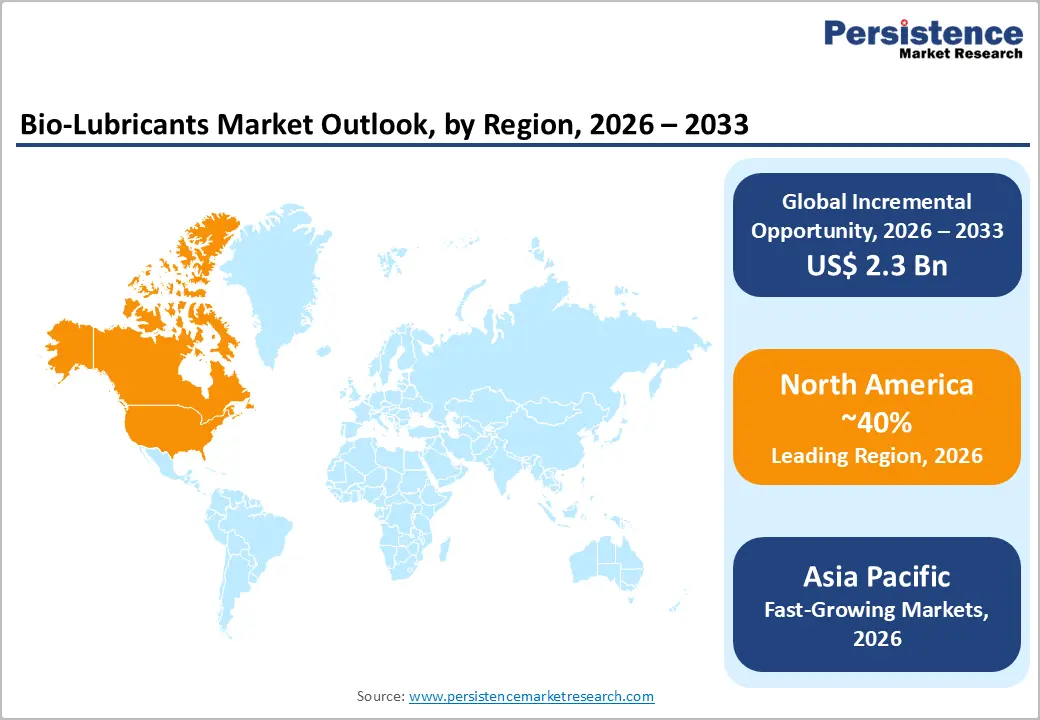
- Leading Region: North America dominates the global bio-lubricants market with approximately 40% share in 2025, anchored by the U.S. market at US$ 1.1 billion, driven by EPA VGP and VIDA regulations, USDA BioPreferred mandates, and a strong base of specialized bio-lubricant producers.
- Fastest Growing Region: Asia Pacific is the fastest-growing bio-lubricants market through 2033, propelled by China's automotive and industrial expansion, India's growing agricultural and food-processing sectors, and ExxonMobil's 159-million-liter India facility investment coming online in 2025.
- Dominant Product Type Segment: Hydraulic Fluids lead the Product Type category with 35% market share in 2025, driven by mandatory EAL requirements in forestry, marine, and construction hydraulic systems under EU Ecolabel and U.S. EPA VGP regulatory frameworks globally.
- Fastest Growing End-use Segment: The agriculture end-use segment is among the fastest-growing categories through 2033, driven by adoption of biodegradable hydraulic and implement lubricants in farm machinery operating in ecologically sensitive areas, supported by OEM mandates and environmental liability risk management.
- Key Opportunity: Marine & Shipping presents a high-value structural opportunity, with VIDA 2024 standards and IMO's net-zero 2050 targets compelling >100,000 commercial vessels globally to replace conventional lubricants at all oil-to-sea interfaces with certified environmentally acceptable bio-lubricant alternatives.
Market Dynamics
Drivers - Stringent Environmental Regulations and Mandatory Eco-Label Compliance Accelerating Adoption
Regulatory mandates are among the most powerful structural drivers of the bio-lubricants market. In the United States, the EPA's Vessel General Permit (VGP, 2013), which may face even stricter revisions in 2026 under the Vessel Incidental Discharge Act (VIDA), compels all vessels over 79 feet to use EALs at all oil-to-sea interfaces, covering stern tubes, rudder bearings, azimuth thrusters, and propulsion pods. In Europe, the EU Ecolabel for Lubricants (Commission Decision 2011/381/EU) mandates a minimum 60% ultimate biodegradability within 28 days and at least 25% bio-carbon content, criteria that petroleum-based products structurally cannot satisfy.
By contrast, bio-lubricants derived from vegetable oils biodegrade at rates of 60-98% within 28 days, confirming their regulatory compliance advantage. Germany's Blue Angel eco-label reinforces these thresholds domestically, while the International Maritime Organization (IMO) sets converging international standards, collectively expanding addressable markets in marine, offshore, and industrial applications.
Rising Demand from Automotive and Industrial Equipment Sectors Driven by Sustainability Mandates
The automotive sector remains the largest end-use driver for bio-lubricants globally. Tightening CO2 emission regulations in the European Union, the United States, and China are compelling OEMs to qualify lower-friction, higher-efficiency lubricants, areas where bio-based synthetic esters and vegetable-oil-derived formulations offer measurable performance improvements over mineral oils.
Research published in the journal Lubricants (MDPI, 2025) confirms that advanced bio-based formulations can achieve friction reductions of up to 40% in comparative tribological testing. Industrial machinery and construction equipment operators are simultaneously adopting bio-lubricants for hydraulic systems, where accidental spills into environmentally sensitive areas pose legal liability. High biodegradability mitigates remediation costs and strengthens compliance with OSPAR and Nordic Swan certification requirements across European industrial operations.
Restraints - Higher Production Costs Relative to Mineral Oil Limiting Price-Sensitive Market Penetration
Bio-lubricants carry a significant cost premium versus conventional mineral oil products, primarily due to the higher cost of bio-based feedstocks such as rapeseed, soybean, and sunflower oils, as well as more complex refining and additive processes. In commodity-driven industries such as agriculture, construction, and general industrial manufacturing, where purchasing decisions are heavily price-anchored, this premium creates meaningful adoption friction.
Vegetable oil feedstock prices are also subject to agri-commodity market volatility, with soybean oil prices fluctuating by over 30% in certain years due to climate events and geopolitical disruptions, adding supply chain unpredictability that further dampens large-scale procurement commitments in price-sensitive regions.
Thermal and Oxidative Instability of Vegetable-Oil-Based Formulations Constraining High-Performance Applications
A fundamental technical limitation of conventional bio-lubricants, particularly those based on unmodified vegetable oils, is their susceptibility to oxidative and thermal degradation at elevated operating temperatures. This reduces service life and necessitates more frequent oil changes, increasing the total cost of ownership. Applications such as high-load gear transmissions, jet turbine lubrication in the aerospace sector, and continuous-operation industrial compressors demand lubricants that maintain stability beyond 150°C, a threshold that natural ester base oils struggle to sustain consistently without advanced additive packages. This performance gap continues to constrain bio-lubricant penetration in high-value, high-temperature segments, despite ongoing R&D investments by companies such as Klüber Lubrication and Emery Oleochemicals in thermally stabilized ester formulations.
Opportunities - Food and Beverage Processing Sector as a High Value Regulation Driven Growth Vertical
The Food & Beverage Processing industry represents one of the fastest-growing and highest-value end-use opportunities for bio-lubricant manufacturers. Lubricants used in food processing machinery are subject to rigorous safety standards, principally NSF International's H1 registration, which approves incidental food contact lubricants, and increasingly favor bio-based formulations for their non-toxic profiles and alignment with consumer safety expectations.
The global packaged food and beverage market exceeded US$ 3 trillion in 2024, and facilities worldwide are subject to HACCP and ISO 21469 hygiene standards that make petroleum-based lubricant spills a serious compliance risk. Vegetable-oil-derived and synthetic-ester bio-lubricants that carry NSF H1 certification command premium pricing and face little substitution pressure, making this segment structurally attractive for manufacturers such as Klüber Lubrication and FUCHS Group that have invested in food-grade bio-lubricant product lines.
Marine and Shipping Segment Driven by VIDA Regulatory Update and IMO Decarbonization Targets
The Marine & Shipping segment is positioned as a uniquely compelling growth opportunity, driven by a converging set of regulatory and decarbonization imperatives. In October 2024, the U.S. EPA issued updated Vessel Incidental Discharge Act (VIDA) standards compelling all vessels to use Environmentally Acceptable Lubricants (EALs) at all oil-to-sea interfaces, with anticipated further tightening in 2026.
Globally, the International Maritime Organization (IMO) has targeted a 40% reduction in CO2 emissions per transport work by 2030 and net-zero greenhouse gas emissions by 2050, creating systemic pressure on vessel operators to deploy greener auxiliary technologies, including bio-based lubricants. The global commercial shipping fleet encompasses over 100,000 vessels, and compliance-driven transition to EALs at oil-to-sea interfaces across this fleet, covering stern tubes, rudder bearings, propulsion pods, and hydraulic systems, constitutes a large, recurring, and structurally protected demand pool for bio-lubricant producers through 2033.
Category-wise Analysis
Product Type Insights
Hydraulic Fluids represent the leading product type segment, commanding approximately 35% of the global Bio-Lubricants market in 2025. This dominance is rooted in the widespread deployment of bio-based hydraulic fluids across construction, forestry, agriculture, and marine sectors, all of which involve high equipment density in environmentally sensitive areas where spill-related biodegradability requirements are legally mandated. Hydraulic systems in forestry harvesters, port cranes, and offshore platforms are specifically regulated under the EU Ecolabel and EPA VGP frameworks.
In February 2025, Renewable Lubricants Inc. launched its Bio-Ultimax 1200LT Hydraulic Fluid, specifically formulated for cold-weather operations, illustrating continued product innovation in this segment. Gear oils and greases follow with approximately 20% each, driven by transmission and bearing applications in industrial and automotive settings. Transmission fluids are the fastest-growing product type, propelled by EV drivetrain lubrication requirements.
Raw Material Insights
Vegetable oils are the dominant raw material in the bio-lubricants value chain, accounting for approximately 68% of market share in 2025. Their dominance stems from a combination of superior intrinsic lubricity, excellent biodegradability (exceeding 60% within 28 days per OECD 301B testing protocols), low toxicity to aquatic organisms, and wide domestic availability across major producing regions in Europe, North America, and the Asia Pacific.
Rapeseed (canola), soybean, and sunflower oils are the primary feedstocks, offering favorable viscosity-temperature characteristics that make them compatible with a broad range of industrial applications. The plant oil segment's 71.4% share noted in biobased lubricant studies confirms the feedstock's commercial primacy. Synthetic Esters & Glycols are the fastest-growing raw material sub-category, driven by their superior thermal and oxidative stability in high-performance automotive and aerospace applications.
End-user Insights
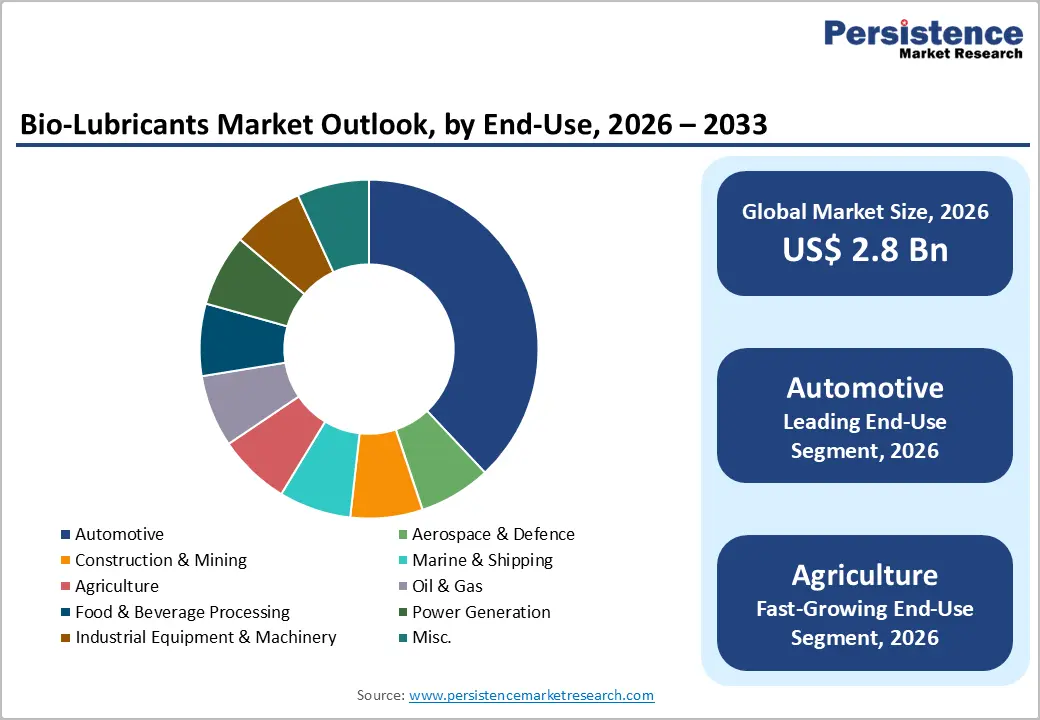
The automotive is the leading end-user category, accounting for approximately 38% of the global bio-lubricants share in 2025. Stringent emissions regulations across the EU, U.S., and China, combined with growing OEM mandates for biodegradable lubricants in conventional and electric drivetrains, have entrenched automotive as the primary consumption channel. In March 2025, Cargill published its 'Fluids for next generation EV passenger cars' brochure, detailing synthetic ester base oils designed specifically for EV gearboxes and e-axles, signaling the automotive segment's evolution into electrified mobility.
The Agriculture segment is the fastest-growing end use, supported by increasing adoption of bio-lubricants in farm equipment hydraulics and implements operating in ecologically sensitive areas, where biodegradability is both a regulatory obligation and an operational risk management tool.
Distribution Channel Insights
The OEM (Original Equipment Manufacturer) channel holds the dominant position in bio-lubricant distribution, accounting for approximately 58% of market share in 2025. OEM distribution is favored because major equipment manufacturers in the automotive, construction, and agricultural sectors increasingly specify and factory-fill bio-lubricants to comply with environmental certifications and sustainability commitments embedded in their own product warranties and ESG disclosures. Caterpillar, John Deere, and leading automotive OEMs have progressively incorporated bio-based hydraulic and gear oils into factory-fill specifications, creating captive recurring demand through the OEM channel.
The aftermarket segment is the fastest-growing distribution channel, as end-users undertaking maintenance on legacy equipment and small-fleet operators increasingly switch to bio-lubricants driven by regulatory requirements and sustainability procurement policies.
Regional Insights
North America Bio-Lubricants Market Trends and Insights
North America holds the leading position in the global bio-lubricants market with approximately 40% market share in 2025. The U.S. Bio-Lubricants Market constitutes the region's core, valued at approximately US$ 1 billion in 2025, underpinned by robust regulatory support from the EPA VGP and the October 2024 VIDA standards update, strong EV adoption driving demand for bio-based transmission fluids, and a deep innovation ecosystem anchored by companies including ExxonMobil, Renewable Lubricants Inc., Environmental Lubricants Manufacturing Inc., and NanoGraf Corporation.
A notable structural tailwind is the USDA BioPreferred Program, which mandates bio-based product procurement by federal agencies, creating a guaranteed institutional demand channel for certified bio-lubricants. In September 2024, BioBlend Renewable Resources acquired Environmental Lubricant Manufacturing (ELM), strengthening domestic manufacturing capacity for soybean-oil-derived bio-lubricants. In April 2023, ExxonMobil announced plans to establish a lubricant manufacturing facility in India to serve Asia-Pacific demand, further evidencing North American majors' global expansion strategies for sustainable lubricant product lines.
Europe Bio-Lubricants Market Trends and Insights
Europe accounts for approximately 30% of the global bio-lubricants market share in 2025, driven by the region’s leadership in eco-label standards and circular economy policies. The Germany biolubricants market is the largest in Europe, supported by a strong industrial base, well-established environmental certification systems, and the presence of leading domestic manufacturers. Companies in the region are actively transitioning toward recycled and bio-based raw materials, reflecting a broader shift toward sustainable product portfolios.
The U.K. Bio-Lubricants Market is supported by a robust product portfolio of environmentally acceptable lubricants and continued alignment with high environmental standards. The France Bio-Lubricants Market is driven by significant investments in synthetic ester production capacity to meet rising demand from the marine and renewable energy sectors. Broader regional initiatives focused on emissions reduction and sustainability continue to strengthen Europe’s position as a highly regulated and innovation-driven market for bio-lubricants.
Asia Pacific Bio-Lubricants Market Trends and Insights
Asia Pacific holds approximately 21% of the global bio-lubricants market share in 2025 and is projected to be the fastest-growing region through 2033, driven by rapid industrialization, expanding automotive production, and increasingly active environmental policy frameworks.
China Bio-Lubricants Market is the largest in the region accounting for about 45% of the regional demand. It reflects the country’s strong automotive base and rising adoption of green industrial standards under long-term ecological policies. Manufacturers in China are increasingly investing in bio-based lubricant formulations to comply with evolving biodegradability and environmental regulations across construction and mining applications.
India BioLubricants Market is emerging rapidly, supported by capacity expansions and investments in lubricant manufacturing. Growing demand from agriculture, food processing, construction, and power sectors is strengthening consumption, positioning India as a key high-growth market in the regional landscape.
Competitive Landscape
The global bio-lubricants market is moderately fragmented, with a mix of large integrated energy companies and specialized bio-based lubricant manufacturers competing across diverse application segments. Market participants differentiate through product certifications, advanced additive technologies, and performance characteristics such as thermal stability, biodegradability, and compatibility with sensitive environments. Compliance with environmental standards and food-grade approvals plays a critical role in securing contracts, particularly in regulated industries.
Strategically, companies are focusing on expanding portfolios of high-performance ester-based formulations and strengthening relationships with OEMs through qualification programs and co-development initiatives. Partnerships across the value chain are increasing, particularly in sourcing renewable feedstocks and developing next-generation additives. Mergers and acquisitions are also gaining momentum as firms seek to enhance technological capabilities and geographic presence. Additionally, growing emphasis on circular economy models and sustainable production processes is shaping long-term competitive positioning, with players investing in innovation to meet evolving regulatory and customer requirements.
Key Developments
- March 2026: White Horse Plastics adopted a synthetic ester-based hydraulic biolubricant after a three-year trial, eliminating oil changes, reducing fluid consumption and waste, and improving machine efficiency and energy savings in its injection moulding operations.
- January 2025: TotalEnergies committed EUR 120 million to expand synthetic-ester capacity at its Oudalle, France facility, targeting a 50% output uplift by Q4 2026 to meet growing marine and offshore wind bio-lubricant demand.
- November 2024: Shell and Cargill announced a joint venture to co-develop bio-derived lubricant additives displacing petroleum-based anti-wear agents in HEES (hydraulic environmental ester synthetic) fluids, targeting marine and off-highway construction applications.
Bio-Lubricants Market - Key Insights & Scope
| Key Insights | Details |
|---|---|
| Historical Market Value (2020) | US$ 1.7 Billion |
| Current Market Value (2026) | US$ 2.8 Billion |
| Projected Market Value (2033) | US$ 5.1 Billion |
| CAGR (2026 - 2033) | 8.9% |
| Leading Region | North America, 40% market share |
| Dominant Product Type | Hydraulic Fluids, 35% market share |
| Top-ranking Raw Material | Vegetable Oils, 68% market share |
| Incremental Opportunity | US$ 2.3 Billion |
Companies Covered in Bio-Lubricants Market
- ExxonMobil Corporation
- TotalEnergies SE
- Royal Dutch Shell PLC
- Cargill Inc.
- Environmental Lubricants Manufacturing, Inc. (ELM)
- Klüber Lubrication
- Castrol Limited
- FUCHS Group
- Renewable Lubricants Inc.
- Polnox Corporation
- BINOL Biolubricants
- Emery Oleochemicals
- PANOLIN AG
- VICKERS & SONS LTD
- ROWE Mineralölwerk GmbH
- BioBlend Renewable Resources LLC
- Croda International plc
- RSC Bio Solutions
- Novvi LLC
- Carl Bechem GmbH
Frequently Asked Questions
The bio-lubricants market is projected to reach US$ 2.8 billion in 2026 and US$ 5.1 billion by 2033 at a CAGR of 8.9%.
Demand is driven by stringent environmental regulations and rising sustainability commitments from automotive and industrial OEMs.
North America leads the market due to strong regulatory frameworks and high adoption of bio-based lubricants.
Key opportunities lie in marine compliance requirements and food-grade lubricants with strict hygiene standards.
Key players include ExxonMobil, Shell, TotalEnergies, FUCHS Group, Cargill, and other specialized bio-lubricant manufacturers.


