


- Automotive
- Automotive Alternative Fuel Vehicles Market
Automotive Alternative Fuel Vehicles Market Size, Share, Trends, and Growth Forecast, 2026 - 2033
Automotive Alternative Fuel Vehicles Market by Fuel Type Location (BEV, HEV, PHEV, FCV, CNG, Biofuels, and Other Gaseous Fuels), by Vehicle Type (Passenger Cars, LCV, and HCV) and Regional Analysis for 2026 - 2033
Automotive Alternative Fuel Vehicles Market Size and Trends Analysis
The global automotive alternative fuel vehicle market size is likely to be valued at US$ 25.9 billion in 2026 and is projected to reach US$ 35.9 billion by 2033, growing at a CAGR of 4.8% between 2026 and 2033. The market is driven by stringent government emissions regulations across developed and emerging economies, technological advancement in battery and fuel cell systems, and major automotive original equipment manufacturer (OEM) commitments to electrification platforms.
Key Industry Highlights:
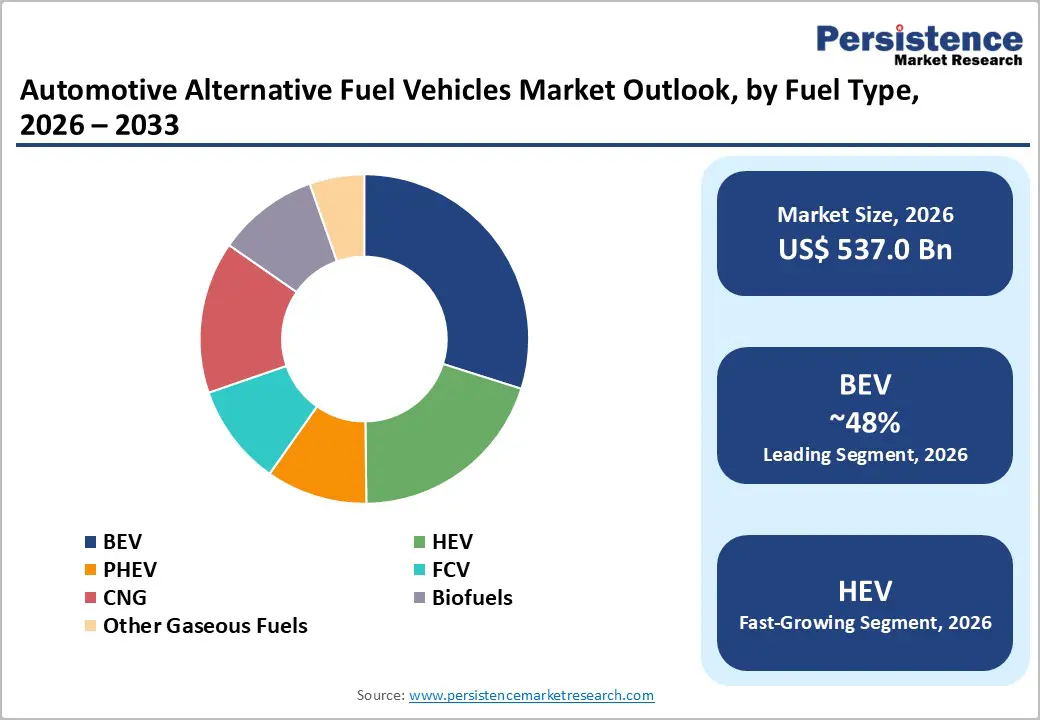
- Leading Fuel Type: Battery electric vehicles dominate with 48% market share, while biofuels and renewable fuels represent the fastest-growing segment at 9% CAGR, reflecting regulatory mandate support and existing infrastructure compatibility advantages for transitional fuel adoption.
- Vehicle Type Segmentation: Passenger cars lead with 61% market share, reflecting consumer ownership patterns and OEM model proliferation; light commercial vehicles emerge as fastest-growing application at 12% CAGR, driven by fleet electrification economics and commercial operator total cost of ownership optimization.
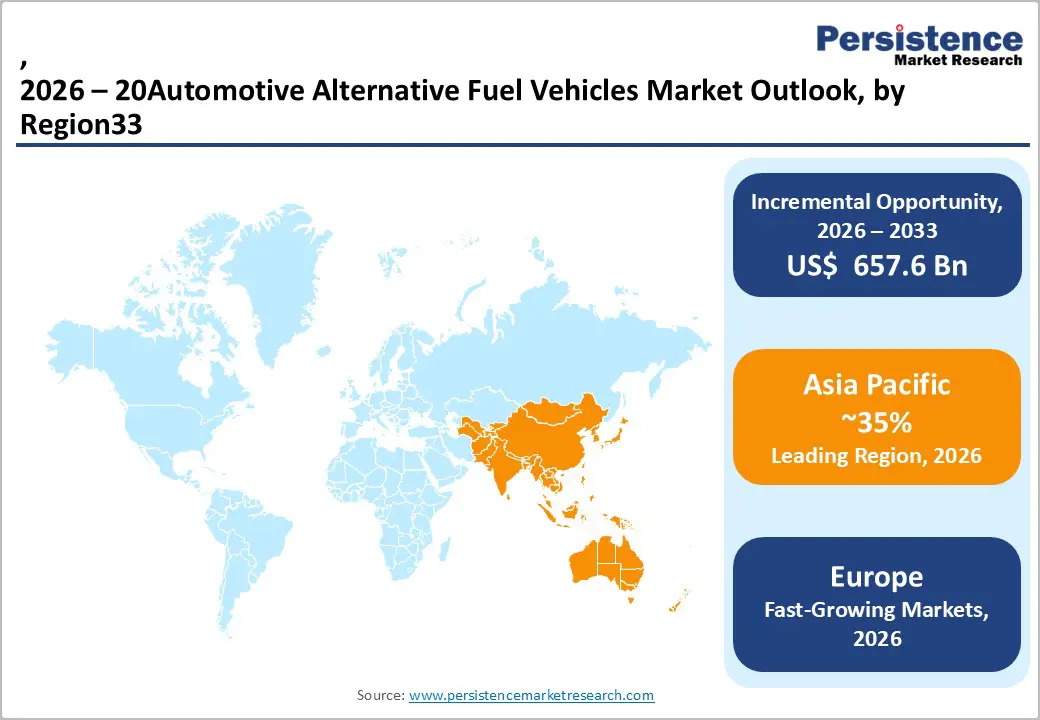
- Regional Market Dynamics: Asia Pacific dominates with 35% global market share at US$ 12 billion (2026), projected to increase to 60% by 2033; Europe commands 25% share as primary regulatory driver; North America represents 20% share with mature charging infrastructure supporting mainstream adoption.
- Technology Cost Trajectories: Battery cell costs declining from US$ 140/kWh (2024) toward US$ 80-100/kWh (2030), establishing battery-electric vehicle total cost of ownership parity with internal combustion vehicles without subsidy support; manufacturing scale expansion with 5+ million annual BEV production supporting cost reduction realization.
- Infrastructure Development: Global public charging infrastructure expanding from 2 million chargers (2024) toward 7-8 million chargers (2030); hydrogen refuelling infrastructure limited at 600 global stations, creating near-term bottleneck for hydrogen fuel cell vehicle commercialization in commercial vehicle and long-haul applications.
| Key Insights | Details |
|---|---|
|
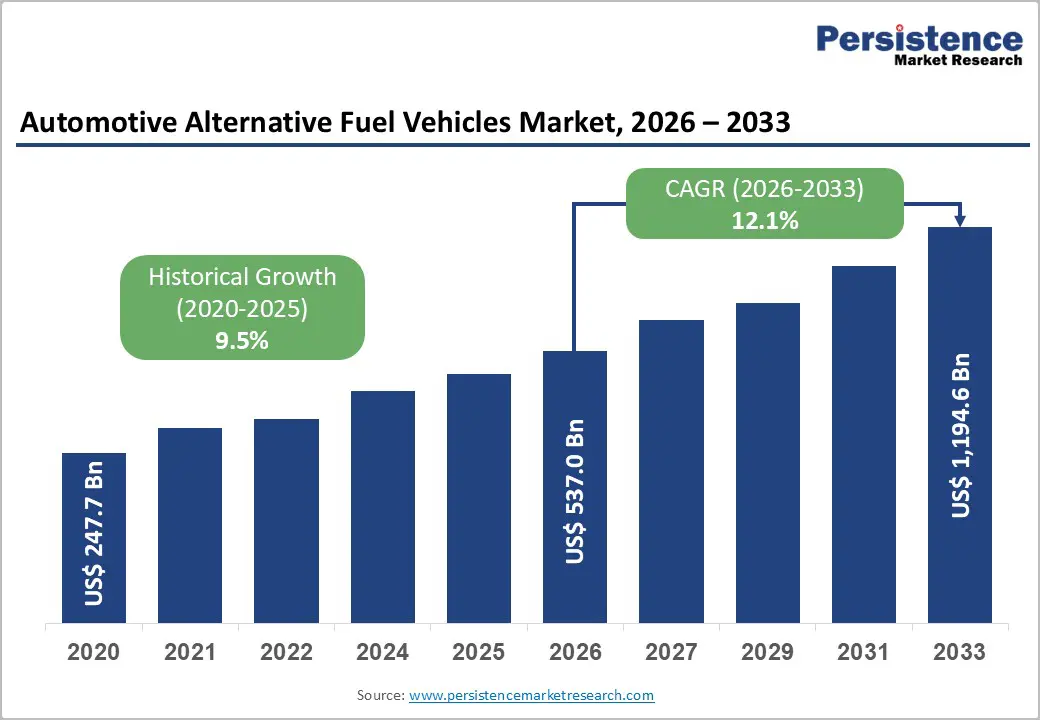
Automotive Alternative Fuel Vehicles Market Size (2026E) |
US$ 537.0 Bn |
|
Market Value Forecast (2033F) |
US$ 1,194.6 Bn |
|
Projected Growth (CAGR 2026 to 2033) |
12.1% |
|
Historical Market Growth (CAGR 2020 to 2024) |
9.5% |
Market Dynamics
Drivers - Stringent Global Regulatory Mandates and Emissions Reduction Targets
Government regulations imposing zero-emission vehicle (ZEV) mandates represent the primary market acceleration catalyst. The European Union's Euro 7 standards, effective 2026, mandate 50% emissions reduction from 2021 baselines, directly incentivizing OEM transition toward alternative fuel vehicle architectures. California's Advanced Clean Cars II regulation mandates 100% zero-emission passenger vehicle sales by 2035, representing a regulatory framework controlling 15% of the global automotive market.
The United Kingdom, Germany, and France have implemented increasingly stringent CO2 penalties on fleet average emissions, with non-compliance fines exceeding €95 per vehicle per g/km above regulatory limits. These regulatory frameworks generate a structural demand shift with quantified compliance costs exceeding US$ 50-70 billion annually across global OEM supply chains, creating powerful economic incentives for accelerated electrification investment across vehicle platforms and market segments.
Battery Technology Cost Reduction and Performance Improvement
Battery manufacturing cost decline trajectories demonstrate unprecedented acceleration, with lithium-ion cell costs declining from US$ 1,100 per kilowatt-hour (kWh) in 2010 to approximately US$ 140 per kWh in 2024, representing 87% cumulative cost reduction over 14 years. Cost trajectories are projected to reach US$ 80-100 per kWh by 2030, establishing battery-electric vehicles as cost-competitive with ICE vehicles across the majority market segments without subsidy support.
Simultaneously, battery energy density improvements have expanded EV driving range from 150 miles (2015) to 300+ miles (2024) for mainstream models, addressing consumer range historically as primary EV adoption barrier. Manufacturing scale expansion, with annual global battery cell capacity exceeding 2,500 GWh by 2024, combined with solid-state battery development timelines advancing toward 2025-2027 commercialization, establishes sustained technological momentum supporting alternative fuel vehicle competitiveness.
Restraints - Charging Infrastructure Insufficiency and Geographic Disparity
Despite rapid expansion, electric vehicle charging infrastructure remains geographically concentrated and quantitatively insufficient relative to vehicle population growth. North America possesses approximately 65,000 public charging locations with 200,000 individual ports, translating to one charging station per 300-400 electric vehicles, creating operational bottlenecks in non-metropolitan areas. Rural regions maintain charging availability gaps of 50-200 kilometers, fundamentally limiting alternative fuel vehicle adoption in geographic areas lacking urban concentration.
Infrastructure investment requirements exceed US$ 500-700 billion globally through 2033 to support projected alternative fuel vehicle fleets, representing capital deployment barriers constraining regional market penetration. Hydrogen fuel cell infrastructure development presents even greater challenges, with global hydrogen refueling stations numbering approximately 600 globally compared to 2+ million gasoline stations, creating structural adoption constraints for hydrogen vehicle segments despite superior driving range characteristics (up to 500+ kilometers per refueling cycle).
Battery Supply Chain Vulnerability and Critical Mineral Dependence
Alternative fuel vehicle battery production depends critically on lithium, cobalt, nickel, and rare-earth elements subject to geopolitical supply concentration and price volatility. The Democratic Republic of Congo supplies approximately 70% of global cobalt production, creating a monopolistic supply risk with price volatility exceeding 40% annually. Lithium production remains concentrated in South America (Chile, Argentina, Bolivia) and China, with supply constraints forecasted to constrain battery production through 2026-2027. Battery recycling infrastructure remains nascent, with only 5-10% of spent batteries entering secondary material recovery processes, limiting supply security from circular economy sources.
Opportunity - Hydrogen Fuel Cell Vehicle Infrastructure Development and Commercial Fleet Electrification
Hydrogen fuel cell vehicles (FCVs) represent an emerging market opportunity, particularly valuable for heavy commercial transportation, delivery fleet operations, and long-haul trucking applications where battery-electric limitations (charging time, weight) create operational constraints. Commercial vehicle operators' focus on total cost of ownership, combined with hydrogen FCVs' 500+ kilometer range and 5-minute refueling capability, establishes a competitive positioning advantage for logistics applications. Government hydrogen infrastructure investments, including the European Commission's US$ 455+ million Horizon Europe program commitment and U.S. Department of Energy hydrogen hub development initiatives, establish market infrastructure foundations supporting FCV commercialization.
Vehicle-to-Grid (V2G) Technology Integration and Distributed Energy Resource Participation
Battery-electric vehicle integration into smart grid systems through bidirectional charging (V2G) technology establishes emerging revenue streams and demand creation mechanisms beyond transportation functionality. Vehicle fleets functioning as distributed energy storage resources, aggregating EV battery capacity to support grid stabilization, create new economic value capture models for fleet operators, utilities, and vehicle manufacturers. Energy arbitrage opportunities through vehicle-to-grid charging enable fleet operators to capitalize on electricity price differentials, reducing operational costs while supporting renewable energy integration.
Regulatory frameworks, including EU directives and North American initiatives establishing V2G standardization and compensation mechanisms, create economic incentives for V2G technology adoption. This convergence of transportation electrification and distributed energy integration establishes a market opportunity potentially valued at US$ 15-20 billion through 2033, with revenue streams extending beyond vehicle manufacturing to energy services, demand response participation, and grid stabilization markets.
Category-wise Analysis
Fuel Type Insights
Battery electric vehicles (BEVs) hold 48% fuel-type market share, driven by zero tailpipe emissions, high efficiency, lower operating costs, and growing OEM model availability. With over 5 million units produced annually, BEVs benefit from strong manufacturing scale and extensive global charging networks exceeding 2 million units, supporting broad consumer adoption. Their decade-long market maturity further strengthens competitive positioning over hydrogen or emerging alternatives.
Biofuels, including biodiesel, bioethanol, SAF, and advanced waste-derived fuels, represent the fastest-growing segment, supported by regulatory mandates such as the EU’s 14% renewable transport energy target by 2030. Their drop-in compatibility with existing ICE vehicles and lower infrastructure requirements boost adoption. Despite higher production costs, strong lifecycle CO2 reductions (50–80%) and policy incentives drive 8% annual growth, creating a US$ 3.5 billion opportunity by 2033.
Vehicle Type Insights
Passenger vehicles hold 61% share of the alternative fuel vehicle market, supported by strong consumer ownership patterns and broad OEM model availability across budget to premium categories. With over 80 million annual global sales, the segment offers the largest addressable base for alternative fuel penetration. Incentives such as U.S. EV tax credits, European subsidies, and China’s EV programs further accelerate adoption. Premium buyers’ early adopters of advanced technologies drive initial market uptake, supported by more than 30 electric passenger models from Tesla, Volkswagen, BYD, and others.
Light commercial vehicles are the fastest-growing segment, projected to expand at 12% CAGR through 2033. Fleet operators benefit from lower operating costs and stable fuel expenses, with major logistics players committing to over 500,000 electric vans by 2030. Predictable daily routes align with current BEV ranges, while urban emission regulations further boost adoption, creating an US$ 8 billion opportunity by 2033.
Regional Market Insights and Trends
North America Automotive Alternative Fuel Vehicle Market Insights
North America controls approximately 26-28% of the global alternative fuel vehicle market share, valued at approximately US$ 6.5-7 billion in 2026, with projections reaching US$ 9-10 billion by 2033. The United States represents the dominant regional contributor, accounting for 80%+ of the North American market value, driven by a mature consumer vehicle market exceeding 280 million units, the highest per-capita vehicle ownership globally, and substantial OEM manufacturing infrastructure transitioning toward electrification platforms.
Regulatory mandates establish the primary growth drive, with California's Zero Emission Vehicle (ZEV) program and federal EPA tailpipe emissions standards creating compliance incentives driving OEM electrification investment. Government incentive programs including the Inflation Reduction Act's US$ 7,500 federal EV tax credit, expanding to 15+ states offering additional state-level purchase incentives, create consumer purchase incentive alignment with manufacturer production capacity.
Europe Automotive Alternative Fuel Vehicle Market Analysis
Europe represents the largest regional market with approximately 38-40% market share, valued at approximately US$ 9.5-10 billion in 2026. Germany, United Kingdom, France, and Spain collectively represent 75% of the European market value, reflecting manufacturing concentration and vehicle ownership patterns across these developed economies. Europe's vehicle market exceeds 15 million annual units, with electric vehicle penetration reaching 15-20% in leading markets (Norway, Germany, France), substantially exceeding global averages.
EU regulations establishing 55% emissions reduction targets by 2030 (relative to 1990 baselines) create compliance pressures exceeding all other global regions. Individual country regulations, including France's gas/diesel vehicle sales prohibition timelines and Germany's technological neutrality framework, create heterogeneous regulatory environments requiring manufacturer flexibility.
Asia Pacific Market Analysis
Asia Pacific dominates global alternative fuel vehicle expansion dynamics, commanding approximately 50-55% market share with projections increasing to 60%+ by 2033. The region valued at approximately US$ 12-13 billion in 2026 is anticipated to reach US$ 20 billion by 2033, representing the fastest-growing regional market with an estimated CAGR of 7%. China, Japan, South Korea, and India collectively account for 90% of regional alternative fuel vehicle production and consumption, with China dominating at 7 million annual electric vehicle units.
The Chinese government dual-credit system penalizes ICE vehicle manufacturers while subsidizing NEV production, creating powerful economic incentives for manufacturer electrification. The Indian government's "PLI for Automobile" scheme offers manufacturing incentives for electric vehicles and battery production, targeting localized manufacturing supply chains. Japanese regulatory framework emphasizes technology neutrality, supporting fuel cell vehicle development alongside battery-electric pathways.
Automotive Alternative Fuel Vehicles Market Competitive Landscape
The global alternative fuel vehicle market demonstrates increasing consolidation with top 10 suppliers (OEMs and battery manufacturers) controlling approximately 70% of total market value. Leading tier-1 OEM suppliers, including Tesla, BYD, Volkswagen Group, General Motors, Ford Motor Company, BMW Group, and Daimler AG maintain established market positions through manufacturing scale, technology capabilities, and established dealer/distribution networks.
Market structure reflects competitive differentiation between technology leaders (Tesla, BYD, establishing software and battery integration dominance), traditional established OEMs leveraging brand equity and distribution infrastructure, and emerging Chinese manufacturers competing on cost and rapid product development cycles.
Key Industry Developments
- In June 2025, General Motors announced a USD 4 billion investment over 2 years in U.S. manufacturing plants to boost production of gas and electric vehicles, enabling assembly of over 2 million vehicles annually across key facilities, including Orion Assembly, Fairfax Assembly, and Spring Hill Manufacturing.
- In December 2024, the U.S. Department of Energy announced a USD 25 million investment in 11 next-generation battery manufacturing projects, including advancements in sodium-ion and flow batteries crucial for electric vehicle applications.
Companies Covered in Automotive Alternative Fuel Vehicles Market
- Tesla, Inc.
- Toyota Motor Corporation
- Nissan Motor Corporation
- General Motors
- Volkswagen Group
- Hyundai Motor Company
- Ford Motor Company
- Honda Motor Co., Ltd.
- BMW Group
- Daimler AG
- Others Key Players
Frequently Asked Questions
The Automotive Alternative Fuel Vehicles market is estimated to be valued at US$ 537.0 Bn in 2026.
The key demand driver for the Automotive Alternative Fuel Vehicles market is regulatory pressure combined with strong government incentive programs that accelerate the shift away from conventional internal combustion engines.
In 2026, the Asia Pacific region will dominate the market with an exceeding 35% revenue share in the global Automotive Alternative Fuel Vehicles market.
Among the Fuel Types, BEV holds the highest preference, capturing beyond 48% of the market revenue share in 2026, surpassing other fuel types.
The key players in Automotive Alternative Fuel Vehicles are Tesla, Inc., Toyota Motor Corporation, Nissan Motor Corporation, and General Motors.


