


- Electric Mobility
- Electric Vehicle Market
Electric Vehicle Market Size, Share, and Growth Forecast, 2026 - 2033
Electric Vehicle Market by Vehicle Type (Scooters, Motorcycles, Passenger Vehicle, Light Others), Propulsion Type (Battery Electric Vehicles (BEVs), Hybrid Electric Vehicle (HEVs), Others, by Range (Up to 150 Km, 151 to 300 Km, Others), and Regional Analysis for 2026 - 2033
Electric Vehicle Market Size and Trends Analysis
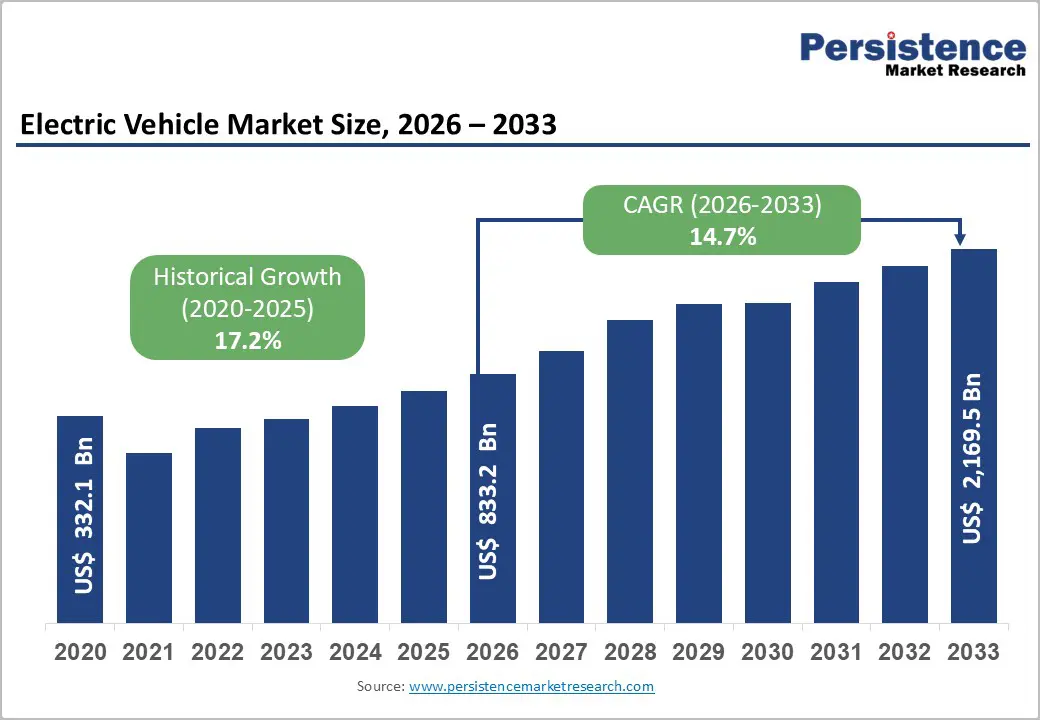
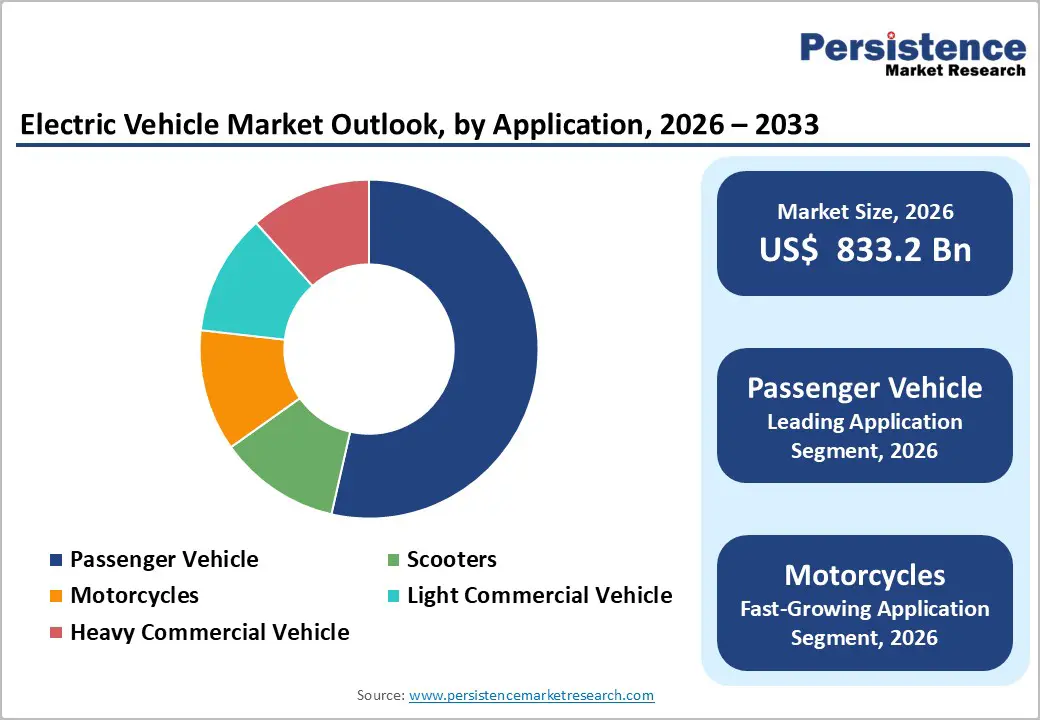
The global electric vehicle market is projected to reach US$ 833.2 billion in 2026 and US$ 2,169.5 billion in 2033, with a CAGR of 14.7% over the forecast period 2026 - 2033.
Global market growth is primarily driven by advances in battery technology, cost reductions, and robust tax incentives. While high upfront costs and limited charging infrastructure remain challenges, lower operating costs and vertical integration offer competitive advantages. Battery Electric Vehicles (BEVs) are leading the transition, with passenger cars dominating the market share. Asia-Pacific, led by China, accounts for over 58% of global EV sales, followed by a recovering European market with strong policy-driven BEV adoption.
Key Industry Highlights:
- Battery Electric Vehicles (BEVs) are set to account for 45% of the market by 2026, with Tesla and BYD leading this rapidly growing propulsion segment.
- BEVs lead the EV propulsion market with a projected 45% share in 2026 and a CAGR of 14.3% through the forecast period.
- EVs offer up to 50% lower maintenance and operating costs over their lifespan compared to Internal Combustion Engine (ICE) vehicles, making them more appealing for both private and fleet buyers.
- Passenger cars set to dominate by capturing over 66% market share in 2026, driven by private mobility trends and policy incentives. The segment is expected to grow at a CAGR of 13.9% through 2033.
- Fuel Cell Electric Vehicles (FCEVs) are gaining traction in long-haul and heavy-duty sectors, while Plug-in Hybrid Electric Vehicles (PHEVs) are serving as transitional technologies.
- Chinese EV manufacturers lead globally in integration and supply chain efficiency, outpacing international rivals by three to five years, and are engaged in aggressive price offering discounts.
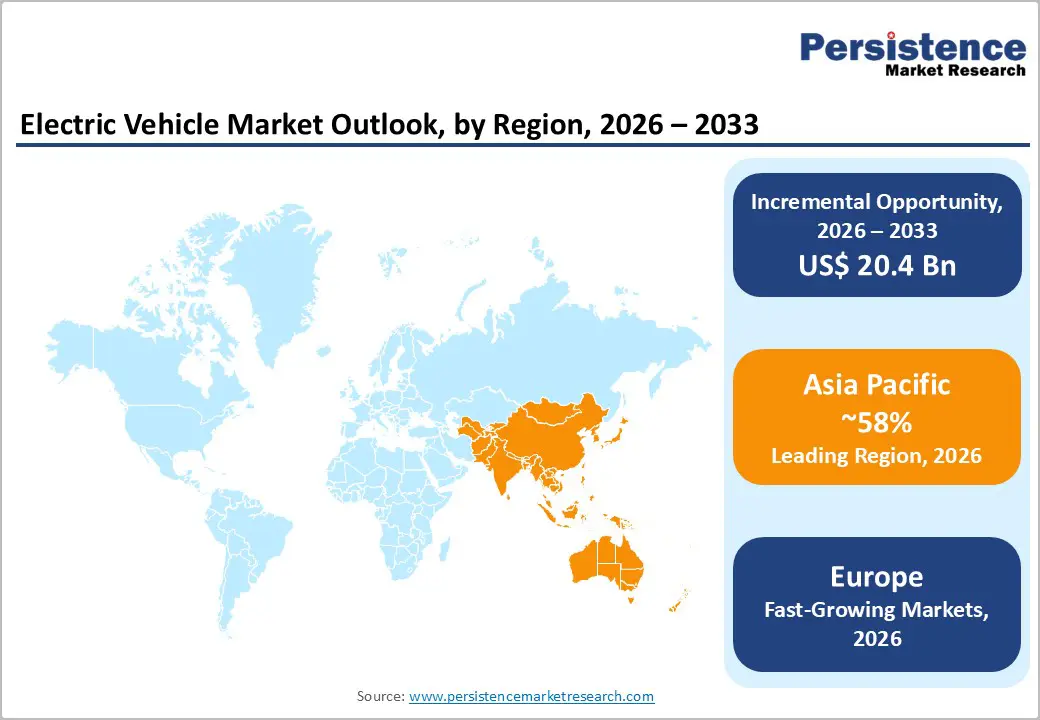
- Asia Pacific leads with 58% global market share in 2026, led by China’s 11+ million EV sales in 2024.
- India saw 50% growth in 2023, with over 1.5 million units sold and targeting 30% EV penetration by 2030.
| Key Insights | Details |
|---|---|
|
Electric Vehicle Market Size (2026E) |
US$ 833.2 Bn |
|
Market Value Forecast (2033F) |
US$ 2,169.5 Bn |
|
Projected Growth (CAGR 2026 to 2033) |
17.2% |
|
Historical Market Growth (CAGR 2020 to 2025) |
14.7% |
Market Dynamics
Drivers - Government Policies and Industry Realignment Accelerate the EV Market Expansion
The market is undergoing accelerated transformation, supported by favorable government policies, stringent environmental regulations, and evolving automotive strategies. Targeted fiscal measures such as purchase subsidies, tax exemptions, and direct consumer incentives have significantly lowered the upfront cost of electric light-duty vehicles (LDVs), stimulating mass-market adoption. Early implementations in countries including Norway, the U.S. and China set the foundation for widespread EV acceptance and scaled-up battery and vehicle production.
Simultaneously, over 85% of global vehicle sales are now subject to increasingly stringent fuel economy and CO2 emission standards. Regulatory leaders, including the EU, California, and China, have reinforced this shift with mandatory zero-emission vehicle (ZEV) targets, making EV deployment critical for compliance and long-term competitiveness.
Infrastructure development is also gaining momentum, with public investments, private sector collaboration, and regulations such as compulsory EV charging provisions in new buildings to eliminate deployment hurdles. Complementary urban mobility initiatives, such as low-emission zones and preferential access for EVs, are also propelling adoption in densely populated areas.
Restraint - Limited Charging Infrastructure Slows Market Penetration
Despite technological improvements, Electric Vehicle systems remain significantly more expensive than conventional combustion engines and increasingly competitive battery-electric alternatives. The manufacturing complexity of Electric Vehicle stacks, platinum catalyst requirements, and specialized component sourcing create persistent cost structures that limit price competitiveness in cost-sensitive market segments. Additionally, the immature supply chain and limited manufacturing scale compared to established automotive technologies result in higher production expenses. These economic barriers disproportionately impact developing economies and smaller enterprises, restricting market participation and slowing adoption rates in price-sensitive customer segments.
Opportunity - Vertical Integration as a Strategic Advantage for Market Share Growth
The rise of BYD presents a clear opportunity for EV manufacturers to gain significant market share through vertical integration. BYD’s success in delivering over 4.27 million new energy vehicles in 2024 and nearly 1 million units in Q1 2025 demonstrates how full control over the value chain can become a key competitive advantage. By managing everything from raw material procurement and battery production to in-house software development and vehicle assembly, BYD has significantly reduced production costs, minimized supply chain disruptions, and accelerated product development timelines.
For other manufacturers, replicating this model represents a major opportunity to improve cost efficiency, secure critical components, ensure quality control, and respond faster to market demand. As battery availability, affordability, and performance become decisive factors in EV adoption, vertical integration allows manufacturers to retain pricing power and drive innovation, making it a powerful strategy to capture a dominant share in an increasingly competitive market.
Category-wise Analysis
Propulsion Type Insights - Battery electric vehicles are becoming dominant, driving market growth as ICE relevance rapidly declines
BEVs are emerging as the dominant propulsion technology in the market, projected to command approximately 45% of the market share by 2026. With an expected CAGR of 14.3% through the forecast period, BEVs are rapidly outpacing other powertrain technologies. This growth is driven by key advantages such as zero tailpipe emissions, reduced maintenance and operating costs, and expanding government incentives for clean mobility solutions.
The ongoing decline of ICE vehicles reflects a clear industry pivot, with ICE models forecast to represent only a marginal share by 2032. In contrast, hybrid powertrains, particularly PHEVs and Mild Hybrid Electric Vehicles (MHEVs), continue to function as transitional solutions. As BEVs become more affordable and supported by increasingly robust charging infrastructure, the relevance of hybrids is expected to diminish over time.
FCEVs, while still in the early stages of adoption, are gaining traction in niche segments such as heavy-duty and long-haul transport, where hydrogen’s advantages in range and rapid refueling provide unique value.
Industry leaders are accelerating the shift. Tesla currently holds an 18% share of the global BEV market, while BYD has become the world’s top BEV and PHEV manufacturer following its exit from ICE-only vehicle production. In 2023, BYD sold over 3 million EVs, highlighting the scale and momentum behind the electrification wave.
Vehicle Type Insights - Electric Passenger Cars Dominate Market Growth, Driven by BEV Adoption and Global Electrification Trends
The passenger car segment is projected to lead the market in 2026, capturing a dominant share of over 66%, reflecting its central role in the global shift toward electrified private mobility. According to industry analysis, this segment is expected to maintain robust expansion, registering a CAGR of 13.9% through 2032.
The electric passenger car segment encompasses BEVs, PHEVs, and extended-range electric vehicles (EREVs). BEVs are witnessing the highest adoption, driven by advancements in battery technology, declining production costs, and expanding charging infrastructure. BEVs operate solely on electricity and are equipped with high-capacity lithium-ion batteries, offering zero tailpipe emissions and reduced operating costs compared to internal combustion engine vehicles.
China is projected to sell approximately 10 million electric passenger cars in 2024, representing around 45% of its total car sales. The U.S. is forecasted to reach nearly 11% EV penetration in new car sales, while Europe is expected to account for about 25% of total passenger car sales through EVs, despite facing regulatory and subsidy-related headwinds in select regions.
Rising raw material costs, supply chain disruptions, and regional disparities in charging infrastructure development pose significant hurdles. As government incentives phase out and competition intensifies, automakers must innovate continuously to maintain market momentum and consumer interest.
Regional Insights and Trends
Asia Pacific dominates the global EV market through policy support, manufacturing strength, and accelerating adoption
Asia Pacific is set to maintain its leadership in the global market, accounting for more than 58% of total market share in 2025, supported by robust manufacturing ecosystems, accelerating electric vehicle (EV) adoption, and favorable government policies. China remains the primary growth driver. In 2024, the country sold over 11 million EVs-surpassing global EV sales recorded in 2022. From July 2024 onward, monthly EV sales in China consistently exceeded internal combustion engine (ICE) vehicle sales, and by year-end, electric models represented nearly half of all new vehicle purchases. This transition is driven by narrowing cost gaps with ICE vehicles, evolving consumer preferences, and strong policy incentives. Notably, a government-backed vehicle trade-in program launched in April 2024 attracted 6.6 million applicants, with 60% choosing EVs, highlighting the effectiveness of targeted policy measures.
India is steadily strengthening its EV ecosystem, achieving nearly 50% year-on-year growth in EV sales in 2023 to exceed 1.5 million units. The market is gearing up for the introduction of premium EV models through 2025, underpinned by rapid progress in domestic battery manufacturing. A national target of 30% EV penetration by 2030 continues to shape investment decisions across both public and private sectors.
Japan and South Korea are emphasizing localization and technological advancement. Toyota has committed US$2 billion to establish a Lexus EV manufacturing facility in Shanghai and is collaborating with Huawei on new electric vehicle platforms. Nissan plans to introduce ten EV models in China by 2027, including a locally tailored electric pickup. Hyundai is also strengthening its China-focused EV strategy, launching the Elexio model and preparing an expanded portfolio of electric and hybrid vehicles by 2027.
Europe remains the second-largest electric vehicle market with sustained growth momentum
Europe continues to rank as the world’s second-largest EV market and is positioned for sustained expansion. From January to April 2025, more than 2.2 million electric vehicles-including BEVs, PHEVs, and HEVs-were registered across the EU as well as Norway, Switzerland, and Iceland, representing a solid 20% year-on-year increase. Battery electric vehicles recorded especially strong growth, with registrations rising by 26% over the same period.
In April 2025, BEVs and PHEVs together accounted for 26% of all new passenger car registrations. BEVs alone achieved a 17% market share, up from 13.4% in April 2024, while PHEVs increased to 9% from 6.9%. This expansion is being reinforced by the growing penetration of Chinese EV manufacturers across European markets. France and the U.K. each posted around 15% growth, with BEVs outperforming PHEVs in both countries.
In contrast, Germany recorded an almost 5% decline in EV sales following the withdrawal of purchase subsidies in 2023. Italy faced a sharper contraction of over 20% in the first quarter, driven largely by weaker PHEV demand, although upcoming model launches from brands such as Chery and renewed government incentives are expected to support recovery. Meanwhile, rising adoption of e-bikes—supported by subsidies of up to 50% on lower-powered models in several countries—is further strengthening Europe’s broader clean mobility transition.
Competitive Landscape
The global electric vehicle market is experiencing a profound transformation driven by aggressive pricing strategies, rapid technological innovation, and increasingly globalized expansion plans. Asia Pacific-anchored by China and supported by strong momentum in India and Southeast Asia-continues to emerge as the central growth engine for worldwide EV adoption.
In China, Tesla initiated an intense price war by offering discounts of up to CNY 15,000 (approximately US$ 2,092), compelling domestic competitors such as BYD, XPeng, and GM-SAIC-Wuling to respond with similar cuts. As a result, Chinese EV manufacturers have strengthened their competitive edge, outperforming many global peers in system integration, technological sophistication, and supply chain efficiency.
In the United States, Tesla’s market share declined from 60% in 2020 to 45% in 2023, signaling intensifying competition. The company’s future growth increasingly depends on the successful commercialization of autonomous driving technologies and robotics. At the same time, Hyundai-Kia has secured nearly 8% market share by capitalizing on Inflation Reduction Act incentives and expanding local manufacturing operations.
Europe’s EV market remains comparatively stable but highly fragmented, constrained by uneven national policies and the gradual withdrawal of subsidies. While plug-in hybrid vehicles provide near-term volume support, they lack long-term competitiveness relative to fully electric models. The market share of legacy automakers has fallen sharply-from around 80% in 2015 to 60% in 2023-as Tesla and Chinese brands gain traction. Consumer purchasing decisions are increasingly shaped by price sensitivity, limited charging infrastructure growth-particularly in rural regions-and evolving perceptions of brand values, sustainability, and corporate ethics.
Key Industry Developments:
- In December 2025, Maruti Suzuki introduced the India-spec e Vitara, marking the company’s first electric vehicle launch in the country. The model is offered with 49 kWh and 61 kWh battery options and delivers an ARAI-certified driving range of up to 543 km.
- On September 6, 2025, VinFast officially entered the Indian market with the launch of its highly anticipated premium electric SUVs, the sleek and intelligent VF 6 and the sporty, refined VF 7. As the company’s first offerings in India’s fast-growing electric vehicle market, the introduction highlights VinFast’s long-term commitment to supporting the country’s shift toward sustainable and environmentally responsible mobility, while firmly establishing the brand as an emerging contributor to India’s evolving EV landscape.
- In June 2025, Doosan Electric Vehicle signed an MOU with Seorabeol City Gas and GnC Energy at its Dongdaemun Doosan Tower to collaborate on 'Energy Business to Boost Regional Energy Welfare.' Under the MOU, Doosan Electric Vehicle will provide electric vehicle supply and long-term service agreement services, while Seorabeol City Gas will supply city gas within the region.
- In April 2025, EKPO unveiled the powerful electric vehicle technology, the NM20 stack module, for sustainable mobility and stationary applications. Delivering up to 400 kW, it is EKPO’s most powerful model yet and has been designed particularly with heavy-duty traffic and stationary applications in mind. The stack boasts a high level of efficiency, reduced hydrogen consumption, the capacity to work at higher temperatures, recyclability, and a long service life.
- In June 2025, according to the Industrial Cooperation & Research Planning team, Hanyang University ERICA, Researchers in South Korea have developed a powerful and affordable new material for producing hydrogen, a clean energy source key for the Electric Vehicles. By fine-tuning boron-doping and phosphorus levels in cobalt phosphide nanosheets, the process can generate scalable, low-cost hydrogen for electric vehicles.
- In May 2024, Japan-based Mitsubishi Electric Mobility and AISIN reached a basic agreement to establish a joint venture company for handling products for next-generation EVs. The joint venture will offer new and attractive products to a wide range of customers. It would help in maximizing the synergy of Mitsubishi Electric Mobility’s traction motors, power converters, and control optimization technologies, as well as boost AISIN’s integration technology.
Companies Covered in Electric Vehicle Market
- Volkswagen Group
- VinFast
- Toyota Motor Corporation
- Tata Motors
- TVS Motor Company
- Tesla
- Renault Group
- Ola Electric
- Mercedes-Benz Group
- Hyundai Motor Group
- Honda Motor Co.
- Hero Electric
- General Motors (GM)
- BYD
- BMW Group
- Other Market Players
Frequently Asked Questions
The Electric Vehicle market is estimated to be valued at US$ 833.2 Bn in 2026.
The primary demand driver for the electric vehicle (EV) market is the global push toward decarbonization of the transportation sector, driven by stringent emission regulations and long-term net-zero commitments by governments.
In 2026, the Asia Pacific is likely to dominate with an exceeding 58% revenue share in the global electric vehicle market.
Among vehicle types, passenger vehicle has the highest preference, capturing beyond 66% of the market revenue share in 2026, surpassing other vehicle types.
VinFast, Toyota Motor Corporation, Tata Motors, TVS Motor Company, Tesla, Renault Group, Ola Electric, Mercedes-Benz Group, Hyundai Motor Group, and Honda Motor Co. There are a few leading players in the Electric Vehicle market.


