


- Electric Mobility
- EV Charging Station Market
EV Charging Station Market Size, Share, and Growth Forecast for 2026 - 2033
EV Charging Station Market by Charger Type (Slow Charger and Fast Charger), Charging Infrastructure Type (CCS, CHAdeMO, Type 1, Type 2, Tesla SC (NACS) and GB/T Fast), Installation Type (Fixed and Portable), Level of Charging (Level 1, Level 2 and Level 3), Application (Commercial and Residential) and Regional Analysis for 2026 - 2033
EV Charging Station Market Size and Trends
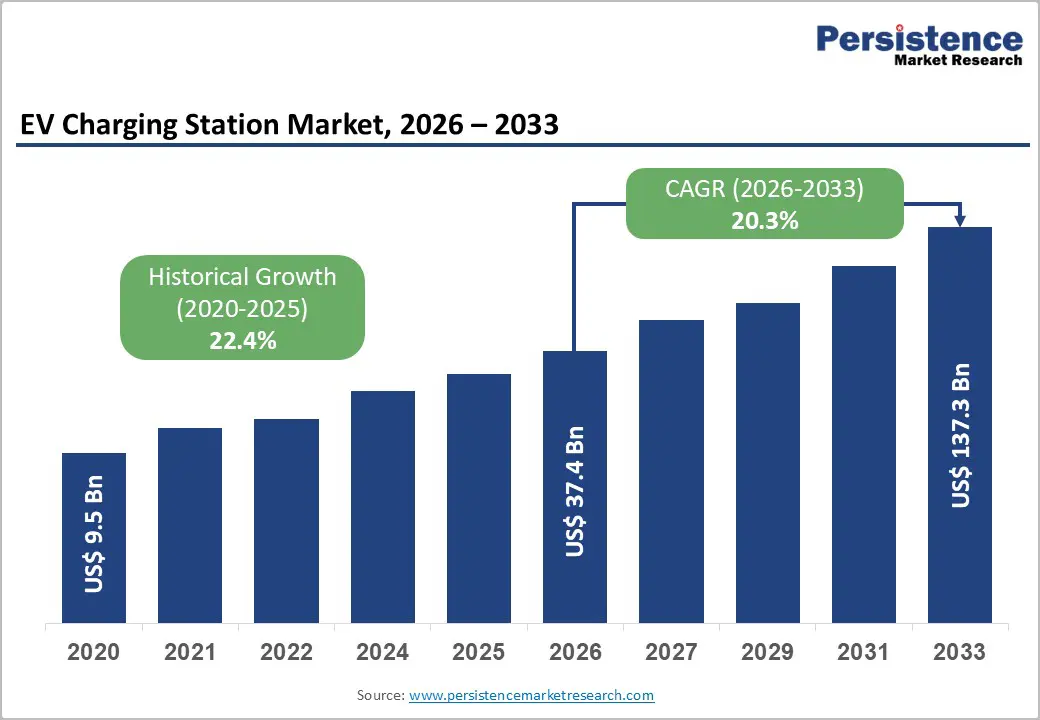
The global ev charging station market is set to grow with a whopping CAGR of 20.3% till 2033. The market size will grow from US$ 37.4 Bn in 2026 to US$ 137.3 Bn by 2033.
Growing environmental concerns and the rising adoption of electric vehicles (EVs) worldwide are key drivers of the EV Charging Station market. Government incentives, including tax exemptions and regulatory mandates that support zero-emission vehicles, are accelerating EV adoption and thereby increasing demand for robust and accessible charging solutions.
Key Highlights of the EV Charging Station Market
- Charger Type Segments: Fast chargers dominate the global EV Charging Station Market, accounting for 72.4% share in 2026, driven by the growing need for reduced charging times and long-distance EV travel support.
- Application Segments: Commercial charging stations lead the market in 2026, encompassing fleet, destination, highway, and bus charging stations. Their growth is fueled by large-scale EV adoption in public transport, logistics, and shared mobility services.
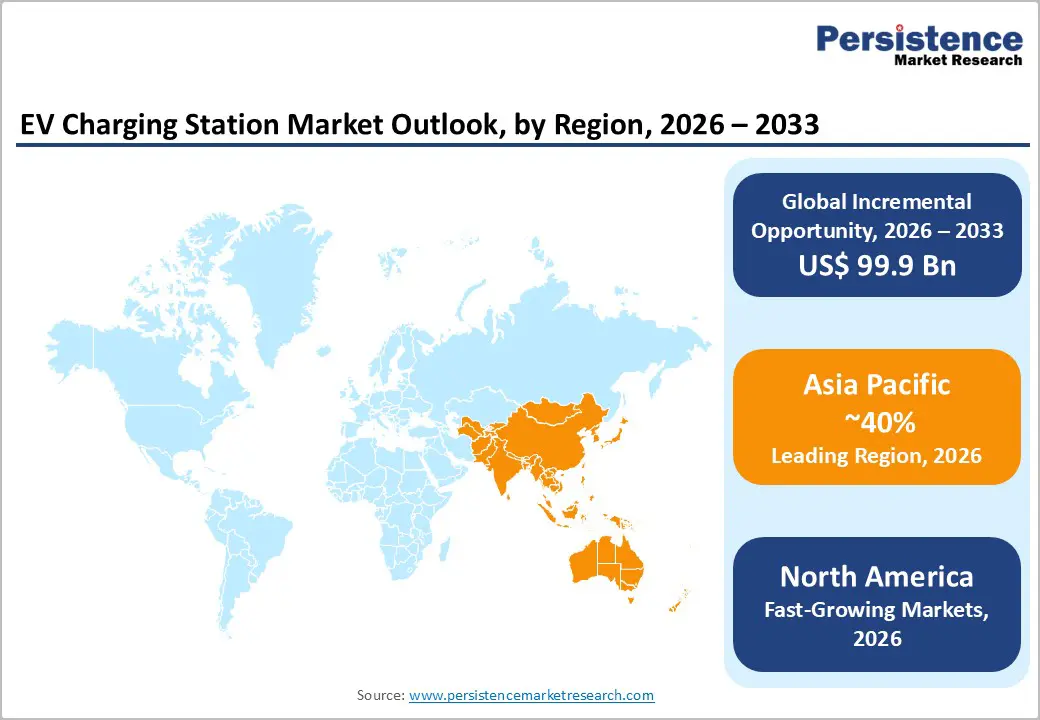
- Regional Leaders: Asia-Pacific dominates with around 40% market share in 2026, primarily driven by China’s large-scale EV production, strong policy incentives, and rapid infrastructure deployment. The region’s expanding automotive industry and technological advancements also support continued leadership, while Europe and North America are emerging as fast-growing markets due to government-backed electrification mandates and cross-border charging network initiatives.
- Market Outlook: The global EV Charging Station Market continues to expand rapidly as governments implement supportive regulations, subsidies, and infrastructure programs to accelerate EV adoption and achieve decarbonization targets. Rising demand for public and private charging accessibility is expected to sustain long-term market momentum.
- Strategic Market Developments: Industry players are increasingly investing in ultra-fast charging networks, vehicle-to-grid (V2G) capabilities, and digital payment integration. Collaborative ventures between automakers, utilities, and technology providers-such as large-scale partnerships in Asia and Europe-are reshaping the charging landscape, ensuring greater interoperability, faster deployment, and enhanced user convenience.
| Global Market Attributes | Key Insights |
|---|---|
| EV Charging Station Market Size (2026E) | US$ 37.4 Bn |
| Market Value Forecast (2033F) | US$ 137.3 Bn |
| Projected Growth (CAGR 2026 to 2033) | 20.3% |
| Historical Market Growth (CAGR 2020 to 2025) | 22.4% |
Market Dynamics
Drivers - Government policies and subsidies to support faster setup of EV charging stations
The growing global demand for electric vehicles (EVs) is significantly driving the expansion of EV Charging Station, with governments around the world actively funding its development and offering substantial subsidies. Favorable policy frameworks incentivize the installation of charging stations through reduced fees, tax benefits, and streamlined regulatory processes. Numerous countries have integrated large-scale charging infrastructure expansion into their broader EV adoption strategies, with both public and private investments playing a vital role.
In the United States, initiatives like the deployment plan for 500,000 new charging outlets by 2030 exemplify this momentum. Private sector innovations, including high-speed charging stations and emerging wireless charging systems, are also accelerating the infrastructure buildout. Addressing the growing infrastructure needs requires a coordinated approach involving supportive government policies, technological innovation, and public education campaigns.
Restraint - Challenges Due to Lack of Charging Infrastructure Standardization
The absence of standardized electric vehicle charging infrastructure remains a significant restraint to the growth of the global EV Charging Station market. As the market expands rapidly, inconsistencies in charging requirements and technologies across regions have become more pronounced. Different EV models and charging networks often require specific voltage levels and connector types, leading to interoperability challenges for consumers and service providers alike.
For example, AC charging stations typically provide 120V AC (Level 1) or 208/240V AC (Level 2), while DC fast charging stations offer rapid charging at 480V. However, the fast-charging standards vary significantly across countries. Japan predominantly uses CHAdeMO, Europe and South Korea employ CCS2, the U.S. uses CCS1, and China relies on the GB/T standard. This fragmentation complicates international travel for EV users and creates added costs for infrastructure developers who must install multi-standard chargers to accommodate diverse vehicle requirements.
Opportunity - Integration of V2G-Enabled Charging Stations to Support Grid Stability and Energy Management
The adoption of Vehicle-to-Grid (V2G) technology presents a significant opportunity in the EV Charging Station market. V2G-enabled charging stations allow bi-directional energy flow between electric vehicles and the power grid, supporting critical functions such as grid balancing during peak demand periods. This technology can reduce strain on the grid, minimize the need for costly infrastructure upgrades, and potentially lower energy costs for consumers through demand response incentives. Moreover, V2G enables electric vehicles to serve as mobile energy storage units, offering backup power during outages and emergencies enhancing energy security and resilience for residential and commercial users.
Several key manufacturers are already advancing V2G technology. Nuvve Corporation is a global pioneer in V2G services, offering platforms that aggregate EV batteries into virtual power plants. Similarly, Nissan has integrated V2G capabilities into its LEAF models, collaborating with energy providers across Europe and Japan. ABB and Siemens are also investing in V2G-compatible charging hardware, reinforcing the commercial viability of this emerging solution.
Category-wise Analysis
Application Insights
The commercial segment dominated the EV Charging Station market in 2026, driven by substantial government funding and private sector initiatives aimed at expanding public electric vehicle charging infrastructure (EVCI). This segment includes fleet charging stations, destination charging stations, bus charging stations, highway charging stations, and other publicly accessible charging points.
In support of this trend, public transport agencies are partnering with automakers and energy companies to install large-scale charging solutions. For example, in September 2022, bp pulse partnered with The Hertz Corporation to roll out a comprehensive EV charging network across North America. This initiative is aimed at supporting Hertz’s expanding electric vehicle rental fleet and providing charging access to its customers, reinforcing the commercial segment’s leading role in market growth.
Charger Type Insights
The fast charger segment is poised to capture the largest share of 75% in 2026 and likely to achieve a high CAGR during the forecast period. The increasing requirements for AC fast chargers drives the segment growth, supported by the rising adoption of EVs in North America and government investments in electric vehicle charging stations. These developments and active investments in the sector are expected to further drive the segment.
The slow/moderate charger has also contributed to the rising adoption of standard chargers, particularly due to government efforts to expand efficient and sustainable EV charging infrastructure. For instance, with the help of Okaya, the Indian government announced plans to deploy 1,020 multi-standard chargers across India by 2026. Similar initiatives in other regions are also expected to drive segment growth.
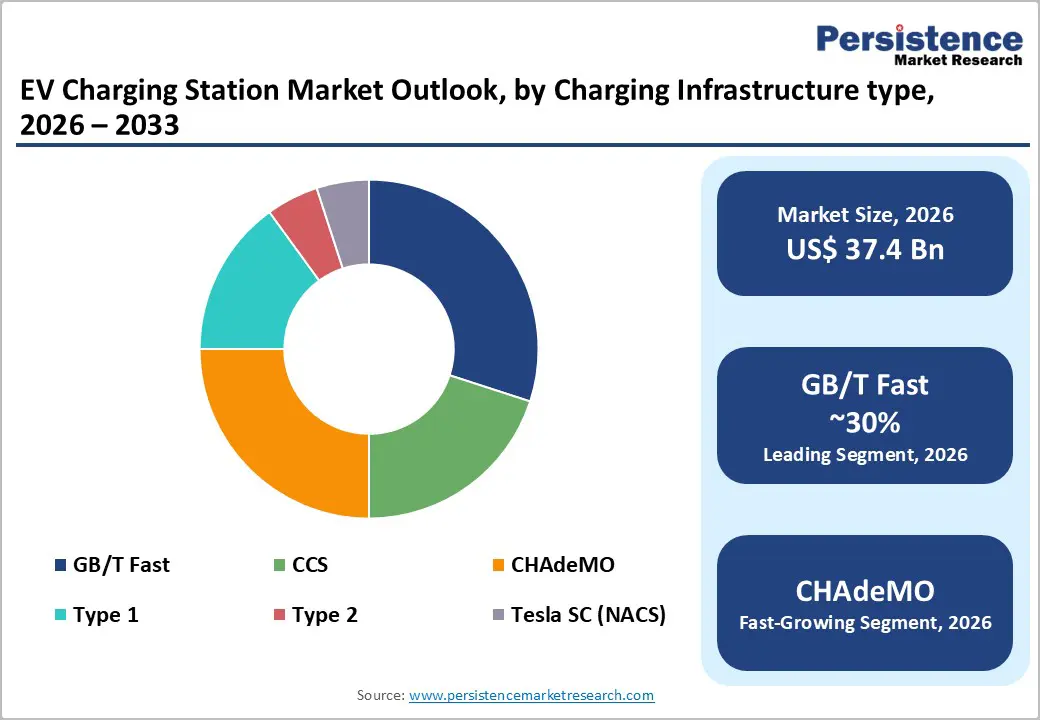
Charging Infrastructure Type Insights
GB/T connectors dominate the market with an expected 60% share in 2026, driven by their widespread use in China and compatibility with Guobiao National Standards. Supporting both AC and DC charging, the GB/T AC connector delivers up to 7.4 kW and resembles Europe’s Mennekes plug, though the two are not compatible due to differing cable configurations. The GB/T DC connector offers up to 237.5 kW of output, meeting the growing demand for fast charging in China’s expanding EV market.
Meanwhile, the CHAdeMO segment is projected to grow at the fastest pace during the forecast period, propelled by the increasing adoption of DC fast-charging technology. Originally developed by Japanese automakers, CHAdeMO continues to gain traction across Asia and select global markets emphasizing high-speed EV charging.
Level of Charging Insights
Level 2 charging emerged as the dominant segment in the EV Charging Station market in 2026, owing to its optimal balance between charging speed, cost, and ease of installation. Operating between 208 to 240 volts, Level 2 chargers are ideal for residential settings, workplaces, and public charging stations. Capable of adding 12 to 80 miles of range per hour depending on the EV model and the charger's power output, Level 2 charging is significantly faster up to 10 times than Level 1 charging.
Its widespread adoption is attributed to the convenience it offers urban EV users, where demand is highest. The relatively simple installation process, coupled with high compatibility across vehicle types, has made Level 2 chargers the most commonly deployed solution globally. As of 2022, this infrastructure has become a cornerstone of city-based EV adoption strategies.
Regional Insights and Trends
Asia-Pacific is expected to emerge as the fastest-growing region in the EV Charging Station market
Asia Pacific dominates and accounts for a 60.4% revenue share in 2026. Countries such as China, Japan, and South Korea, known as hubs of electric vehicles, are heavily investing in the development of charging infrastructure. Currently, China has one of the highest shares of fast chargers out of total public charging stock, at around 45%. In both the STEPS and APS, the stock of public fast chargers reaches around 7.5 million in 2035, almost six times 2023 levels. The number of slow chargers reaches 8.2 million in 2035 in the APS.
Japan's Green Growth Strategy aims to deploy 150 000 charging points by 2030, including 30 000 fast chargers, with the objective of reaching a comparable level of comfort as for refuelling conventional vehicles. In the APS, the number of LDV charging points reaches 160 000 by 2030, of which approximately 55 000 are fast chargers. By 2035, the number of public charging points reaches 190 000 in the APS. The number of electric LDVs per public charging point increases from around 18 in 2023 to over 80 in 2035 in the APS.
North America’s EV Charging Station Market Growth
North America’s electric vehicle (EV) charging infrastructure market is rapidly expanding, valued at approximately USD 4.17 billion in 2026 and projected to reach over USD 43 billion by 2033 driven by surging EV adoption and supportive government initiatives. The U.S. leads with significant investments, including a $1.5 billion allocation under the National Electric Vehicle Infrastructure (NEVI) Formula Program to develop charging stations along 75,000 miles of highways.
In the U.S, the government has announced nearly USD 50 million to subsidise projects that aim to expand access to convenient charging, in line with its objective of building a national network of 500 000 public EV charging ports by 2030. In the APS, the number of public chargers reaches 900 000 in 2030 and 1.7 million in 2035, many of which will likely be funded by private investment and go beyond highway corridors. This translates to about 55 electric LDVs per charging point in 2035.
Major Investments and Policy Push Drive Rapid EV Charger Deployment Across Europe
Europe is planning to achieve net zero emissions by 2050. Moreover, most companies are entering the market in the region. For instance, in March 2023, BP Pulse opened its most significant, most potent EV charging hub in the U.K., at Kettering, North Northamptonshire, built by The EV Network and operated by BP Pulse. Such investments are leading to the regional growth.
The United Kingdom expects to install at least 300 000 public chargers by 2030. In the APS, the roll-out of public chargers is slightly slower but maintains adequate coverage in terms of charging capacity available, with the stock reaching only 220 000 in 2030, with 1.2 kW of charging capacity per electric LDV available, and reaching 300 000 5 years later in 2035. Considering the stock of electric LDVs approaches 20 million in 2035 in the APS, this corresponds to over 60 electric LDVs per public charging point, up from around 30 in 2023.
Competitive Landscape
The global EV Charging Station market is highly competitive, with established industry leaders and emerging startups competing to capture market share through innovation, technological advancements, and strategic integration with AI, IoT, and smart grid solutions. Major players are heavily investing in research and development, focusing on improving charging speed, network reliability, energy management, and seamless user experiences to offer greater value to both individual consumers and fleet operators.
Leading companies are forming strategic partnerships with automakers, energy providers, and technology firms to accelerate deployment, expand geographic reach, and deliver end-to-end charging solutions. Integration with renewable energy sources and the development of smart, cloud-connected charging platforms are key trends shaping competitive strategies.
Key Industry Developments:
- In March 2026, Micronesia Mall highlighted its ongoing commitment to sustainability and forward-thinking solutions by collaborating with Triple J Technologies, Atkins Kroll BMW, Pacific Solar & Photovoltaics Inc., and EVAR to develop this EV charging station project.
- In March 2026, Trinity Cleantech acquired the German startup ME Energy, which specializes in off-grid fast-charging stations. ME Energy filed for insolvency last year and has now been fully acquired by Trinity Cleantech.
- In February 2023, ChargePoint Holdings, Inc. and Fisker, Inc. announced a strategic partnership aimed at enhancing the driving experience for Fisker Ocean owners. The collaboration focuses on providing Fisker drivers with seamless and convenient access to an extensive network of charging facilities, supporting broader EV adoption and user convenience.
Companies Covered in EV Charging Station Market
- ABB Ltd.
- ChargePoint, Inc.
- Leviton Manufacturing Co., Inc.
- Blink Charging Co.
- Tesla Inc.
- Webasto Group
- bp pulse
- Eaton Corporation plc
- Schneider Electric, Inc.
- Siemens
- BTC Power
- Delta Electronics, Inc.
- Tritium DCFC Limited
Frequently Asked Questions
The EV Charging Station market is estimated to be valued at US$ 37.4 Bn in 2026.
Rapid Growth in Electric Vehicle (EV) Adoption, and Corporate and Public-Private Partnerships are the major growth drivers.
In 2026, the Asia Pacific region will dominate the market with an exceeding 40% revenue share in the global EV Charging Station Industry.
Among the Charging Infrastructure Type, Passenger Service Equipment holds the highest preference, capturing beyond 32.7% of the market revenue share in 2026, surpassing other parts.
The global EV Charging Station market is dominated by major players such as ABB Ltd., ChargePoint, Inc., Leviton Manufacturing Co., Inc., Blink Charging Co., and Tesla Inc.


