


- Semiconductor Materials & Components
- RF Tunable Filter Market
RF Tunable Filter Market Size, Share, and Growth Forecast 2026 - 2033
RF Tunable Filter Market by Filter Type (Band Pass Filter, Band Reject / Notch Filter, Low Pass Filter, High Pass Filter), Frequency (Below 1 GHz, 1 GHz - 3 GHz, 3 GHz - 6 GHz, 6 GHz - 18 GHz, 18 GHz - 40 GHz, Above 40 GHz), Technology (SAW, BAW, MEMS, Varactor Diode, Ferroelectric, Others), Vertical and Regional Analysis, 2026 - 2033
RF Tunable Filter Market Size and Trend Analysis
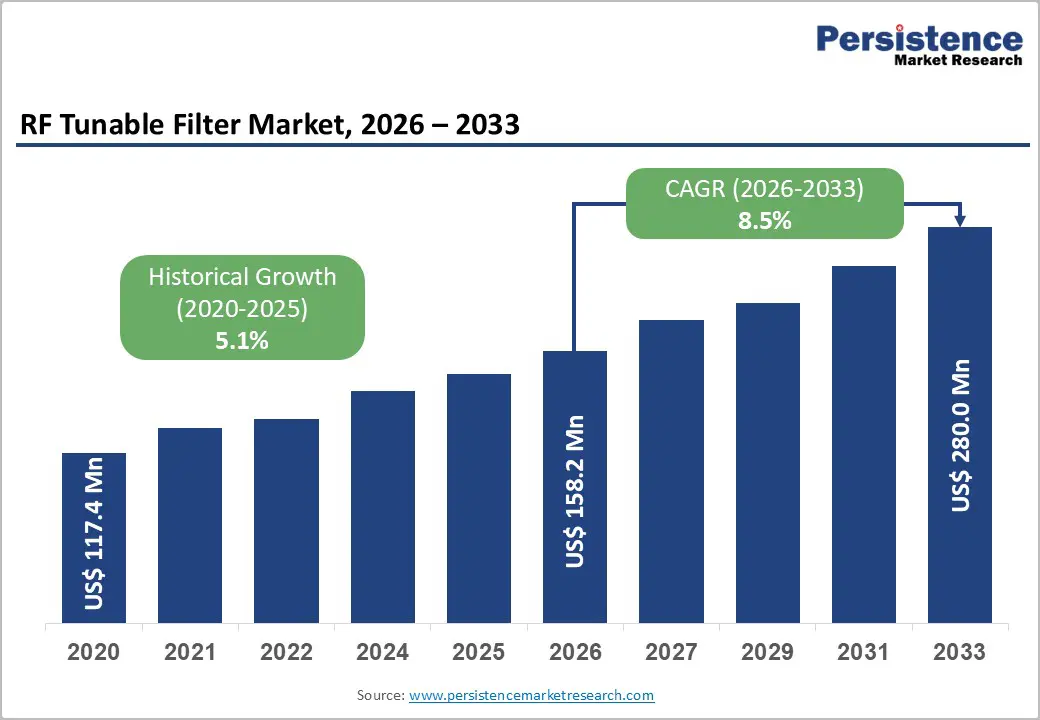
The global RF tunable filter market is expected to be valued at US$ 158.2 Million in 2026 and is projected to reach US$ 280.0 Million by 2033, growing at a CAGR of 8.5% between 2026 and 2033.
The rapid expansion of 5G carrier aggregation and increasingly congested RF environments is creating a critical need for dynamically adjustable filtering solutions capable of minimizing interference, improving spectral efficiency, and supporting multi-band connectivity in both base stations and smartphones. This trend is reinforced by 3GPP Release 17 and Release 18 specifications mandating support for aggregation across up to 8 component carriers, while the U.S. FCC’s C-Band Auction 107 and subsequent network investments by AT&T, Verizon, and T-Mobile are accelerating deployment of upgraded RF front-end architectures.
Key Industry Highlights:
- Leading Filter Type: Band Pass Filter dominates the global RF tunable filter market with over 52% share in 2026, reaching more than US$ 82.26 Million, driven by rising demand for selective signal transmission, carrier aggregation, and dynamic spectrum management across 5G, IoT, and defense communication systems.
- Leading Frequency Range: 3 GHz - 6 GHz leads the market with 30.0% share in 2026, equivalent to US$ 47.46 Million, supported by strong deployment of mid-band 5G, private wireless networks, Wi-Fi 6/6E, and industrial IoT connectivity.
- Fast-Growing Frequency Range: Above 40 GHz is the fastest-growing frequency segment, driven by accelerating mmWave 5G infrastructure and expanding LEO satellite constellation deployments requiring ultra-high-capacity RF communication.
- Leading Technology: SAW (Surface Acoustic Wave) technology commands approximately 35.0% market share in 2026, valued at over US$ 55.37 Million, due to its compact form factor, low insertion loss, and cost-efficient integration across smartphones, wearables, Wi-Fi modules, and IoT devices.
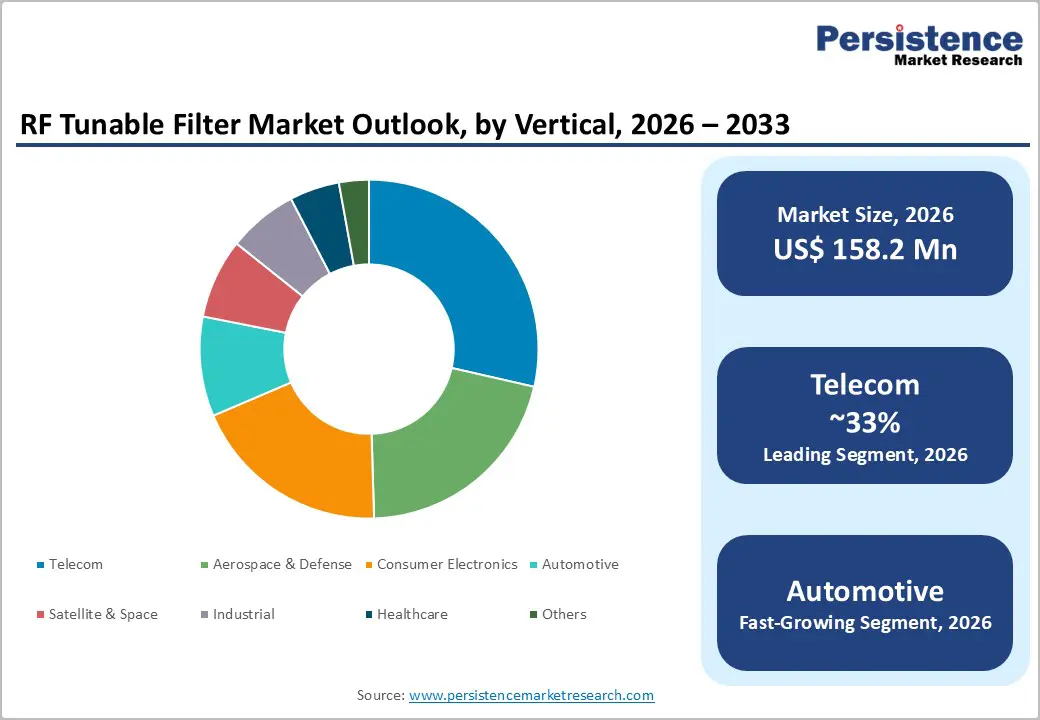
- Leading Vertical: Telecom accounts for more than 33.0% of the global RF tunable filter market in 2026, surpassing US$ 52.21 Million, driven by expanding 5G infrastructure, Open RAN deployments, and growing pressure on spectrum efficiency and interference management.
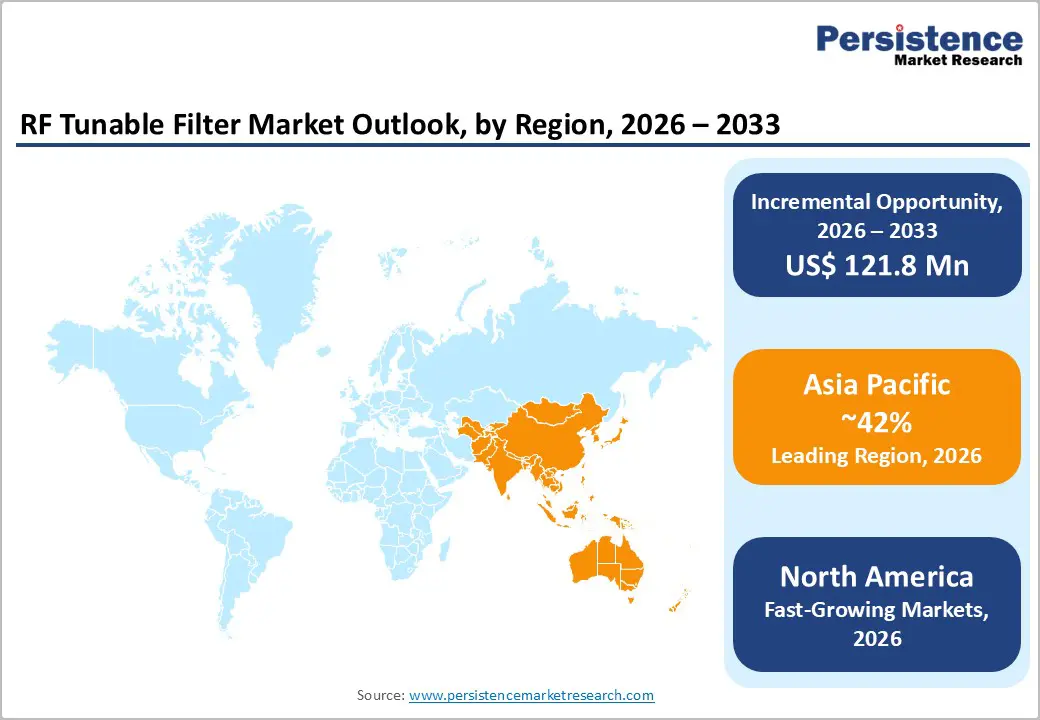
- Leading Region: Asia Pacific leads the global RF tunable filter market with over 42.0% share in 2026, representing US$ 66.44 Million, supported by rapid 5G densification, semiconductor manufacturing strength, and large-scale telecom infrastructure expansion across China, South Korea, Japan, and India. Asia Pacific is also the fastest-growing region with a CAGR of 12.7%, fueled by aggressive 5G rollout, V2X adoption, and government-backed electronics localization initiatives.
Market Dynamics
Drivers - Accelerating 5G Infrastructure Deployment Mandating Multi-Band RF Front-End Reconfigurability
Mobile network operators globally are deploying 5G standalone (SA) architecture across sub-6 GHz and millimetre-wave bands concurrently, making fixed-filter topologies commercially unviable for infrastructure vendors targeting multiple band plans in a single hardware platform. The European Union's European Electronic Communications Code (EECC) Directive 2018/1972, which set binding 5G coverage obligations enforced by national regulators, including Bundesnetzagentur in Germany, has driven tower companies such as Ericsson and Nokia to redesign their Massive MIMO radio units with software-configurable RF chains incorporating tunable bandpass and band-reject filters. As Open RAN disaggregation championed by the O-RAN Alliance pushes RF unit commoditization, tunable filter suppliers capable of delivering low-insertion-loss solutions across n77, n78, and n79 bands will capture disproportionate design-win volume from Tier-1 radio unit manufacturers.
Rising Defense Investments in Software-Defined Radio and Adaptive RF Communication Systems
Expanding aerospace and defense procurement of software-defined radio (SDR) platforms is accelerating the adoption of electronically tunable RF filtering technologies capable of suppressing interference across congested electromagnetic environments. Defense modernization initiatives such as the U.S. Department of Defense’s Joint All-Domain Command and Control (JADC2) program are driving investments in wideband, multi-frequency communication systems by contractors, including L3Harris Technologies and General Dynamics Mission Systems. These SDR platforms increasingly integrate MEMS-based and reconfigurable tunable filters to improve spectral agility, interoperability, and anti-jamming performance. This is expanding procurement opportunities for specialist RF tunable filter manufacturers beyond traditional U.S. defense markets.
Restraints - High Fabrication Complexity and Cost Premium of Advanced Tunable Filter Technologies
MEMS and ferroelectric tunable filters carry fabrication cost premiums of approximately 3-5× versus fixed-frequency SAW equivalents at comparable volume tiers, driven by specialised cleanroom processes, lower production yields, and hermetic packaging requirements that add per-unit overhead before any design margin is applied. The BIS export control rules under the Export Administration Regulations (EAR), tightened in October 2023 to cover advanced RF semiconductor manufacturing equipment, have increased compliance and supply-chain qualification costs for manufacturers sourcing substrate materials internationally, compressing gross margins by an estimated 200-350 basis points for mid-tier suppliers. New entrants lacking established foundry relationships face qualification lead times exceeding 18 months for military-grade components, effectively ceding near-term design wins to incumbents with validated supply chains.
Supply Chain Concentration Risk for Specialty Substrate Materials
The RF tunable filter supply chain depends heavily on lithium niobate (LiNbO3) and lithium tantalate (LiTaO3) wafers used in surface acoustic wave (SAW) filter manufacturing, with global substrate production concentrated among a limited number of Japanese and Chinese suppliers. This geographic concentration creates procurement vulnerability when geopolitical tensions or export controls disrupt semiconductor material supply chains. Japan’s Ministry of Economy, Trade and Industry (METI) introduced export restrictions on selected semiconductor manufacturing equipment in 2023, contributing to longer procurement lead times across portions of the RF component ecosystem.
Incumbent filter manufacturers with vertically integrated substrate sourcing and long-term supplier relationships, such as Murata Manufacturing, maintain structural advantages in supply continuity and cost stability compared with fabless RF design firms dependent on third-party wafer procurement.
Opportunities - LEO Satellite Constellation Buildout: Creating a New High-Volume Procurement Category
LEO satellite constellation deployment is creating a high-volume procurement opportunity for RF tunable filter suppliers capable of supporting above-18 GHz operation in compact, power-efficient architectures optimized for phased-array user terminals and gateway infrastructure. Vendors with proven Ka-band and emerging V-band tunable filter technologies, particularly those enabling monolithic integration with GaN or GaAs MMIC platforms, are well-positioned to benefit as electronically steerable antenna adoption accelerates.
Suppliers offering high reliability, low insertion loss, thermal stability, and aerospace-grade qualification standards for space and ground infrastructure applications are expected to gain a competitive advantage.
Vehicle-to-Everything (V2X) Communication Adoption: Unlocking Automotive RF Filter Demand
Vehicle-to-Everything (V2X) communication adoption is creating a structurally new buyer class for tunable RF filters, as coexistence between C-V2X, DSRC, Wi-Fi, GNSS, and cellular systems in the 5.9 GHz spectrum introduces interference and regional spectrum compatibility challenges that increasingly favor reconfigurable filtering architectures over fixed designs.
RF filter suppliers capable of achieving AEC-Q200 qualification and maintaining stable performance across -40°C to +125°C automotive operating conditions are positioned to secure recurring content-per-vehicle revenue opportunities as connected vehicle production scales alongside evolving European and global automotive safety and connectivity requirements.
Category-wise Analysis
Filter Type Insights
Band Pass Filter holds over 52% of the global RF tunable filter market in 2026, reaching more than US$ 82.26 Million, due to the critical need for selective signal transmission in increasingly congested wireless environments. The proliferation of carrier aggregation and multi-standard radios has intensified the requirement for dynamically tunable band-pass filters that can adapt to varying spectrum allocations across regions.
Their ability to improve spectral efficiency, reduce adjacent-channel interference, and support compact RF front-end integration makes them indispensable in smartphones, base stations, IoT modules, and defense communication systems. The demand is further reinforced by the industry’s push toward smaller, power-efficient wireless devices with higher data throughput requirements.
Band Reject / Notch Filter is the fastest growing filter type, accelerating as wireless device designers confront interference mitigation challenges that bandpass topologies alone cannot resolve. The rapid densification of wireless networks and the coexistence of Wi-Fi, 5G, satellite, radar, and industrial communication systems are creating urgent requirements for targeted interference suppression without degrading overall signal performance. Their ability to dynamically eliminate narrowband interference while preserving surrounding frequencies makes them essential for next-generation high-capacity wireless networks.
Frequency Insights
3 GHz - 6 GHz frequency segment leads the global market with 30.0% share in 2026, equivalent to US$ 47.46 Million, anchored by the urgent industry need for high-capacity mid-band spectrum capable of balancing coverage and data throughput. Telecom operators require tunable RF filters in this spectrum to support dynamic spectrum sharing, carrier aggregation, and interference management across increasingly dense mobile networks. The expansion of private 5G networks, fixed wireless access, Wi-Fi 6/6E systems, and industrial IoT connectivity further strengthens demand within this frequency range.
The Above 40 GHz segment is the fast-growing frequency, catalyzed by the increasing need for ultra-high-capacity wireless connectivity in mmWave 5G and satellite communication systems. Fixed wireless access providers are deploying mmWave infrastructure to deliver fiber-like broadband speeds in densely populated urban areas where traditional wired expansion is costly or slow. The rapid scaling of LEO satellite constellations is creating strong demand for tunable filters capable of supporting high-frequency beam steering and interference management in compact ground terminals. Applications require highly adaptive filtering technologies capable of operating with low latency, minimal signal loss, and exceptional frequency selectivity at extremely high frequencies.
Technology Insights
SAW (Surface Acoustic Wave) technology commands approximately 35.0% market share in 2026, reaching over US$ 55.37 Million, due to the industry’s need for compact, cost-efficient, and high-volume RF filtering solutions for consumer electronics and mobile communications. It offers low insertion loss, stable performance, and small form factors, making them highly suitable for smartphones, wearable devices, Wi-Fi modules, and IoT hardware. SAW filters are widely preferred where moderate frequency operation and cost optimization are more critical than extremely high-frequency performance.
MEMS (Micro-Electromechanical Systems) is the fastest growing technology, propelled by the growing need for highly reconfigurable RF front-end architectures in next-generation wireless systems. MEMS-based tunable filters provide wide tuning ranges, ultra-low power consumption, and superior linearity, making them highly attractive for software-defined radios, defense electronics, satellite communication, and multi-band 5G devices. As wireless systems become more spectrum-agile, manufacturers increasingly require filters capable of dynamically adapting to multiple frequency bands without increasing hardware complexity.
Vertical Insights
Telecom holds more than 33.0% of the global RF tunable filter market in 2026, surpassing US$ 52.21 Million value, due to the need for efficient spectrum utilization and interference management across rapidly expanding wireless networks. The explosive growth in mobile data traffic, video streaming, cloud applications, and connected devices is intensifying pressure on network performance and spectral efficiency. The transition toward Open RAN and software-defined network architectures is increasing demand for adaptive RF components capable of supporting flexible and reconfigurable network deployments.
Automotive is the fast-growing vertical, driven by the need for reliable wireless connectivity and advanced sensing systems in modern vehicles. Automakers are increasingly integrating V2X communication, 5G telematics, ADAS, GNSS, Wi-Fi, Bluetooth, and automotive radar into both premium and mass-market vehicles, creating highly congested in-vehicle RF environments.
Tunable RF filters are becoming essential for maintaining signal integrity and preventing interference among multiple coexisting wireless systems operating simultaneously within vehicles. The rise of electric and software-defined vehicles is increasing demand for compact, energy-efficient, and highly adaptive RF solutions capable of supporting continuous over-the-air connectivity and real-time data exchange.
Regional Insights
North America RF Tunable Filter Market Trends and Insights
North America accounts for 29.0% of the global RF tunable filter market in 2026 driven by the region’s need for secure, high-performance spectrum management across defense, telecom, and satellite communication networks. The CHIPS and Science Act for domestic semiconductor manufacturing and R&D, is accelerating localized RF component production to reduce dependency on Asian supply chains and improve procurement security. This domestic manufacturing push is particularly important for defense contractors operating under DFARS sourcing requirements, where trusted and regionally secure supply chains are becoming a strategic necessity.
The United States RF tunable filter market holds over 84% of the North America regional market in 2026, surpassing US$ 38.54 Million, supported by the country’s need for advanced defense communication systems, expanding 5G coverage, and satellite connectivity infrastructure. The demand is being reinforced by military software-defined radio deployments, C-Band network expansion, and the growing number of satellite ground terminals supporting broadband and defense applications. The NTIA Spectrum Relocation Fund is enabling the clearance and reallocation of mid-band spectrum through 2027, creating additional network upgrade cycles that require flexible RF filtering solutions.
Europe RF Tunable Filter Market Trends and Insights
Europe is expected to account for over US$ 25.31 Million value, due to the region’s accelerated 5G infrastructure deployment, spectrum-efficiency requirements, and defense electronics modernization initiatives. The EU’s 5G Action Plan and the European Defence Fund (EDF) are creating a dual-need environment where both commercial telecom operators and sovereign defense programs require adaptive RF front-end architectures capable of operating across increasingly congested frequency bands.
Germany accounts more than 24.0% of the Europe RF tunable filter market in 2026, equivalent to US$ 6.07 Million, driven by the country’s large-scale industrial automation ecosystem, expanding 5G standalone infrastructure, and connected mobility requirements. Germany’s automotive manufacturing sector led by BMW Group, Mercedes-Benz, and Volkswagen AG is accelerating C-V2X and autonomous mobility deployments, creating additional need for high-performance RF filtering solutions.
The United Kingdom is expected to surpass the US$ 4.81 Million value by 2026, while France accounts for more than 16.0% share of the regional market, due to telecom modernization and sovereign electronics capability expansion. In the UK, Ofcom’s Shared Rural Network (SRN) programme and the National Semiconductor Strategy are increasing demand for compact, multi-band tunable filters suitable for rural small-cell deployment and domestic GaAs/GaN semiconductor integration. In France, demand is being driven by France 2030 semiconductor investments, Orange S.A.’s 5G rollout, and recurring aerospace and defense procurement, where tunable filters are required for radar systems, satellite payloads, and secure aerospace communication platforms.
Asia Pacific RF Tunable Filter Market Trends and Insights
Asia Pacific accounts for over 42.0% of the global RF tunable filter market in 2026, representing US$ 66.44 Million, and is the fastest-growing region at a CAGR of 12.7%, driven by the need for high-performance RF front-end components amid rapid 5G densification across China, South Korea, and India.
China's RF tunable filter market is expected to surpass the value of US$ 29.9 million, and is witnessing strong demand due to over 4.8 million deployed 5G base stations and expanding V2X integration by automotive manufacturers. Japan represents 20.0% of the Asia Pacific RF tunable filter market in 2026, supported by the country’s need for advanced acoustic and tunable filter technologies for Local 5G enterprise deployments and automotive communication systems.
India is expected to achieve the highest rate, fueled by aggressive telecom infrastructure expansion following the commercial 5G rollout by Reliance Jio and Airtel. Government-led initiatives such as the Production Linked Incentive (PLI) Scheme for Telecom and Networking Products are encouraging domestic electronics manufacturing and localization of RF component sourcing. South Korea RF Tunable Filter Market is expected to reach over US$ 9.30 Million, driven by strong semiconductor and 5G innovation capabilities led by Samsung Electronics and SK Hynix.
The country’s KRW 4 trillion investment in 6G R&D and the growing adoption of C-V2X telematics modules in automotive exports are further increasing the need for advanced tunable RF filter architectures.
Competitive Landscape
The global RF tunable filter market operates as a moderately consolidated market, with top players collectively holding an estimated 45-50% of revenue share, competing primarily on insertion-loss performance, tuning speed, and validated design-win depth with Tier-1 OEMs. Companies are investing in proprietary substrate processing and packaging to insulate margins from commodity wafer market volatility, while also accelerating time-to-qualification for defense customers. Vendors are increasingly focusing on multi-band and miniaturized tunable filter architectures to support compact 5G smartphones, satellite communication systems, and next-generation defense electronics.
Key Developments:
- In June 2025, Otava RF launched the OTFL1001, an X-Band digitally tunable bandpass filter designed for advanced RF systems, including defense, satellite communications, radar, and software-defined radios. The product operates across 8-11.5 GHz and features fast switching, high linearity, and compact architecture, enabling improved frequency agility and front-end protection in next-generation RF applications.
- In June 2025, Qorvo introduced the QPQ3550 compact BAW filter and the QPA9862 high-efficiency pre-driver amplifier to simplify 5G infrastructure deployment and reduce radio footprint. The new RF solutions are designed for 5G massive MIMO (mMIMO) and fixed wireless access (FWA) applications, offering improved thermal performance, tighter integration, and enhanced power efficiency for next-generation wireless networks.
RF Tunable Filter Market - Key Insights & Details
| Key Insights | Details |
|---|---|
| Historical Market Value (2020) | US$ 117.4 Million |
| Current Market Value (2026) | US$ 158.2 Million |
| Projected Market Value (2033) | US$ 280.0 Million |
| CAGR (2026 - 2033) | 8.5% |
| Leading Region | Asia Pacific, 42% Share |
| Dominant Filter Type | Band Pass Filter, 52% Share |
| Top-ranking Technology | SAW, 35.0% Share |
| Incremental Opportunity (2026 - 2033) | US$ 121.8 Million |
Companies Covered in RF Tunable Filter Market
- Murata Manufacturing Co., Ltd.
- Broadcom Inc.
- Qorvo, Inc.
- Skyworks Solutions, Inc.
- TDK Corporation
- Taiyo Yuden Co., Ltd.
- Kyocera Corporation
- Tai-Saw Technology Co., Ltd.
- Akoustis Technologies, Inc.
- WISOL Co., Ltd.
- Smiths Interconnect
- MACOM Technology Solutions Holdings, Inc.
- API Technologies Corp.
- Reactel, Inc.
- Others
Frequently Asked Questions
The global RF tunable filter market is valued at US$ 158.2 Million in 2026 and is forecast to reach US$ 280.0 Million by 2033, growing at a CAGR of 8.5%. due to the global 5G NR infrastructure rollout, which requires electronically reconfigurable multi-band RF front-end architectures.
The O-RAN Alliance's Open RAN disaggregation framework compelling radio unit vendors to embed software-configurable RF chains, and the U.S. National Defense Authorization Act (NDAA) FY2023's JADC2 mandate accelerating SDR platform procurement across the U.S. armed forces.
Band Pass Filters hold the largest share over 52.0% in 2026, anchored by 5G Massive MIMO radio architectures that embed multiple tunable bandpass stages per radio unit to isolate carrier frequencies within densely aggregated mid-band spectrum.
Asia Pacific dominates the global RF tunable filter market with more than 42.0% share in 2026, driven by China's position as the world's largest 5G base station operator with over 4.8 million active 5G sites and by Japan and South Korea's leadership in acoustic filter manufacturing and semiconductor component exports.
The rapid deployment of 5G/6G networks, software-defined radios, and defense radar platforms that require dynamic spectrum management and real-time interference mitigation. Growth in IoT ecosystems, autonomous vehicles, and non-terrestrial networks (NTN) is further increasing demand for compact, low-loss, and frequency-agile RF filtering solutions.
Murata Manufacturing Co., Ltd., Broadcom Inc, Qorvo, Inc., Skyworks Solutions, Inc., TDK Corporation, Taiyo Yuden Co., Ltd., Kyocera Corporation are among the leading key players.


