


- Semiconductor Materials & Components
- RF Power Amplifier Market
RF Power Amplifier Market Size, Share, and Growth Forecast, 2026 - 2033
RF Power Amplifier Market by Product Type (Wideband / Broadband RF Power Amplifiers, Low Noise Amplifiers (LNA), Variable Gain Amplifiers (VGA), Gain Block Amplifiers, High Linearity RF Power Amplifiers, Others), Frequency Band (Low Frequency (<1 GHz), Mid Frequency (1-6 GHz), High Microwave (6-30 GHz), Millimeter Wave (>30 GHz)), Power Output, End-user, and Regional Analysis for 2026 - 2033
RF Power Amplifier Market Size and Trends Analysis
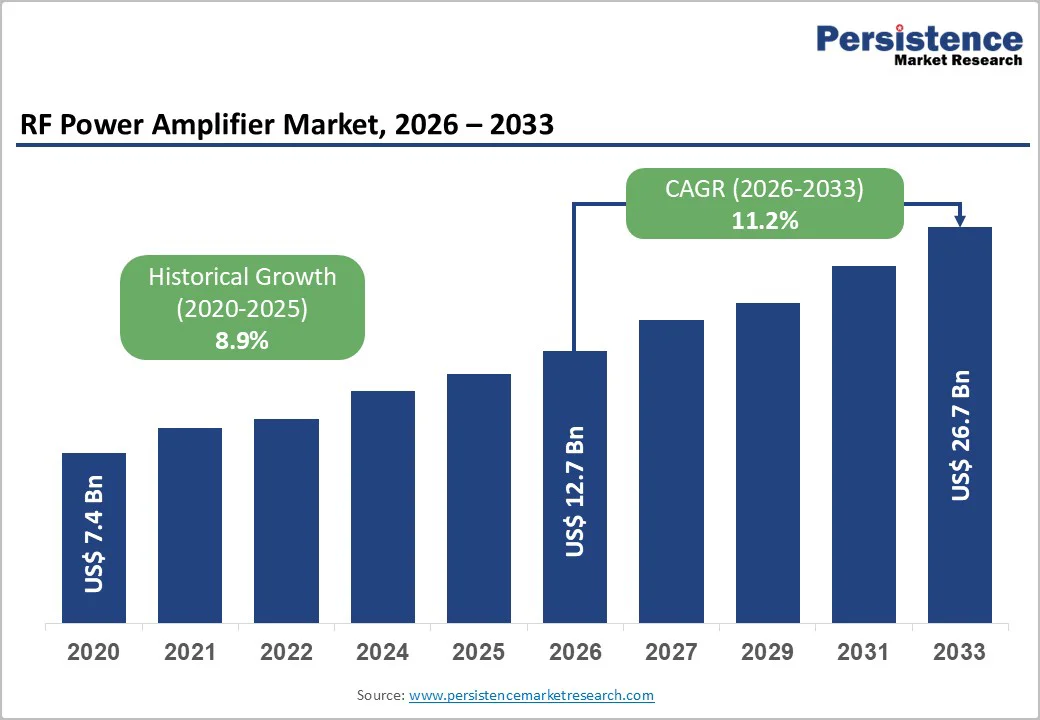
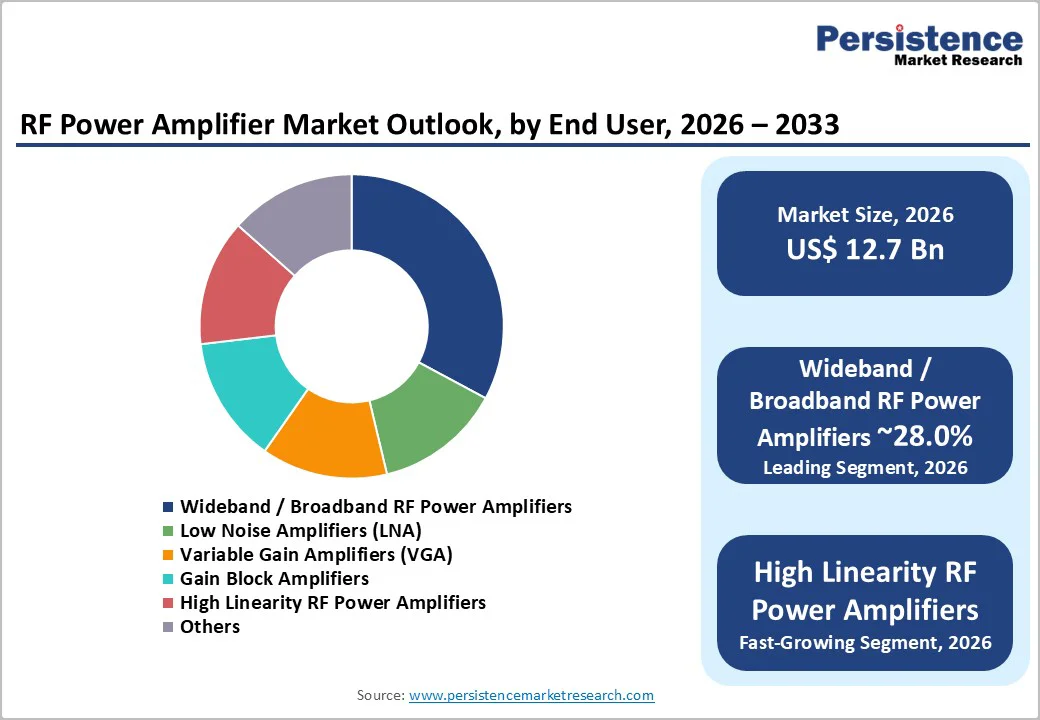
The global RF power amplifier market size is likely to be valued at US$12.7 billion in 2026 and is projected to reach US$26.7 billion by 2033, growing at a CAGR of 11.2% between 2026 and 2033.
This robust expansion reflects structural demand catalysts rooted in defence modernisation, telecommunications infrastructure deployment, and the transition toward advanced satellite communications systems. The market is characterised by technological convergence between broadband and high-frequency applications, supported by substantial government investment in 5G infrastructure and advanced aerospace-defence platforms.
Key Industry Highlights:
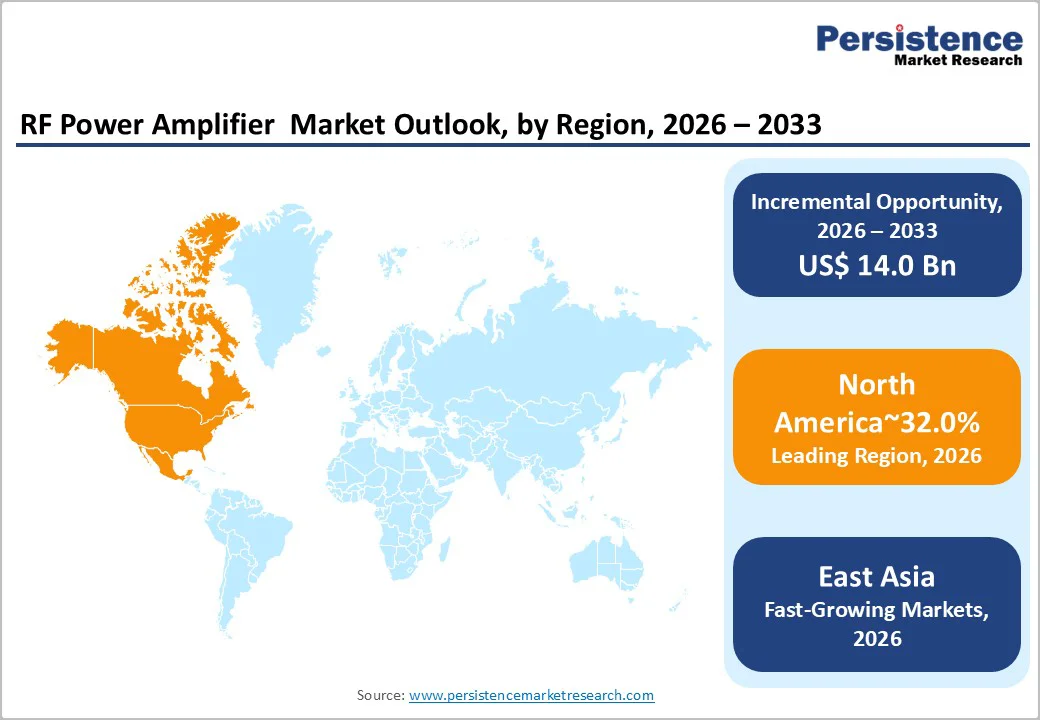
- Regional Leadership: North America leads the RF Power Amplifier Market with ~32% share in 2025, supported by strong U.S. defense budgets, rapid 5G mid-band deployments, and expanding SATCOM infrastructure.
- Fastest-Growing Region: East Asia holds ~28% share in 2025 and stands as the fastest-growing region, driven by China’s large-scale 5G base-station rollout and rising GaN fabrication capacity across China, Japan, and South Korea.
- Europe Positioning: Europe accounts for ~24% share in 2025, strengthened by harmonised spectrum policies, cybersecurity compliance mandates, and accelerating defence modernisation programs across NATO economies.
- Dominance of Frequency Band: Mid Frequency (1-6 GHz) leads with a 46% share in 2025, anchored by global reliance on sub-6 GHz massive-MIMO architectures for commercial 5G networks.
- Fastest-Growing Frequency Band: Millimeter Wave (>30 GHz) emerges as the fastest-growing segment, fuelled by LEO satellite constellation expansion and rising adoption of 76-81 GHz radar in autonomous and premium automotive systems.
- End-user Leadership: Telecommunications Service Providers dominate end-user demand with a 48% share in 2025, supported by 5G densification cycles, Open-RAN hardware upgrades, and network energy-efficiency optimization programs.
- Fastest-Growing End-user: Defense remains the fastest-growing end-user category, driven by GaN-on-SiC amplifier adoption for high-power X-band radar, EW systems, and next-generation combat communication platforms.
| Key Insights | Details |
|---|---|
| RF Power Amplifier Market Size (2026E) | US$ 12.7 Bn |
| Market Value Forecast (2033F) | US$ 26.7 Bn |
| Projected Growth (CAGR 2026 to 2033) | 11.2% |
| Historical Market Growth (CAGR 2020 to 2025) | 8.9% |
Market Dynamics
Drivers - Accelerating 5G Infrastructure Deployment and Government-Backed Telecommunications Investment
The global rollout of 5G networks represents a primary structural driver for the RF Power Amplifier Market demand. According to telecommunications research, global 5G infrastructure capital expenditure increased by 60% between 2023 and 2024, with providers allocating record investment volumes toward base station densification and network upgrades.
In India specifically, telecommunications operators have committed approximately Rs 4.5 lakh crore (US$54 billion) in 5G infrastructure investments, with 5G coverage now reaching 98% of districts and 82% of the population within 22 months of commercial service launch. The RF Power Amplifier Market directly benefits from this capital intensity, as 5G base stations require high-efficiency power amplifiers across 2.3-3.8 GHz frequency bands to enable massive-MIMO antenna systems with 64 or more power-amplifier channels per installation.
Gallium Nitride (GaN) power amplifiers deliver 15-20% energy-efficiency improvements over legacy LDMOS technology in these deployments, translating to substantial operating-cost reductions for network operators. The adoption of Open-RAN standardisation is decoupling radio hardware from system vendors, enabling specialised RF Power Amplifier manufacturers to capture incremental sockets for remote-radio-head upgrades, further broadening addressable demand.
Defence Spending Modernisation and Advanced Radar System Procurements
Government defence expenditures are driving RF Power Amplifier Market growth through radar system modernisation and next-generation platform development. In North America, the U.S. defence budget remains robust at approximately US$895 billion for fiscal year 2025, with the Pentagon allocating substantial supplemental funding toward next-generation air systems (NGAD) and collaborative combat aircraft initiatives.
Emerging economies are also accelerating procurement. India's defence budget for FY 2025-26 has increased by 13% to Rs 6,81,210 crore, with capital outlay for new equipment acquisition prioritised to accelerate defence production and achieve Rs 30,000 crore (US$3.6 billion) in defence exports by March 2026.
The modernisation focus includes airborne radar systems utilising X-band and beyond, driving demand for high-power GaN-on-SiC RF Power Amplifiers capable of delivering 100-300 W output power with superior thermal management and 80% drain efficiency. Lockheed Martin's adoption of GaN-on-SiC amplifiers in fighter-jet radar transmit-receive modules underscores operational reliability expectations that position the RF Power Amplifier Market as mission-critical to advanced military systems.
Millimetre-Wave (mmWave) Technology Adoption in Satellite Communications and Automotive Radar
The transition from legacy satellite communication architectures to high frequency mmWave systems is creating rapid demand expansion within the RF Power Amplifier Market. The global satellite communications equipment market is projected to witness strong growth, driven by low-earth-orbit (LEO) satellite constellation proliferation and dense satellite broadband deployments.
MACOM Technology Solutions' showcase at SATELLITE 2025 highlighted high-power opto-amplifiers delivering 10-50 W for satellite links, alongside linearised Q-band GaN MMIC power amplifiers achieving 38% efficiency in C-Band satellite communication applications. Furthermore, automotive radar standardisation shifting globally from 24 GHz to 76-81 GHz frequency bands is accelerating GaN-based power amplifier adoption across automotive original-equipment manufacturers (OEMs).
China and South Korea have demonstrated 79 GHz radar penetration rates exceeding industry expectations, with GaN MMICs enabling 2 cm object resolution at 200 meters and supporting autonomous vehicle Level-3+ systems. This convergence of satellite modernisation and automotive electrification is driving mmWave power amplifier demand within the RF Power Amplifier Market.
Market Restraining Factors
Supply Chain Bottlenecks in GaN-on-SiC Substrate Manufacturing and Wafer Capacity Limitations
The RF Power Amplifier Market faces structural supply constraints rooted in GaN-on-SiC fabrication capacity. Current global availability of 200 mm GaN-on-SiC wafers remains limited, with extended lead times for high-quality silicon carbide substrates creating allocation environments that prioritise defence and space contracts over commercial applications. Research-grade semiconductor fabs have documented yield challenges when scaling GaN-on-Silicon to 200 mm CMOS production lines, due to contamination and wafer bow issues, which delays cost-optimisation learning curves by 12-18 months.
STMicroelectronics' decision to co-locate GaN epitaxy and packaging in Italy illustrates vertical-integration responses; however, meaningful global capacity relief is unlikely before late 2026. This supply constraint limits the RF Power Amplifier Market's ability to fulfil demand across price-sensitive commercial segments, forcing device vendors to rationalise allocation toward high-margin aerospace and defence applications.
Opportunity - 6G Network Standards Development and Sub-Terahertz (Sub-THz) Frequency Band Exploration
The emergence of 6G research initiatives is creating substantial design and development opportunities within the RF Power Amplifier Market. Academic and industry consortia are conducting evaluations of GaN-on-diamond technologies that achieve thermal conductivity near 1,700 W/m·K approximately twice that of silicon carbide positioning such materials for operation at 40 GHz and above under the 6G agenda.
India's new National Telecommunications Policy (2025) explicitly prioritises the release of spectrum for millimetre-wave (mmWave) and sub-THz applications, alongside encouragement of experimentation in terahertz bands to support both current and future market requirements. Government-sponsored innovation frameworks are reducing commercialisation risk for RF power amplifier manufacturers developing next-generation power devices. International Telecommunication Union (ITU) coordination processes for 6G frequency allocations are underway, with spectral planning activities informing device design roadmaps. This proactive regulatory environment is incentivising sustained R&D investment in wideband and high-efficiency amplifier architectures, supporting RF Power Amplifier Market differentiation.
The integration of AI-driven predistortion (DPD) techniques with RF Power Amplifier architecture represents another emerging opportunity. Broadcom's FiFEM™ integrated front-end modules for Wi-Fi 6E and Wi-Fi 7 access point applications demonstrate achievable power-consumption reductions of 40% through DPD optimisation, combined with superior 5 GHz/6 GHz band coexistence. This efficiency envelope creates market opportunities for RF Power Amplifier vendors to support next-generation edge computing and private 5G deployments targeting industrial manufacturing and autonomous systems.
Industrial IoT Wireless Power Transfer and Smart Manufacturing Infrastructure Expansion
Industry 4.0 paradigms are creating incremental RF Power Amplifier Market demand through wireless power transmission and distributed-sensor networked deployments. Advanced manufacturing architectures are adopting resonant-coupling technologies for wireless industrial robot charging and factory automation, eliminating the necessity for complex wiring infrastructure and enabling rapid production-line retooling.
Energy-efficient coupling designs with optimised field geometries reduce transmission losses over traditional wired systems, particularly for high-current applications where contact resistance is a performance bottleneck. Combined power-and-data coupling methodologies are transmitting data signals onto RF carrier waves without degrading energy transfer efficiency, creating synergistic demand for broadband RF Power Amplifier modules.
Smart manufacturing infrastructure investments across Asia-Pacific supported by government policies including China's "Made in China 2025" initiative are directing substantial capital toward edge-computing deployments that require compact, efficient RF power distribution. These architectural transitions position the RF Power Amplifier Market as an enabler of next-generation manufacturing flexibility and mass-customisation capabilities.
Category-wise Analysis
Frequency Band Insights
The Mid Frequency segment (1-6 GHz) represents the largest revenue contributor to the RF power amplifier market in 2026, capturing 46.0% of global sales. This dominance reflects the fundamental role of mid-frequency power amplifiers in 5G base-station architectures, where bands including 2.3 GHz, 2.6 GHz, and 3.5 GHz enable nationwide coverage and capacity enhancements.
Telecommunication operators deploying massive-MIMO base stations require 64-256 power-amplifier channels per site, and the sub-6 GHz spectrum remains operationally efficient for achieving broad geographic coverage with minimal infrastructure densification. Legacy 4G/LTE equipment in this band is being upgraded with GaN-based modules, extending the mid-frequency segment's addressable market across retrofit and new deployment scenarios.
The millimetre wave segment (>30 GHz) represents the highest-growth RF Power Amplifier Market tier, driven by satellite communications modernisation, 5G mmWave-band deployments, and next-generation automotive radar platforms. The 28 GHz and 39 GHz frequency allocations for 5G in North America and Europe have catalysed vendor investment in compact, high-efficiency mmWave power amplifiers suitable for phased-array antenna systems. MACOM's demonstrations at European Microwave Week 2024 showcased advanced Ka-band and Q-band power amplifiers delivering superior linearity and thermal performance for SATCOM applications.
End-user Insights
Telecommunication service providers are likely to dominate in 2026, commanding 48.0% of global revenue. Operators including Verizon, AT&T, China Mobile, Deutsche Telekom, and NTT Docomo are deploying large-scale 5G capital expenditure programs requiring hundreds of thousands of base-station units incorporating new power-amplifier designs. The competitive intensity of global telecommunications markets is incentivising rapid network densification and spectral efficiency improvements, creating annual replacement cycles for RF Power Amplifier components.
India's telecommunications sector exemplifies this dynamic, with operators committing Rs 4.5 lakh crore in 5G infrastructure investment to achieve near-complete national coverage. The depreciation of mid-band 5G deployment costs and the transition toward millimetre-wave spectrum utilisation in dense urban clusters are sustaining operator capital allocation to RF Power Amplifier inventory.
Government and Defence end users are representing the fastest-growing RF Power Amplifier Market segment, driven by advanced-platform modernisation and emerging-threat response. The Pentagon's radar-modernisation initiatives are adopting X-band GaN power amplifier tiles for phased-array systems, with individual device pricing substantially elevated above commercial-grade equivalents due to stringent reliability and performance specifications.
Regional Insights and Trends
North America RF Power Amplifier Market Trends
North America represents the largest geographic RF Power Amplifier Market, commanding approximately 32% of global revenue. The U.S. remains the segment leader, driven by substantial defence procurement for advanced radar and communication systems, alongside leading-edge 5G infrastructure deployment by telecommunications operators Verizon and AT&T. The Pentagon's defence budget authorisation of approximately US$895 billion for fiscal year 2025, combined with supplemental allocations for next-generation systems, is catalysing sustained RF Power Amplifier demand for phased-array radar, electronic-warfare systems, and advanced airborne platforms.
The U.S. satellite communications (SATCOM) market was estimated at US$26.3 billion in 2024 and is projected to reach US$66.49 billion by 2034, expanding at a CAGR of 10.9% during 2025-2034, creating incremental opportunities for high-power RF Power Amplifier vendors serving satellite and terrestrial communications systems.
North American semiconductor manufacturers including Qorvo, Broadcom, and Skyworks Solutions maintain dominant competitive positions through captive vertical integration, advanced GaN foundry capabilities, and extensive patent portfolios in power-density and thermal-packaging technologies. Qorvo's expansion of GaN-on-SiC fabrication capacity at its Richardson, Texas, facility exemplifies regional manufacturing resilience and technological leadership. Canada is boosting satellite-launch activities for research and development purposes, diversifying North American opportunities beyond U.S. defence programs.
East Asia RF Power Amplifier Market Trends
East Asia represents the second-largest RF power amplifier market accounting for approximately 28% of global revenue and emerging as the fastest-expanding region through 2033. China's telecommunications infrastructure investments are unprecedented in scale, with 5G base-station deployments now numbering in the hundreds of thousands.
The rapid integration of 5G-Advanced networks in Chinese cities to support autonomous driving and the low-altitude economy (drone deliveries and urban air mobility) is driving record RF power amplifier demand. China's semiconductor manufacturing capacity is expanding aggressively under the "Made in China 2025" initiative, with 32 advanced wafer fabs under construction targeting expansion of domestic chip production by 40% within five years and potentially doubling over the next decade. Local GaN foundry build-outs and policy support for semiconductor self-reliance are reducing supply-chain dependencies and enabling cost-competitive RF Power Amplifier manufacturing.
South Korea's focus on AI data-centre deployments and automotive radar development is sustaining RF Power Amplifier demand, particularly for high-frequency GaN applications. The 76-81 GHz automotive radar frequency-band standardisation is driving accelerated adoption of GaN MMICs among OEM suppliers concentrated in Seoul and Shanghai. Japan's historical leadership in SiC substrate supply and consumer-electronics legacy positions the nation as a critical node in RF Power Amplifier value chains, supplying advanced materials and manufacturing equipment to regional and global vendors.
Europe RF Power Amplifier Market Trends
Europe represents approximately 24% of the global RF Power Amplifier Market revenue, with distinct emphasis on regulatory compliance, sustainability, and defense modernization. The European Electronic Communications Code (EECC) provides the regulatory framework for 5G network deployment, with the Radio Spectrum Policy Group (RSPG) advising on spectrum allocation and harmonization across EU member states.
European telecommunications operators, including Deutsche Telekom, Vodafone, and Orange, are undertaking substantial 5G infrastructure investments, though at lower capital intensity than Asian or North American counterparts. The Network and Information Security Directive mandates cybersecurity baseline requirements for critical infrastructure, including telecom providers, driving adoption of advanced RF components with enhanced supply-chain security verification.
Competitive Landscape
The global RF Power Amplifier market is largely consolidated, dominated by a handful of technologically advanced companies that hold significant market share due to their strong product portfolios, extensive R&D capabilities, and established relationships with aerospace, defense, telecom, and satellite customers.
The market leaders include MACOM Technology Solutions Inc., Broadcom Inc., Infineon Technologies AG, Qorvo Inc., CML Microcircuits, and NXP Semiconductors. These companies leverage their expertise in GaN, GaAs, and CMOS technologies to develop high-performance RF and microwave amplifiers across a wide frequency range, catering to applications such as radar, satellite communication, 5G infrastructure, and defense electronics.
Key Industry Developments:
- September 18, 2025 - MACOM Technology Solutions Inc.: Showcased its RF, microwave, and millimeter-wave product portfolio at European Microwave Week 2025, highlighting Ka-Band and Q-Band power amplifiers for SATCOM, a C-Band 700W RF Power Pallet for pulsed radar systems, and ultra LNAs for E-Band applications, emphasising advanced GaN and GaAs packaging, high linearity, thermal performance, and high-reliability solutions across commercial, aerospace, and radar markets.
- November 27, 2025 - CML Microsystems: Partnered with Modelithics under the MVP Programme to develop new nonlinear models for its RF power amplifiers, including CMX90A006, CMX90A007, and CMX90A009, to be added to the Modelithics COMPLETE Library, facilitating accurate, scalable simulation and faster design integration for RF and microwave applications.
Companies Covered in RF Power Amplifier Market
- NXP Semiconductors NV
- Qualcomm Technologies, Inc. / Qualcomm Inc.
- MACOM
- BONN Elektronik GmbH
- OPHIR RF
- Infineon Technologies AG
- CML Microsystems PLC
- Broadcom / Broadcom Ltd.
- Analogue Devices Inc.
- ETL Systems Ltd
- Analogic Corporation
- ETS-Lindgren
- Murata Manufacturing Co., Ltd. / Murata Manufacturing Co. Ltd.
- II-VI Inc.
- Mitsubishi Corporation
- Skyworks Solutions Inc.
- Toshiba Corporation
Frequently Asked Questions
The global RF Power Amplifier Market is projected to be valued at US$ 12.7 Bn in 2026.
The Wideband / Broadband RF Power Amplifiers segment is expected to account for approximately 28.0% of the global RF Power Amplifier Market by Product Type in 2026.
The market is expected to witness a CAGR of 11.2% from 2026 to 2033.
The RF Power Amplifier Market is driven by accelerating 5G infrastructure deployment, rising defense radar modernization, and growing mmWave adoption across satellite communications and automotive radar systems.
Key market opportunities in the RF Power Amplifier Market include 6G-driven sub-THz and GaN-on-diamond innovation, AI-enhanced DPD efficiency gains for next-generation connectivity and rising demand for RF power solutions in industrial IoT wireless power transfer and smart manufacturing infrastructure.
The key players in the RF Power Amplifier market include NXP Semiconductors N.V., Qualcomm Technologies, Inc., MACOM, Infineon Technologies AG, Analog Devices, Inc., and Broadcom Inc.


