


- Automotive Components & Materials
- Oil Catch Cans Market
Oil Catch Cans Market Size, Share, and Growth Forecast, 2026 – 2033
Oil Catch Cans Market by Chamber Type (Single Chamber, Dual Chamber, Others), Material Type (Aluminum, Stainless Steel, Plastic, Others), Vehicle Type (Passenger Vehicles, Light Commercial Vehicles (LCVs), Heavy Commercial Vehicles (HCVs)), and Regional Analysis for 2026-2033
Oil Catch Cans Market Share and Trends Analysis
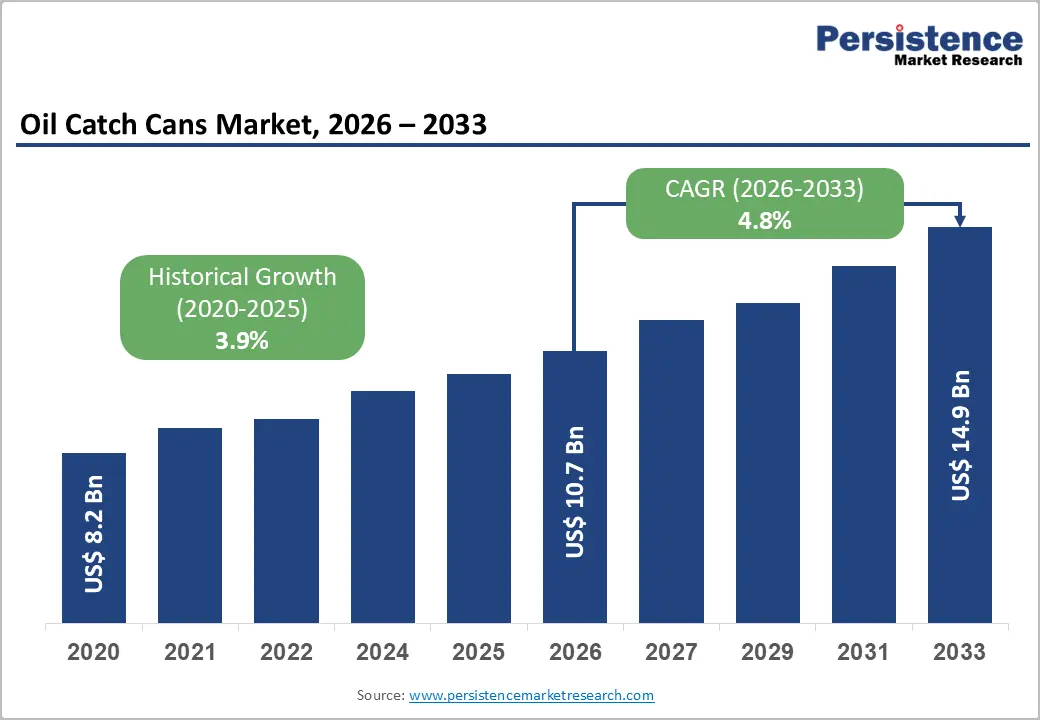
The global oil catch cans market size is likely to be valued at US$ 10.7 billion in 2026, and is projected to reach US$ 14.9 billion by 2033, growing at a CAGR of 4.8% during the forecast period 2026−2033.
Market expansion is primarily driven by increasing vehicle engine efficiency standards and emission control requirements, which necessitate the integration of oil catch can systems. Rising consumer awareness of engine maintenance and extended engine life enhances adoption rates. Technological innovations in materials and design improve product performance, thereby supporting higher integration across passenger and commercial vehicles. Regulatory frameworks targeting reduced engine emissions create direct demand for oil catch can systems in both developed and emerging automotive markets.
Integration of digital monitoring and maintenance tracking systems facilitates real-time performance insights, encouraging broader adoption across fleet operators. Expansion of automotive manufacturing infrastructure, particularly in regions with high vehicle production volumes, strengthens distribution and service networks, promoting consistent market penetration. Demographic trends such as increasing vehicle ownership and urban mobility expansion further amplify product demand.
Key Industry Highlights
- Dominant Region: Asia Pacific is poised to hold a market share of about 35% in 2026, driven by fleet expansion and diesel engine use.
- Fastest-growing Market: Asia Pacific is forecasted to be the fastest-growing market between 2026 and 2033, supported by maintenance awareness and fleet growth.
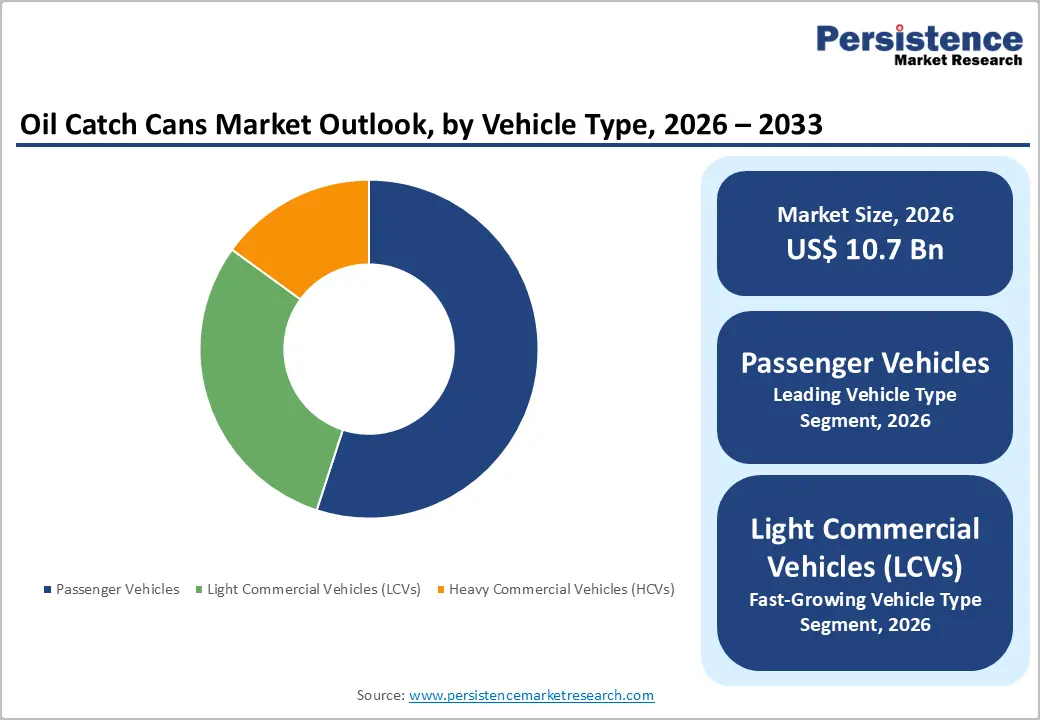
- Leading Vehicle Type: Passenger vehicles are projected to lead with an approximate 55% market share in 2026, owing to surging production volumes and emission compliance.
- Fastest-growing Vehicle Type: Light commercial vehicles (LCVs) are expected to be the fastest-growing through 2033, fueled by delivery growth and fleet modernization.
| Key Insights | Details |
|---|---|
|
Oil Catch Cans Market Size (2026E) |
US$ 10.7 Bn |
|
Market Value Forecast (2033F) |
US$ 14.9 Bn |
|
Projected Growth (CAGR 2026 to 2033) |
4.8% |
|
Historical Market Growth (CAGR 2020 to 2025) |
3.9% |
Market Factors – Growth, Barriers, and Opportunity Analysis
Growing Aftermarket Automotive Industry
The aftermarket automotive sector demonstrates sustained expansion in vehicle parts, services, maintenance and repair, and routine replacement activities, forming a critical platform for performance components such as oil catch cans. In the United States light-duty aftermarket, total sales grew by 5.7% in 2024 to about US$ 413.7 billion and are projected to continue growth into 2025 under current industry expectations, reflecting expanding demand for parts and services beyond original equipment manufacturer supply channels. This momentum is underpinned by extensive fleets of vehicles in operation and longer average vehicle ownership durations, which increase frequency of part replacement, system upgrades and performance enhancements in aftermarket channels.
Structured distribution and service networks in the aftermarket reduce downtime and broaden access to maintenance solutions, positioning independent workshops, parts retailers and online platforms as primary customer interfaces for vehicle owners seeking both corrective and preventive solutions. Freeing aftermarket activities from direct dealer service restrictions through supportive policy frameworks enhances competitive access and wider product availability, increasing consumer choice for upgrades and repairs. Mature markets with high vehicle ownership sustain consistent aftermarket activity while rising e-commerce integration and digitization improve parts availability and service convenience, driving higher sales volumes and aftermarket participation.
Rising Awareness of Engine Longevity
Engine component wear directly impacts operational costs and asset utilization in commercial and personal vehicles. Internal combustion engines produce blow-by gases and oil vapors that circulate through the positive crankcase ventilation (PCV) system into the intake manifold, leading to carbon buildup on valves, pistons, and combustion chambers over time, degrading volumetric and combustion efficiency. By intercepting these contaminants before they re-enter the combustion process, an oil catch can mitigates abrasive deposit formation and maintains cleaner airflow pathways, which supports sustained power delivery and reduced frictional losses.
Operational risk management frameworks increasingly emphasize preventive maintenance over corrective repair, with engine longevity emerging as a key cost driver in fleet budgeting and total cost of ownership models. Cleaner internal surfaces and reduced carbon deposition lower the incidence of unscheduled downtime, extend service intervals for throttle bodies and fuel injectors, and limit thermal stresses on cylinder heads and bearings. Fleet managers and performance engineers adopt oil catch systems to preserve combustion stability and limit emissions drift over prolonged duty cycles, maintaining regulatory compliance and residual asset valuation in secondary markets.
Competition from Alternative Solutions
Advanced original equipment manufacturer (OEM) installed crankcase ventilation systems, particularly PCV and integrated oil separators, act as functional alternatives in emission control and blow-by gas management. Government standards enforced by the United States Environmental Protection Agency (EPA) ensure that engines meet strict emissions thresholds, reducing the incremental necessity for external aftermarket components. These factory-installed systems are engineered to recycle or clean crankcase gases back into the combustion process efficiently, maintaining engine performance and emission compliance without additional accessories in regular operations.
Modern designs optimized by OEMs are tailored to specific engine architectures and align with national regulatory frameworks, influencing fleet operators and vehicle purchasers to prioritize integrated solutions under warranty and compliance obligations. Multi-stage filtration and electronic control units manage oil mist, blow-by particles, and vapors effectively, providing similar or superior results compared to external capture units. Engineering investments in these systems deliver performance and emission benefits that reduce reliance on auxiliary components, particularly for standard passenger vehicles and commercial fleets.
Installation Complexity for Non-Technical Users
Installer skill requirements and automotive technical complexity create a key restraint for users unfamiliar with mechanical systems. Many vehicles require precise routing of hoses, selection of correct fittings and secure sealing to maintain crankcase ventilation efficacy; incorrect assembly can induce vacuum leaks or disrupt pressure balance, affecting engine performance and triggering diagnostic trouble codes, demanding deeper mechanical understanding and precise execution than typical basic maintenance. This complexity elevates reliance on trained technicians, raising overall cost and turnaround time for installation tasks.
Workforce limitations amplify the effect of installation complexity for users lacking formal automotive repair training. Modern vehicles integrate more electronics, sensors and safety systems, which require specialized diagnostic tools and procedural knowledge during any modification or accessory installation. Entry-level skill expectations frequently surpass routine oil changes or fluid checks, and without foundational training, even following generic guides can lead to misalignment with manufacturer specifications or vehicle-specific configurations.
Integration with Electric Vehicle (EV) Ancillary Systems
The rapid adoption of electric vehicles is reshaping powertrain architectures and ancillary systems, creating demand for hybrid configurations such as plug-in hybrid electric vehicles and range extenders that combine battery propulsion with internal combustion engines. U.S. government data shows that in 2023, more than 1.4 million new electric vehicles were purchased in the United States, representing around 9% of light-duty vehicle sales and signaling ongoing diversification of propulsion technologies and associated components. Integration into these hybrid systems drives interest in technologies that can manage internal combustion by-products even as electrification grows, since onboard generators and combustion elements remain part of some EV ancillary systems.
This evolving vehicle landscape introduces complexity in thermal management, emissions control, and system efficiency that traditional electric drivetrains alone do not face. Components supporting crankcase ventilation and particulate control retain relevance in configurations where internal combustion elements are retained to support extended range or auxiliary power functions. Engineering these solutions for compatibility with electrified architectures presents avenues for differentiation, as manufacturers seek to optimize overall system efficiency and meet regulatory standards across multiple operating modes.
Expansion into Industrial Engines and Machinery
The industrial engine and machinery segment offers significant potential for oil catch cans due to the critical role of engine reliability and maintenance in operational efficiency. Industrial engines, including those in construction equipment, marine vessels, and stationary generators, operate under high load and extended hours, increasing susceptibility to sludge and oil vapor accumulation in the crankcase. Oil catch cans provide effective mitigation by capturing oil, moisture, and combustion byproducts before they re-enter the intake system. Reducing contamination enhances engine performance, lowers downtime, and extends maintenance intervals, which directly impacts cost efficiency and productivity in industrial operations.
Industrial machinery sectors in emerging markets demonstrate rising infrastructure investments, leading to expanded fleets of diesel-powered equipment. Adoption of oil catch cans within these fleets provides a preventive solution against engine wear and unplanned breakdowns, supporting long-term asset value retention. Manufacturers can leverage this opportunity by developing high-capacity and durable catch cans tailored to the demanding environments of industrial applications. Integration of maintenance monitoring features or modular designs improves usability for industrial operators managing multiple engine types.
Category-wise Analysis
Chamber Type Insights
Single chamber oil catch cans are likely to be the leading segment with 52% revenue share in 2026, due to simplicity in design and compatibility with a wide range of vehicle engines. Operational efficiency, ease of installation, and reduced maintenance requirements make single-chamber units favorable among commercial and private fleet operators. Adoption is reinforced by proven performance in controlling oil vapor contamination, which protects engine longevity. Manufacturer support for aftermarket and original equipment manufacturer (OEM) installations further strengthens market dominance. Accessibility and cost-effectiveness drive widespread acceptance among maintenance providers, ensuring a consistent revenue base.
Dual chamber oil catch cans are expected to witness the fastest growth between 2026 and 2033, as advanced filtration features gain traction. Enhanced separation efficiency and improved engine protection attract fleet managers seeking long-term performance benefits. Provider preference is reinforced by reduced risk of engine oil contamination, resulting in lower maintenance costs. Integration with modern vehicle positive crankcase ventilation (PCV) systems increases compatibility, expanding adoption across passenger and commercial vehicles. Technological innovation in dual-chamber designs promotes adherence among professional service providers. Accessibility through electronic commerce (e-commerce) and automotive aftermarket channels accelerates market penetration, supporting rapid revenue growth.
Vehicle Type Insights
Passenger vehicles are positioned to dominate with nearly 55% of the oil catch cans market revenue share in 2026, supported by high volume production, aftermarket replacement demand, and compatibility with existing engine systems. Broad consumer adoption is reinforced by awareness of engine longevity benefits. Provider networks and service centers prioritize passenger vehicles due to scale and recurring maintenance cycles. Operational efficiency and ease of installation enhance adoption rates. Distribution through OEM channels and e-commerce platforms ensures accessibility and reliability. Compliance with emission standards across regions incentivizes installation in passenger vehicles, reinforcing market dominance.
Light commercial vehicle is expected to emerge as the fastest-growing segment between 2026 and 2033, driven by expansion of urban delivery networks, e-commerce logistics, and fleet modernization initiatives. Operational demands for heavy-duty performance and reduced maintenance costs increase preference for oil catch cans. Digital integration and monitoring enable optimized fleet management, enhancing adoption. Provider networks target commercial operators seeking reliability and compliance with emission standards. Material advancements and compatibility with diverse engine designs facilitate broader deployment.
Regional Insights
North America Oil Catch Cans Market Trends
North America represents a significant market for oil catch cans, driven by increasing focus on engine performance optimization and preventive maintenance across passenger and commercial fleets in the United States, Canada, and Mexico. Advanced fleet management practices and well-established automotive service networks facilitate adoption of oil catch cans among vehicle operators seeking to reduce engine wear and extend maintenance intervals. Rising implementation of dual chamber units with enhanced separation efficiency supports improved engine protection and reduced contamination of crankcase oil. Awareness of emission control standards and compliance requirements in commercial transportation sectors drives demand for devices that contribute to cleaner exhaust output.
Increasing investment in long-haul logistics and heavy-duty transport operations amplifies the need for solutions that maintain engine reliability under extended operational conditions. Consumer preference for technology-driven maintenance tools encourages adoption of smart oil catch cans with monitoring features, enabling proactive service scheduling. Manufacturers are focusing on product differentiation through advanced materials, modular designs, and high-capacity units, allowing penetration across passenger vehicles, commercial trucks, and specialized industrial equipment.
Europe Oil Catch Cans Market Trends
Europe offers high-value opportunities for players in the oil catch cans market due to the high concentration of advanced vehicle fleets and stringent emission regulations. The presence of well-established automotive manufacturing hubs drives demand for aftermarket and OEM components that enhance engine performance and longevity. Commercial and passenger vehicles operating in urban environments face frequent stop-and-go conditions, which increases crankcase oil vapor accumulation. Oil catch cans address this issue by preventing re-entry of oil and combustion byproducts into the intake system, reducing engine wear and maintenance costs. High awareness of preventive maintenance practices among fleet operators and individual vehicle owners supports adoption of both single and dual chamber units.
The market experiences steady growth driven by the transition toward hybrid and low-emission vehicles requiring efficient crankcase management solutions. Fleet operators and maintenance providers emphasize long-term cost efficiency, favoring dual chamber oil catch cans with higher separation capacity and lower contamination risk. Expansion of e-commerce and aftermarket distribution channels enhances accessibility, enabling smaller fleet operators and private consumers to adopt protective engine solutions. Investments in research and development for durable, high-capacity catch cans tailored to heavy-duty commercial vehicles further stimulate demand.
Asia Pacific Oil Catch Cans Market Trends
Asia Pacific is expected to lead with an estimated 35% of the oil catch cans market share in 2026, supported by rapid expansion of passenger and commercial vehicle fleets coupled with increasing focus on engine longevity. Strong automotive manufacturing activity in multiple countries drives demand for performance-enhancing engine components. High utilization of diesel-powered commercial vehicles in logistics, construction, and industrial operations intensifies exposure to crankcase oil vapor and sludge, creating a critical need for catch systems. Well-established automotive aftermarket networks and cost-effective manufacturing infrastructure ensure accessibility of single and dual chamber oil catch cans to fleet operators and individual vehicle owners. Increasing regulatory pressure to meet emission standards strengthens adoption, as oil catch cans provide a practical solution for controlling crankcase emissions and improving engine efficiency.
Asia Pacific is forecasted to be the fastest-growing market for oil catch cans between 2026 and 2033, stimulated by rising awareness of preventive maintenance practices and advanced filtration technology adoption. Fleet operators prioritize long-term operational efficiency, which favors dual chamber units with higher separation efficiency and reduced engine contamination risks. Expansion of industrial and construction equipment fleets adds new growth segments, as stationary and mobile engines operating under heavy load require protective measures against sludge accumulation. Integration with modern PCV systems in newer vehicle models drives technological adoption, while availability through e-commerce and aftermarket channels enhances market reach.

Competitive Landscape
The global oil catch cans market structure exhibits moderate consolidation, with leading players contributing approximately 60% of total revenue. Key market participants such as GReddy Performance Products, RAD Industries, Mishimoto, and AEM Electronics focus on technological differentiation to maintain competitive positioning. Product innovation, including single and dual chamber designs with enhanced filtration efficiency, provides performance advantages for passenger and commercial vehicle engines. Manufacturers emphasize durability, ease of installation, and compatibility with modern PCV systems, strengthening appeal among fleet operators and individual vehicle owners.
Market dynamics are further shaped by fragmented aftermarket channels, which enable niche players to capture specialized demand segments, particularly in performance tuning and industrial applications. While leading manufacturers dominate through brand recognition and technological innovation, smaller suppliers leverage regional distribution networks and targeted marketing to address specific vehicle types or engine requirements. The competitive landscape emphasizes balancing product differentiation, cost-effectiveness, and operational support to secure long-term revenue streams.
Key Industry Developments
- In January 2026, Crawford Performance highlighted that installing an oil catch can on direct-injection Subaru WRX models intercepts crankcase oil vapors before they cause intake valve carbon buildup, improving long-term engine performance and reliability.
Companies Covered in Oil Catch Cans Market
- GReddy Performance Products
- RAD Industries
- Mishimoto
- AEM Electronics
- Moroso Performance Products
- Canton Racing Products
- RacingLine Performance Ltd.
Frequently Asked Questions
The global oil catch cans market is projected to reach US$ 10.7 billion in 2026.
Rising demand for engine protection, emission control, and enhanced vehicle performance is driving the market.
The market is poised to witness a CAGR of 4.8% from 2026 to 2033.
Expansion into industrial engines, hybrid and high-performance vehicles, and smart filtration technologies represents key market opportunities.
Some of the key market players include GReddy Performance Products, RAD Industries, Mishimoto, AEM Electronics, and Moroso Performance Products.


