Indonesia Specialty Fats and Oils Market Size, Share, and Growth Forecast for 2025 - 2032

Indonesia Specialty Fats and Oils Market by Product Type (Specialty Oils, Specialty Fats), by End Use (Food & Beverages Industry, Foodservice Industry (HoReCa), Personal Care & Cosmetics Industry, Retail/Household, Other Industrial End Uses), by Distribution Channel (Business to Business, Business to Consumer)

ID: PMRREP33475
Calendar

August 2025

138 Pages

Author : Amol Patil

Indonesia Specialty Fats and Oils Market Size and Share Analysis

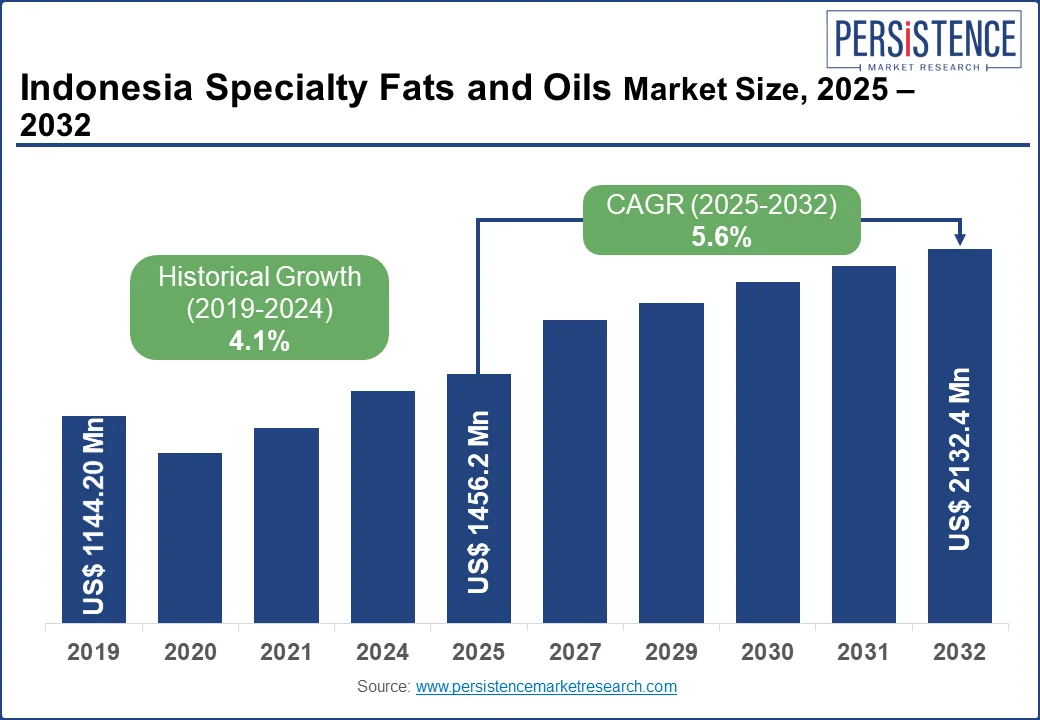
The Indonesia specialty fats and oils market is valued at US$ 1,456.2 Million in 2025 and is projected to reach a size of US$ 2,132.4 Million by the end of 2032, expanding at a CAGR of 5.6% over the next ten years.

Specialty oils are commodity oils that have unique dietary or functional properties. These oils are widely used in the specialized nutrition, food, and cosmetics industries. Specialty fats are a unique category of fats that represent substitutes for common fats such as cocoa butter, and milk fats, among others.

Several manufacturers in the country are aiming at strengthening their distribution networks to increase the export of specialty oils and fats to different countries. They are focusing on strengthening their business processes, ultimately paving the way for new market growth opportunities.

Indonesia Specialty Fats and Oils Market Size 2025 - 2032

Specialty fats and oils are highly utilized in the foodservice sector. Growing preference for plant-based alternatives to butter and clean-label food products is driving product sales in the country.

Attributes Key Insights

Indonesia Specialty Fats and Oils Market Size (2025E)

US$ 1,456.2 Million

Projected Market Value (2032F)

US$ 2,132.4 Million

Market Growth Rate (2025 to 2032)

5.6% CAGR

Historical Growth Rate (2019 to 2024)

4.1% CAGR

Market Share of Top 3 Manufacturers

25% to 30%

What are the Hindrances to the Adoption of Specialty Fats and Oils?

“Wide Availability of Trans-fat-free Substitutes in the Country”

The fats and oils market is characterized by a crowded landscape with numerous options, which can create challenges and competition among different products. In the specialty fats market, there are substitutes available that resemble margarine, much like how margarine itself serves as a substitute for butter. Butter, lard, vegetable oil spread, ricotta cheese, avocado oil, cream cheese, cocoa butter, and olive oil spread are among the most common alternatives to margarine.

These alternatives frequently provide almost identical properties as margarine in a variety of finished products, particularly baked goods. One of the factors hindering the growth of the Indonesia specialty fats market is the fact that margarine may contain trans fats while its substitutes do not.

Category-wise Insights

Which Type of Specialty Fat Accounts for High Sales?

“Cocoa Butter Equivalents’ Effectiveness in Improving Flavor Profile of Confectionery Products Fueling Their Sales”

The cocoa butter equivalents (CBE) segment is expected to hold 13% share of the Indonesian market in 2025.

Increasing utilization of confectionery products is prompting producers to use cocoa butter equivalents fats as an ingredient to improve the flavor profile of their products. Growing demand for healthy fat products along with the rising number of food companies seeking better fat ingredients are propelling sales of specialty fats.

Which End-use Industry is Expected to Hold a Leading Market Share?

“Consumption of Specialty Fats and Oils in Retail/Household Sector Increasing Significantly”

Based on end use, the Indonesia specialty fats and oils market is segregated into food and beverages, foodservice (HoReCa), personal care and cosmetics industry, retail/household, and others. In 2025, the retail/household segment is expected to generate a revenue of US$ 428 million.

Consumers are growing more health-conscious and are looking for alternatives to traditional cooking fats such as regular vegetable oils and butter. This is expected to lead to increased demand for specialty fats and oils from the retail and household sector in Indonesia during the forecast period.

Competitive Dashboard

Leading manufacturers of specialty fats and oils in Indonesia are carrying out collaborations and partnerships to gain synergy benefits and enhance their production capacity for a larger market share. Prominent players are directing their offerings toward the foodservice industry.

  • In December 2021, Apical Group collaborated with Singapore Agri-Food Innovation Lab (SAIL) established by Nanyang Technological University (NTU Singapore). This collaboration will help the company advance innovation and sustainability in the agri-food sector through seed partnerships across the food chain.
  • In 2021, Cargill established its new palm oil refinery in Lampung, Indonesia with an investment of US$ 200 million. This facility will help the company accelerate the development of a sustainable palm oil supply chain to provide customers with a range of deforestation-free and verified products.
  • PT Landkrone Indo Nutri has obtained several quality certifications to prove the versatility of its products in different regions. The company has obtained ISO 22000:2005 and Halal certifications from reputable certification agencies worldwide.
  • In 2019, Sinar Meadow participated in conferences & expos in Indonesia. The company showcased its offerings at the esteemed Sial Interfood, the largest food and beverages exhibition, which took place at Arena JIExpo Kemayoran, Indonesia. During these events, local experts from Sinar Meadow interacted with customers, discussing the latest trends and opportunities.

Companies Covered in Indonesia Specialty Fats and Oils Market

  • Apical Group
  • Archer Daniels Midland Company
  • Bunge Limited
  • Cargill Incorporated
  • Fuji Oil Holdings Incorp.
  • ICC Oils and Fats FZC
  • Musim Mas
  • Olam International Limited
  • PT Landkrone Indo Nutri
  • PT. Golden Union Oil
  • Puratos Group
  • Sinar Meadow
  • Wilmar International Limited
  • Others (Available on Request)
Frequently Asked Questions

It is valued at US$ 1,456.2 million in 2025.

It is projected to reach US$ 2,132.4 million by 2032.

The market is expected to grow at a 5.6% CAGR.

They hold a combined share of 25% to 30%.

Apical Group, Cargill, ADM, Musim Mas, Wilmar International, and others.

Indonesia Specialty Fats and Oils Market Report Scope
Attribute Details

Forecast Period

2025 to 2032

Historical Data Available for

2019 to 2024

Market Analysis

  • US$ Billion for Value
  • Tons for Volume

Key Market Segments Covered

  • Product Type
  • End Use
  • Distribution Channel

Key Companies Profiled

  • Apical Group
  • Archer Daniels Midland Company
  • Bunge Limited
  • Cargill Incorporated
  • Fuji Oil Holdings Incorp.
  • ICC Oils and Fats FZC
  • Musim Mas
  • Olam International Limited
  • PT Landkrone Indo Nutri
  • PT. Golden Union Oil
  • Puratos Group
  • Sinar Meadow
  • Wilmar International Limited
  • Others (Available on Request)

Report Coverage

  • Market Forecast
  • Company Share Analysis
  • Competition Intelligence
  • DROT Analysis
  • Market Dynamics and Challenges
  • Strategic Growth Initiatives

Customization & Pricing

Available upon Request

Indonesia Specialty Fats and Oils Market Segmentation

By Product Type:

  • Specialty Oils
    • Palm Oil
    • Soya Oil
    • Coconut Oil
    • Peanut Oil
    • Rapeseed Oil
    • Sunflower Oil
    • Olive Oil
    • Others
  • Specialty Fats
    • Cocoa Butter Replacers (CBR)
    • Cocoa Butter Substitutes (CBS)
    • Cocoa Butter Equivalents (CBE)
    • Lauric Fats
    • Creaming Fats
    • Anhydrous Milk Fats
    • Butter
    • Margarine

By End Use:

  • Food & Beverages Industry
    • Bakery & Confectionery
    • Dairy and Ice cream
    • Snacks and Savories
    • Infant Formulae
    • Specialized Nutrition
    • Others Processed Products
  • Foodservice Industry (HoReCa)
  • Personal Care & Cosmetics Industry
  • Retail/Household
  • Other Industrial End Uses

By Distribution Channel:

  • Business to Business
  • Business to Consumer
    • Hypermarkets/Supermarkets
    • Convenience Stores
    • Specialty Stores
    • Online Retail

Related Reports

1. Executive Summary

    1.1. Market Outlook

    1.2. Demand Side Trends

    1.3. Supply Side Trends

    1.4. Technology Roadmap

    1.5. Analysis and Recommendations

2. Market Overview

    2.1. Market Coverage / Taxonomy

    2.2. Market Definition / Scope / Limitations

3. Key Market Trends

    3.1. Increasing Demand for Non-PHO Alternatives in Bakery Industry

    3.2. Growing Demand for Clean Labeling Driving Product Sales

    3.3. Others

4. Key Success Factors

    4.1. Product Adoption / Usage Analysis

    4.2. Product USPs / Features

    4.3. Strategic Promotional Strategies

5. Indonesia Market Demand Analysis 2018-2022 and Forecast, 2023-2033

    5.1. Historical Market Volume (Tons) Analysis, 2018-2022

    5.2. Current and Future Market Volume (Tons) Projections, 2023-2033

    5.3. Y-o-Y Growth Trend Analysis

6. Indonesia Market - Pricing Analysis

    6.1. Average Pricing Analysis Benchmark

7. Indonesia Market Demand (in Value or Size in US$ Mn) Analysis 2018-2022 and Forecast, 2023-2033

    7.1. Historical Market Value (US$ Mn) Analysis, 2018-2022

    7.2. Current and Future Market Value (US$ Mn) Projections, 2023-2033

        7.2.1. Y-o-Y Growth Trend Analysis

        7.2.2. Absolute $ Opportunity Analysis

8. Market Background

    8.1. Macro-Economic Factors

        8.1.1. Indonesia GDP Growth Outlook

        8.1.2. APAC GDP Growth Outlook

        8.1.3. Indonesia GDP and Infrastructure Investment

    8.2. Forecast Factors - Relevance & Impact

        8.2.1. Top Companies Historical Growth

        8.2.2. GDP Growth forecast

        8.2.3. Manufacturing Industry forecast

        8.2.4. Urbanization Growth Outlook

        8.2.5. Business Climate

    8.3. Value Chain

        8.3.1. Raw Material Suppliers

        8.3.2. Product Manufacturers

        8.3.3. Application Sectors

    8.4. Global Food & Beverage Industry Outlook

    8.5. Policy Developments and Regulatory Scenario

        8.5.1. Food Standards Indonesia

    8.6. Market Dynamics

        8.6.1. Drivers

        8.6.2. Restraints

        8.6.3. Opportunity Analysis

    8.7. Indonesia Supply Demand Analysis

9. Indonesia Market Analysis 2018-2022 and Forecast 2023-2033, by Product Type

    9.1. Introduction

    9.2. Historical Market Size (US$ Mn) and Volume Analysis By Product Type, 2018-2022

    9.3. Current and Future Market Size (US$ Mn) and Volume Analysis and Forecast By Product Type, 2023-2033

    9.4. Specialty Oils

        9.4.1. Palm Oil

        9.4.2. Soya Oil

        9.4.3. Coconut Oil

        9.4.4. Peanut Oil

        9.4.5. Rapeseed Oil

        9.4.6. Sunflower Oil

        9.4.7. Olive Oil

        9.4.8. Others

    9.5. Specialty Fats

        9.5.1. Cocoa Butter Replacer (CBR)

        9.5.2. Cocoa Butter Substitutes (CBS)

        9.5.3. Cocoa Butter Equivalent (CBE)

        9.5.4. Lauric Fats

        9.5.5. Creaming Fats

        9.5.6. Anhydrous Milk Fats

        9.5.7. Butter

        9.5.8. Margarine

    9.6. Market Attractiveness Analysis By Product Type

10. Indonesia Market Analysis 2018-2022 and Forecast 2023-2033, by End Use

    10.1. Introduction

    10.2. Historical Market Size (US$ Mn) and Volume Analysis By End Use, 2018-2022

    10.3. Current and Future Market Size (US$ Mn) and Volume Analysis and Forecast By End Use, 2023-2033

        10.3.1. Food and Beverages Industry

            10.3.1.1. Bakery & Confectionery

            10.3.1.2. Dairy and Ice cream

            10.3.1.3. Snacks and Savory

            10.3.1.4. Infant Formulae

            10.3.1.5. Specialized Nutrition

            10.3.1.6. Others Processed Products

        10.3.2. Foodservice Industry (HoReCa)

        10.3.3. Personal Care and Cosmetic Industry

        10.3.4. Retail/Household

        10.3.5. Other Industrial End Use

    10.4. Market Attractiveness Analysis By End Use

11. Indonesia Market Analysis 2018-2022 and Forecast 2023-2033, by Distribution Channel

    11.1. Introduction

    11.2. Historical Market Size (US$ Mn) and Volume Analysis By Distribution Channel, 2018-2022

    11.3. Current and Future Market Size (US$ Mn) and Volume Analysis and Forecast By Distribution Channel, 2023-2033

        11.3.1. Business to Business

        11.3.2. Business to Consumer

            11.3.2.1. Hypermarkets/Supermarkets

            11.3.2.2. Convenience Stores

            11.3.2.3. Specialty Stores

            11.3.2.4. Online Retail

    11.4. Market Attractiveness Analysis By Distribution Channel

12. Market Structure Analysis

    12.1. Market Analysis by Tier of Companies (Specialty Fats and Oils)

    12.2. Market Concentration

    12.3. Market Presence Analysis

13. Competition Analysis

    13.1. Competition Dashboard

    13.2. Competition Deep Dive

        13.2.1. Apical Group

            13.2.1.1. Overview

            13.2.1.2. Product Portfolio

            13.2.1.3. Profitability by Market Segments (Product/Channel/Region)

            13.2.1.4. Sales Footprint

            13.2.1.5. Strategy Overview

        13.2.2. Archer Daniels Midland Company

            13.2.2.1. Overview

            13.2.2.2. Product Portfolio

            13.2.2.3. Profitability by Market Segments (Product/Channel/Region)

            13.2.2.4. Sales Footprint

            13.2.2.5. Strategy Overview

        13.2.3. Bunge Limited

            13.2.3.1. Overview

            13.2.3.2. Product Portfolio

            13.2.3.3. Profitability by Market Segments (Product/Channel/Region)

            13.2.3.4. Sales Footprint

            13.2.3.5. Strategy Overview

        13.2.4. Cargill Incorporated

            13.2.4.1. Overview

            13.2.4.2. Product Portfolio

            13.2.4.3. Profitability by Market Segments (Product/Channel/Region)

            13.2.4.4. Sales Footprint

            13.2.4.5. Strategy Overview

        13.2.5. Fuji Oil Holdings Incorp.

            13.2.5.1. Overview

            13.2.5.2. Product Portfolio

            13.2.5.3. Profitability by Market Segments (Product/Channel/Region)

            13.2.5.4. Sales Footprint

            13.2.5.5. Strategy Overview

        13.2.6. ICC Oils and Fats FZC

            13.2.6.1. Overview

            13.2.6.2. Product Portfolio

            13.2.6.3. Profitability by Market Segments (Product/Channel/Region)

            13.2.6.4. Sales Footprint

            13.2.6.5. Strategy Overview

        13.2.7. Musim Mas

            13.2.7.1. Overview

            13.2.7.2. Product Portfolio

            13.2.7.3. Profitability by Market Segments (Product/Channel/Region)

            13.2.7.4. Sales Footprint

            13.2.7.5. Strategy Overview

        13.2.8. Olam International Limited

            13.2.8.1. Overview

            13.2.8.2. Product Portfolio

            13.2.8.3. Profitability by Market Segments (Product/Channel/Region)

            13.2.8.4. Sales Footprint

            13.2.8.5. Strategy Overview

        13.2.9. PT Landkrone Indo Nutri

            13.2.9.1. Overview

            13.2.9.2. Product Portfolio

            13.2.9.3. Profitability by Market Segments (Product/Channel/Region)

            13.2.9.4. Sales Footprint

            13.2.9.5. Strategy Overview

        13.2.10. PT. Golden Union Oil

            13.2.10.1. Overview

            13.2.10.2. Product Portfolio

            13.2.10.3. Profitability by Market Segments (Product/Channel/Region)

            13.2.10.4. Sales Footprint

            13.2.10.5. Strategy Overview

        13.2.11. Puratos Group

            13.2.11.1. Overview

            13.2.11.2. Product Portfolio

            13.2.11.3. Profitability by Market Segments (Product/Channel/Region)

            13.2.11.4. Sales Footprint

            13.2.11.5. Strategy Overview

        13.2.12. Sinar Meadow

            13.2.12.1. Overview

            13.2.12.2. Product Portfolio

            13.2.12.3. Profitability by Market Segments (Product/Channel/Region)

            13.2.12.4. Sales Footprint

            13.2.12.5. Strategy Overview

        13.2.13. Wilmar International Limited

            13.2.13.1. Overview

            13.2.13.2. Product Portfolio

            13.2.13.3. Profitability by Market Segments (Product/Channel/Region)

            13.2.13.4. Sales Footprint

            13.2.13.5. Strategy Overview

        13.2.14. Others (Available on Request)

            13.2.14.1. Overview

            13.2.14.2. Product Portfolio

            13.2.14.3. Profitability by Market Segments (Product/Channel/Region)

            13.2.14.4. Sales Footprint

            13.2.14.5. Strategy Overview

14. Assumptions and Acronyms Used

15. Research Methodology

Research Methodology Framework for Market Research Excellence

At Persistence Market Research, we implement a comprehensive, validated, and multi-dimensional approachto market analysis that delivers actionable insights across complex market landscapes. Our methodology combines the analytical rigor of leading consulting firms with innovative research techniques, ensuring robust market assessments that guide strategic decision-making with confidence.

Core Research Philosophy

Our methodology is built on four foundational pillars:

Research Philosophy Image

At Persistence Market Research, our methodology is designed to transcend conventional market studies by combining analytical rigor, multi-source validation, and future-focused insights.

We integrate advanced research frameworks, robust data collection strategies, cutting-edge analytics, and innovative technologies to deliver a 360-degree view of complex markets.

We integrate advanced research frameworks, robust data collection strategies, cutting-edge analytics, and innovative technologies to deliver a 360-degree view of complex markets.

Each stage spanning from strategic scoping and hypothesis-building to competitive intelligence, quality validation, and actionable recommendations is engineered to provide clients with unmatched clarity, precision, and confidence in decision-making.

By embedding innovation and technology at the core, our approach ensures that insights are not only comprehensive but also predictive, empowering businesses to seize opportunities, mitigate risks, and achieve sustainable growth

Research Philosophy Image

Capturing Key Information and Events

During this phase, key research objectives focus on essential information and data points for assessing the market, including:

Research Philosophy Image

TAM-SAM-SOM Framework Implementation

We employ both top-down and bottom-up approaches to ensure accurate market sizing.

Top-Down Market SizingBottom-Up Market Sizing
Universe Definition: Total global/regional market identificationUnit Economics: Average transaction values, purchase frequencies, customer lifecycle
Segmentation Filters: Geographic, demographic, and behavioral constraintsCustomer Segmentation: Detailed buyer persona development and sizing
Market Share Analysis: Competitive landscape assessment and share allocationPenetration Analysis: Market penetration rates by segment and geography
Growth Rate Application: Historical trends and forward-looking growth assumptionsScaling Methodology: Extrapolation techniques with confidence intervals

Validation & Cross-Verification

  • Triangulation: Comparing top-down and bottom-up results for consistency
  • Sensitivity Analysis: Testing key assumptions and parameter variations
  • Peer Benchmarking: Comparison with analogous markets and industry benchmarks
  • Expert Review: External validation through industry specialist consultation

Research Philosophy Image

Forecasting & Projection Modeling

Our proprietary forecasting models incorporate multiple variables and scenarios.

Forecasting Components

  • Historical Trend Analysis: 10-year historical growth patterns and cyclical variations
  • Driver-Based Modeling: Economic indicators, demographic shifts, technology adoption
  • Scenario Planning: Base case, optimistic, and conservative projections
  • Monte Carlo Simulations: Probability-weighted outcomes and risk assessments

Model Validation

  • Back-Testing: Historical accuracy assessment over 3–5-year periods
  • Cross-Validation: Multiple modeling approaches for result comparison
  • External Benchmarking: Comparison with established market forecasts
  • Continuous Calibration: Quarterly model updates based on new data

Comprehensive Data Collection Strategy

Our secondary research phase establishes a robust knowledge base utilizing diverse, credible sources.

Secondary Data Sourcess

  • Industry Publications & Reports
  • Government & Regulatory Data
  • Financial Intelligence (filings & reports)
  • Academic Research & Digital Intelligence

Quality Assurance Protocol

  • Source credibility assessment and publication date validation
  • Data consistency checks across multiple sources
  • Bias identification and neutralization techniques
  • Information gap tracking for primary research prioritization

Research Philosophy Image

Primary Research Excellence

Our primary research methodology employs best-in-class techniques to capture unique market insights.

Quantitative Research Methods

  • Large-Scale Surveys: Statistically representative samples with 95% confidence intervals
  • Survey Methodology: Multi-channel deployment (online, telephone, in-person)
  • Question Architecture and Response Optimization

Qualitative Research Methods

  • Executive Interviews
  • Focus Groups
  • Expert Consultations

Quality Assurance & Validation Framework

Multi-Stage Validation Process

  • Source Verification and Consistency Testing
  • Outlier Detection and Bias Assessment
  • Peer Review Process and External Validation
  • Sensitivity Analysis and Confidence Intervals

Research Philosophy Image

Methodology Validation & Credibility

Our research methodology has been extensively validated through:

  • Academic Partnerships: Collaborations with top-tier business schools and research institutions
  • Client Success Stories: Documented case studies demonstrating research impact and ROI
  • Continuous Benchmarking: Performance comparison with leading global research firms

This comprehensive methodology framework positions Persistence Market Research at the forefront of market intelligence, combining the analytical sophistication of top-tier consulting firms with innovative research techniques. Our approach ensures that every market assessment delivers precise, actionable, and strategically valuable insights that drive business success in competitive market environments.

Ready to unlock your market potential? Contact our research experts to discuss how our validated methodology can transform your strategic decision-making with data-driven market intelligence.

Copyright © 2026 Persistence Market Research. All Rights Reserved

Connect With Us -