


- Marine
- Marine Buoys Market
Marine Buoys Market Size, Share, and Growth Forecast, 2025 - 2032
Marine Buoys Market By Product Type (Anchor Buoys, Drift Buoys, Mooring Buoys, Others), Material (Steel, Plastic, Foam, Others), Application (Offshore Oil & Gas, Marine Research, Ports/Harbors, Others), and Regional Analysis for 2025 - 2032
Marine Buoys Market Share and Trends Analysis
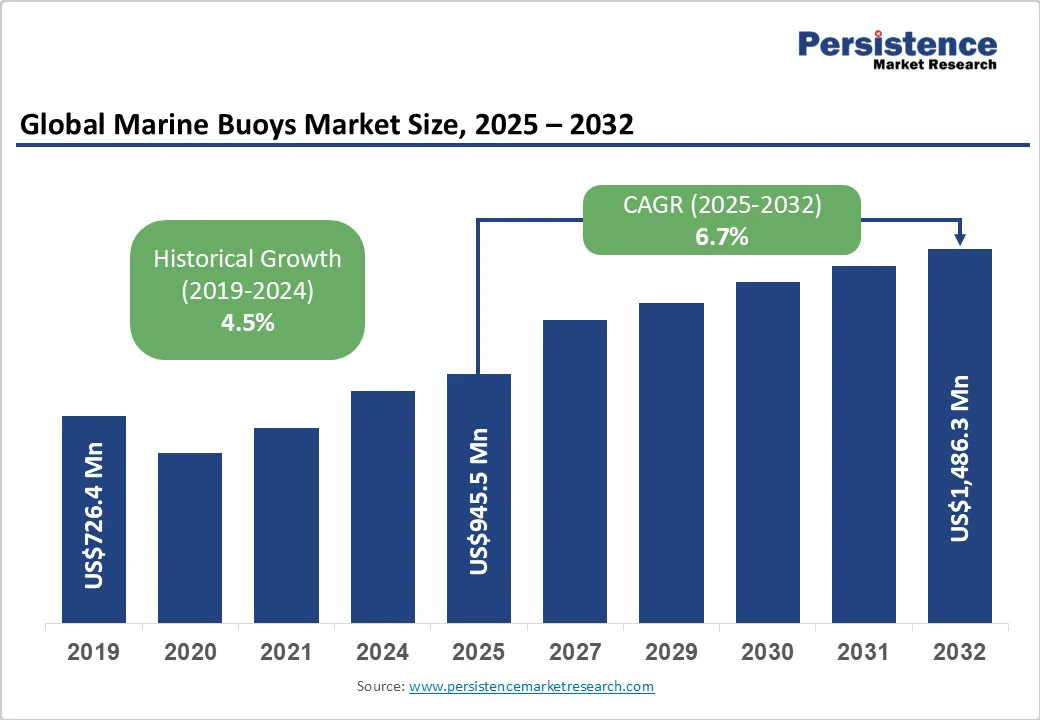
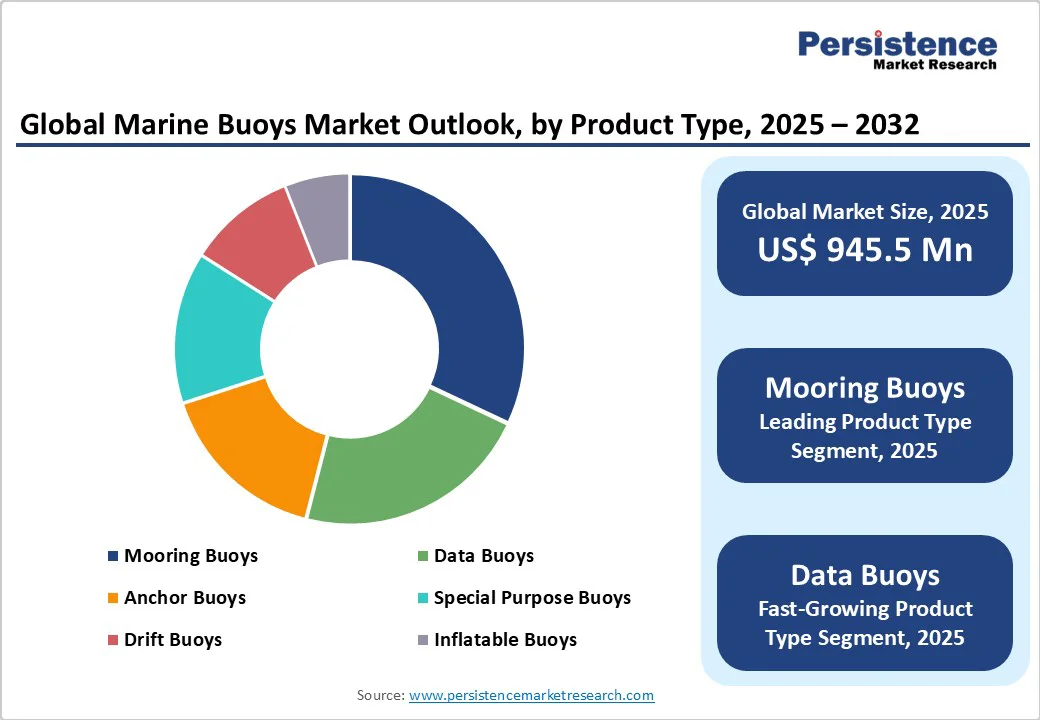
The global marine buoys market size is likely to be valued at US$945.5 Million in 2025, and is estimated to reach US$1,486.3 Million by 2032, growing at a CAGR of 6.7% during the forecast period from 2025 to 2032, driven by expanding offshore energy infrastructure, rising investments in environmental monitoring technologies, and stringent maritime safety regulations.
The increased deployment of connected data buoys for climate and oceanographic research, coupled with the adoption of durable composite materials, is transforming the competitive landscape and accelerating market growth. Trends in regulatory compliance and rapid technological innovation increasingly inform business decisions regarding market entry and expansion.
Key Industry Highlights
- Leading Product Type: Mooring buoys are estimated to account for about 32% of the total market value in 2025, due to their central role in stabilizing offshore platforms and supporting navigational safety.
- Fastest-growing Product Type: Data buoys are projected to be the fastest-growing segment from 2025 to 2032, owing to their indispensable role in gathering real-time environmental intelligence.
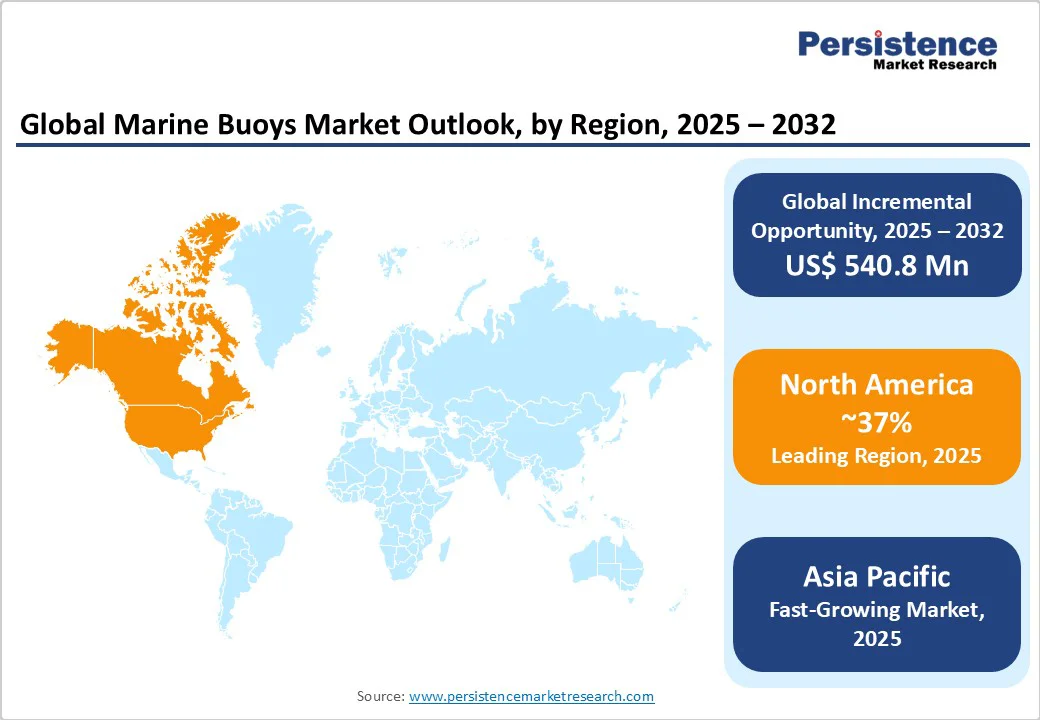
- Largest & Fastest-growing Regions: North America is expected to retain the largest regional market share of around 37% in 2025, while Asia Pacific is slated to register the highest CAGR during 2025-2032.
- Strategic Initiatives: Partnerships, technology innovation, and regional M&A transactions are reshaping competitive positioning across all segments.
- Market Trends: Market participants are shifting toward lifecycle service models and data-driven product development, driven by increasing investments in maritime digitization and regulatory compliance initiatives.
- January 2025: India and the U.S. agreed to jointly manufacture sonobuoys for the Indian Navy, thereby enhancing maritime surveillance and anti-submarine warfare capabilities and bolstering India’s efforts to indigenize maritime defense technology.
| Key Insights | Details |
|---|---|
|
Marine Buoys Market Size (2025E) |
US$945.5 Mn |
|
Market Value Forecast (2032F) |
US$1,486.3 Mn |
|
Projected Growth (CAGR 2025 to 2032) |
6.7% |
|
Historical Market Growth (CAGR 2019 to 2024) |
4.5% |
Market Factors - Growth, Barriers, and Opportunity Analysis
Widening Deployment of Offshore Wind Projects
Accelerating investments in offshore wind and wave energy projects are sharply increasing the demand for advanced mooring and data buoys. The global installed offshore wind capacity is projected to surpass 130 GW by 2030, driven primarily by Europe and China, resulting in sustained demand for precision navigation, safety marking, and operational monitoring buoys. Regulatory mandates by agencies such as the International Maritime Organization (IMO) and national governments are enforcing stricter site marking and monitoring conditions.
In the U.S., the Bureau of Ocean Energy Management (BOEM) is setting higher standards for site monitoring, driving adoption of sensor-integrated buoys to track environmental and navigational parameters. This trend is estimated to generate incremental buoy demand exceeding 15,000 units from 2025 to 2032. The market growth is also gaining traction from advancements in IoT, satellite connectivity, and multi-sensor integration. Smart buoys, capable of real-time data transmission and machine learning-based analysis, are transforming marine scientific research and regulatory compliance. Organizations such as NOAA and the European Marine Observation and Data Network (EMODnet) are deploying thousands of smart buoys for collecting oceanographic, meteorological, and pollution data.
Complex Integration Challenges with Legacy Systems
Several end-users, particularly in the governmental and port authority sectors, face challenges in integrating advanced marine buoy systems with existing legacy maritime infrastructure. This challenge is particularly pronounced in older ports and offshore sites where established equipment lacks compatibility with IoT or autonomous buoy technologies. Integration delays and system interoperability issues can extend project timelines by up to 12 months, adversely affecting operational efficiency and return on investment. These complexities require manufacturers to invest in customizable interface solutions, which increases cost structures and slows market penetration in mature markets.
Market expansion is being restricted due to supply chain vulnerabilities, especially with key raw materials such as specialized polymers and electronic components sourced from limited global suppliers. Recent disruptions related to geopolitical tensions and logistics bottlenecks have extended lead times and increased production costs, resulting in delayed deliveries. Furthermore, fluctuations in commodity prices, particularly for composite resins, pose financial risks to manufacturers, which may dampen capacity expansion plans.
Customization and Modularization Trends in Buoy Design
Increasing customer demand for buoy systems tailored to specific environmental, regulatory, and operational conditions is driving opportunities within modular and customizable buoy designs. The shift away from standardized products to configurable platforms enables clients to select sensors, power sources, and communication modules tailored to their mission-critical needs. This trend is projected to unlock a US$220 million market niche between 2025 and 2032, particularly among defense, aquaculture, and scientific research customers who require bespoke measurement and tracking features. Manufacturers investing in scalable production models and open-architecture designs are uniquely positioned to capitalize on this segment’s growth while enhancing customer retention through retrofit and upgrade services.
The broader global push toward sustainable blue economy development is catalyzing buoy deployment across various sectors, including marine transportation, fisheries, offshore energy, and environmental conservation. Multinational frameworks, such as the UN’s Decade of Ocean Science for Sustainable Development (2021-2030), are incentivizing countries to adopt technologies that enhance maritime safety and resource management. This policy framework amplifies public funding for buoy installations, estimated to reach US$250 million by 2032 in emerging economies. Companies that align their product development with blue economy goals, including the use of eco-friendly materials and low-impact designs, are likely to benefit from preferential procurement policies, international grants, and cross-sector collaboration opportunities.
Category-wise Analysis
Product Type Insights
Mooring buoys are poised to maintain their dominance in the market, commanding an estimated 32% revenue share in 2025. Their critical role in stabilizing offshore platforms and supporting navigational safety underpins their market leadership. This dominance is fueled by the rapid expansion of offshore wind farms and deep-water drilling activities worldwide, particularly in regions such as the North Sea, the Gulf of Mexico, and the Asia Pacific.
Mooring buoys provide reliable anchorage in these energy-intensive sectors, ensuring operational stability amid challenging marine conditions. The increasing shift toward floating offshore wind turbines and floating production, storage, and offloading (FPSO) units is driving demand for advanced mooring solutions that optimize energy extraction and enhance safety standards.
Data buoys are experiencing rapid growth, projected to be the fastest-growing application segment, driven by their indispensable role in real-time environmental intelligence, including climate monitoring, oceanographic research, and port security applications. Significant investment in sensor fusion technologies, satellite connectivity, and AI-driven data analytics is accelerating the adoption of data buoys. Governments, research institutions, and maritime authorities increasingly leverage these smart buoy systems to gather precise environmental data, enabling predictive analytics and informed decision-making. Moreover, growing concerns about climate change and marine pollution are leading to the expansion of buoy deployments for comprehensive ecosystem monitoring.
Material Insights
Plastic buoys are projected to command a leading 41% of the revenue share in 2025, owing to their cost-effectiveness, durability, and adaptability across diverse marine environments. Their broad acceptance is reinforced by material properties such as corrosion resistance and relatively low maintenance requirements, making them particularly suitable for a wide range of applications, from navigation aids in coastal waters to anchoring buoys in varied climatic zones. Plastic marine buoys remain dominant due to their compatibility with a wide range of sensors and IoT systems, enabling real-time monitoring and efficient operations across various shipping, aquaculture, and environmental applications.
Buoys made from composite materials are emerging as the fastest-growing segment, driven by their superior performance in premium marine settings where extended service life, lightweight construction, and resilience under harsh sea conditions are crucial. Advanced composite materials, including fiberglass reinforced polymers, bio-based composites, and recycled fiber blends, are gaining traction, addressing both technical and environmental imperatives. The increasing adoption of composites aligns with tightening regulations aimed at reducing ecological footprints and marine pollution associated with traditional buoy materials. Manufacturers incorporating circular economy principles and sustainability-focused innovations into composite buoy production are expected to achieve competitive differentiation and regulatory favor.
Application Insights
The offshore oil & gas sector is currently the largest application segment in the market, holding an estimated 26% revenue share in 2025. This leadership stems from the stringent operational safety and environmental regulations in the sector, which enforce high standards for buoy deployment to ensure incident prevention and regulatory compliance. Continuous exploration activities and infrastructure expansion in deepwater basins worldwide, especially in regions such as the Gulf of Mexico, North Sea, and offshore Asia Pacific, contribute significantly to this demand. Offshore installations need resilient, sensor-equipped buoys for real-time spill detection and navigational safety in harsh marine conditions.
The environmental monitoring segment is identified as the fastest-growing application, driven by the heightened global focus on climate change, marine ecosystem health, and pollution surveillance, catalyzed by governments, NGOs, and international organizations such as the NOAA and the United Nations Environment Programme (UNEP). The deployment of buoy-based sensor networks for oceanographic data collection is expanding rapidly, supporting vital research on sea-level rise, water quality, and biodiversity conservation. These buoys provide continuous data streams that inform policy decisions, coastal management strategies, and disaster preparedness plans.
Regional Market Insights
North America Marine Buoys Market Trends
North America is projected to command a substantial 37% of the market share in 2025, solidifying its position as a dominant regional player. This leadership stems primarily from the U.S., where sophisticated maritime infrastructure and a rigorous regulatory framework are feeding the demand for advanced buoy systems. Federal agencies such as the National Oceanic and Atmospheric Administration (NOAA) continue to expand extensive ocean observation programs, enhancing the need for deployed buoys that support weather forecasting, environmental monitoring, and navigational safety.
The U.S. Coast Guard enforces strict navigational safety mandates, further stimulating the deployment of compliant and technologically advanced buoys across coastal and offshore areas. The growth trajectory of the market here is shaped by promising investments in offshore wind energy projects, the modernization of smart ports with autonomous vessel traffic management systems, and strong innovation ecosystems. Competition is intense, characterized by both domestic and global manufacturers vigorously pursuing federal and commercial contracts. This competitive environment necessitates that companies deliver highly flexible, compliance-ready buoy solutions tailored to the diverse regulatory requirements and operational complexities of North America’s maritime landscape.
Asia Pacific Marine Buoys Market Trends
Asia Pacific is set to stand out as the fastest-growing market for marine buoys, capturing 22% of the global market share in 2025. This robust growth is fueled by rapid industrialization, urban coastal infrastructure expansion, and government-driven oceanic resource monitoring initiatives. China leads this surge with its substantial manufacturing capabilities and expansive oceanographic research programs, while Japan's leadership in product innovation ensures the highest quality standards. India and ASEAN countries are witnessing accelerated growth in aquaculture and maritime port development, generating diverse buoy demand across applications.
The high growth of the regional market results from conducive policies supporting sustainable fisheries, climate resilience, and maritime security. The market here is fragmented with active participation from numerous local buoy fabricators and emerging technology startups, encouraging strategic partnerships and investments by global firms aiming to capitalize on regional opportunities. Companies operating here must navigate a complex regulatory landscape and provide cost-effective, technically reliable buoy solutions tailored to the multifaceted regional maritime needs.
Europe Marine Buoys Market Trends
Europe is anticipated to hold approximately 29% of the market share in 2025, with Germany, the U.K., France, and Spain headlining in terms of contribution. The region exemplifies regulatory harmonization through EU maritime safety and environmental protection directives, which create a stable and coordinated market growth environment. Investments in offshore wind development, particularly in the North Sea and the Mediterranean, are being bolstered by public-private partnerships (PPPs) that promote digital navigation and environmental monitoring.
The Europe market is marked by collaborations between traditional marine equipment manufacturers and advanced sensor technology developers, enabling integrated buoy systems that offer enhanced functionality and compliance. The availability of EU funding accelerates pilot projects and helps scale innovative solutions, providing new entry points for companies focusing on cutting-edge marine buoy technologies.
Competitive Landscape
The global marine buoys market structure is moderately consolidated, with the top five players estimated to hold over 45% of market revenue in 2025. Market leaders distinguish themselves by offering diversified portfolios, robust compliance credentials, and technological innovation capacity, particularly in smart data and composite buoy segments. The remainder of the market is highly fragmented, featuring regional specialists and niche manufacturers focusing on customized product lines and localized regulatory expertise.
Competitive intensity is defined by innovation cycles, government procurement strategies, and brand reputation rather than solely on price competitiveness. The landscape is witnessing a shift toward strategic partnerships in IoT and environmental sustainability, as companies respond to evolving customer preferences and compliance obligations.
Key Industry Developments
- In October 2025, the Marine Institute installed a data buoy at Lough Furnace, Ireland, to monitor water temperature, salinity, and oxygen levels, enhancing climate research and supporting ecosystem analysis, conservation strategies, and informed policymaking in vulnerable coastal regions.
- In June 2025, Germany began replacing old weather ships with advanced monitoring buoys equipped with real-time sensors, enhancing ocean data accuracy and reducing costs. This shift supports Germany’s focus on innovation, maritime safety, and climate monitoring with lower environmental impact.
- In June 2025, China deployed a high-tech buoy in the South China Sea for synchronized ocean-atmosphere monitoring. Powered by hybrid energy, it withstands extreme conditions and features quantum LiDAR and radiometers, beginning a one-year commissioning phase at 3,500-meter depth.
Marine Buoys Market Trends
| Report Attribute | Details |
|---|---|
|
Historical Data/Actuals |
2019 - 2024 |
|
Forecast Period |
2025 - 2032 |
|
Market Analysis |
Value: US$ Mn |
|
Geographical Coverage |
|
|
Segmental Coverage |
|
|
Competitive Analysis |
|
|
Report Highlights |
|
Companies Covered in Marine Buoys Market
- KONGSBERG Maritime AS
- Fendercare Marine Solutions Ltd.
- Tideland Signal, Inc.
- Marine Technologies LLC
- Saab AB (Seaeye Marine Division)
- Sealite Pty Ltd
- Blue Ocean Buoys Ltd
- Mediterranean Mooring Systems SRL
- Siemens Marine GmbH
- Hydrosphere U.K. Ltd
- IMECO Marine Group Inc.
- Pacific Material Handling Solutions, Inc.
- Marine Instruments S.A.
- Mobilis SA
- Portsafe Technologies Inc.
Frequently Asked Questions
The marine buoys market is projected to reach US$945.5 Million in 2025.
Expanding offshore energy infrastructure, rising investments in environmental monitoring technologies, and stringent maritime safety regulations are driving the marine buoys market.
The marine buoys market is poised to witness a CAGR of 6.7% from 2025 to 2032.
Increased deployment of connected data buoys for climate and oceanographic research and the adoption of durable composite materials are key market opportunities.
KONGSBERG Maritime AS, Fendercare Marine Solutions Ltd., and Tideland Signal, Inc. are some of the key players in the marine buoys market.


