


- Bulk Chemicals
- Marine Biofuels Market
Marine Biofuels Market Size, Share, and Growth Forecast 2026 - 2033
Marine Biofuels Market by Fuel Type (FAME/Biodiesel, HVO (Renewable Diesel), Ethanol, Biomethanol, BioLNG, Others), Feedstock (Sugarcane, Corn, Vegetable Oil, Castor Oil, Biomass, Others), Form (Liquid, Gas), Vessel Type (Passenger, Cargo, Military, Others), and Regional Analysis, 2026 - 2033
Marine Biofuels Market Size and Trend Analysis
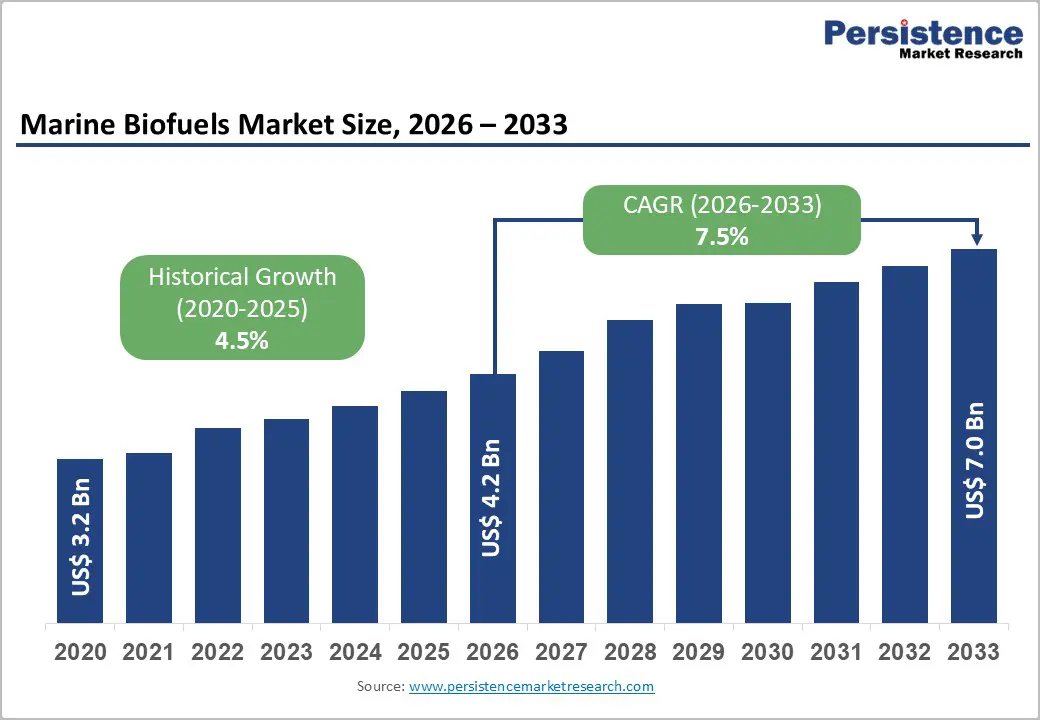
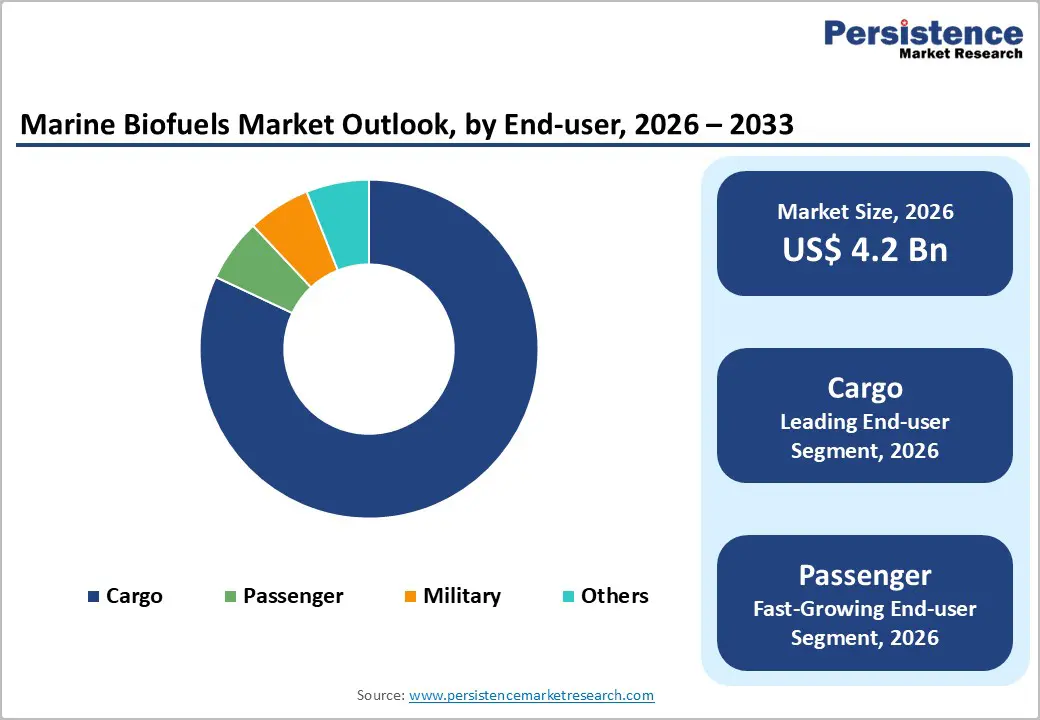
The global marine biofuels market size is valued at US$ 4.2 billion in 2026 and is projected to reach US$ 7.0 billion by 2033, growing at a CAGR of 7.5% between 2026 and 2033.
This substantial growth is primarily driven by stringent IMO 2030 decarbonization targets, increasing adoption of sustainable maritime fuel alternatives, and mandatory GHG emission reduction requirements for global shipping operations. The maritime industry’s urgent transition from fossil fuels to renewable alternatives accelerates market expansion across commercial cargo, passenger vessels, and military applications.
Key Industry Highlights
- Europe dominates globally with 34% market share in 2026, driven by comprehensive FuelEU Maritime regulations, established production infrastructure, and aggressive decarbonization targets across major shipping nations.
- Asia Pacific emerges as fastest-growing region with 8.3% CAGR (2026 - 2033), supported by rapid maritime trade expansion, manufacturing advantages, and supportive government policies across China, Japan, and ASEAN nations.
- FAME/Biodiesel leads fuel types with 36% market share, offering proven compatibility with existing marine engines, established production pathways, and comprehensive regulatory approvals.
- HVO Renewable Diesel represents fastest-growing segment with 8.1% CAGR (2026 - 2033), driven by superior fuel properties, infrastructure compatibility, and expanding production capacity by major energy companies.
- IMO Net-Zero Framework creates key market opportunity as mandatory 20-30% emission reductions by 2030 and 70-80% by 2040 drive unprecedented demand for sustainable marine fuel alternatives.
| Key Insights | Details |
|---|---|
| Marine Biofuels Market Size (2026E) | US$ 4.2 Billion |
| Market Value Forecast (2033F) | US$ 7.0 Billion |
| Projected Growth CAGR (2026 - 2033) | 7.5% |
| Historical Market Growth (2020 - 2025) | 4.5% |
Market Dynamics
Market Growth Drivers
IMO Net-Zero Framework and Regulatory Compliance Requirements
The International Maritime Organization’s Net-Zero Framework approved in April 2026 establishes the world’s first legally binding regulations for shipping decarbonization, creating unprecedented demand for marine biofuels. The framework mandates 20-30% emission reductions by 2030, 70-80% by 2040, and net-zero emissions by 2050 compared to 2008 baseline levels. The Global Fuel Standard (GFS) requires successive reductions in GHG intensity of shipping fuels starting in 2028, affecting over 30,000 large ocean-going vessels consuming more than 200 million tonnes of fuel annually. Regional regulations including FuelEU Maritime effective 2026 mandate gradual emission reductions from ships operating in European ports, while the UK Government’s net-zero shipping strategy by 2050 includes domestic maritime fuel regulations. These comprehensive regulatory frameworks ensure sustained demand growth for Advanced Biofuels Market solutions.
Expanding Maritime Industry Adoption and Infrastructure Development
Leading shipping companies demonstrate accelerating biofuel adoption with Maersk transporting 3% of containers using green fuels in 2023, equivalent to 660,000 TEU and saving over 683,000 tonnes of greenhouse gas emissions. GoodFuels pioneered sustainable marine biofuels since 2015, achieving 80-90% CO2 reduction versus fossil fuel equivalents through 100% waste or residue-based formulations. Major oil companies expand biofuel infrastructure with ExxonMobil completing successful sea trials of marine bio fuel oil providing up to 40% CO2 emission reduction. The Marine Vessel Market demonstrates increasing compatibility with biofuel systems as Maersk orders 25 methanol-enabled vessels including six 9,000 TEU dual-fuel ships for delivery in 2026-2027. Infrastructure expansion across key bunkering hubs in Europe and Asia Pacific creates comprehensive supply networks supporting widespread biofuel adoption.
Market Restraints
Limited Sustainable Feedstock Availability and Production Scalability
The marine biofuels industry faces significant constraints from limited sustainable feedstock supplies, particularly for advanced biofuels that avoid food-versus-fuel conflicts. Used cooking oil (UCO) and waste oils represent preferred feedstocks but have finite availability globally, creating supply bottlenecks for scaled production. Transport & Environment warns that without proper safeguards, IMO regulations could incentivize unsustainable palm and soy oil biofuels that are two to three times worse for climate than traditional shipping fuels when deforestation impacts are considered. Shipping companies including Hapag-Lloyd actively call for excluding crop-based biofuels from green alternatives, highlighting industry concerns about sustainability certification and land-use impacts.
High Production Costs and Price Volatility
Marine biofuels face substantial cost premiums compared to conventional marine fuels, creating economic barriers for widespread adoption. First-generation biofuels from vegetable oils and corn typically compete with fossil fuels only at oil prices above $80-100 per barrel, while advanced biofuels command significantly higher premiums. Production cost volatility stems from feedstock price fluctuations, complex processing requirements, and limited economies of scale in current production facilities. The maritime industry’s price-sensitive nature requires cost-competitive alternatives to achieve mass adoption beyond regulatory compliance scenarios.
Market Opportunities
HVO Renewable Diesel Market Expansion and Advanced Production Technologies
Hydrotreated Vegetable Oil (HVO) emerges as the fastest-growing segment with 8.1% CAGR from 2026-2033, driven by superior fuel properties and infrastructure compatibility. HVO demonstrates fungible diesel characteristics enabling B100 equivalents without cold-flow problems, while offering higher energy density and improved storage stability compared to FAME biodiesel. Major energy companies leverage existing hydrotreater infrastructure to produce HVO, sustainable aviation fuel (SAF), and naphtha streams simultaneously, improving plant economics and investment returns. Neste Corporation leads global HVO capacity expansion with proven production technologies, while BP and TotalEnergies invest in advanced biorefinery facilities. The segment benefits from 12.2% CAGR capacity growth as oil majors convert existing refineries for flexible biofuel production meeting multiple transportation fuel markets.
Asia Pacific Market Leadership and Manufacturing Advantages
Asia Pacific represents the highest growth potential with 8.3% CAGR between 2026-2033, driven by rapidly expanding maritime trade, manufacturing advantages, and supportive government policies. China, Japan, India, and ASEAN nations demonstrate robust shipping industry growth requiring substantial biofuel volumes to meet international emission standards. Regional governments implement aggressive renewable energy mandates and biofuel blending requirements supporting market development. South Korea leads regional growth expectations through strategic biofuel production investments and Marine Propulsion Engine Market innovations. Singapore’s position as a major bunkering hub facilitates biofuel distribution infrastructure, while Japan emphasizes technological innovation and quality standards requiring premium biofuel formulations for domestic and export applications.
Category-wise Analysis
Fuel Type Insights
FAME/Biodiesel dominates the marine biofuels market with approximately 36% market share in 2026, establishing itself as the leading segment due to proven compatibility with existing marine engine infrastructure and established production pathways. Fatty Acid Methyl Ester (FAME) biodiesel offers seamless integration with conventional diesel engines without requiring major modifications, facilitating smooth transition to cleaner fuels across diverse vessel types. The segment benefits from widespread availability of production facilities, established supply chains, and comprehensive regulatory approvals from IMO and regional maritime authorities. FAME biodiesel demonstrates reduced sulfur content and lower greenhouse gas emissions aligning with environmental sustainability goals, while government incentives and industry investments in biodiesel R&D further support market leadership. The Advanced Biofuels Market ecosystem recognizes FAME as a proven decarbonization solution enabling immediate emission reductions for shipping operators seeking regulatory compliance.
Feedstock Insights
Vegetable Oil maintains dominant feedstock position with approximately 27% share in 2026, reflecting its established supply chains, processing infrastructure, and proven compatibility with marine biofuel production technologies. Rapeseed oil represents the predominant biodiesel feedstock globally, though its European market share decreased from 62.3% in 2012 to 37.9% in 2020 due to increasing adoption of waste oils and alternative feedstocks. Used cooking oil (UCO) emerges as the second-most important feedstock since 2015, providing sustainable raw material without competing with food production systems. Soybean oil contributes 71.7% of US biodiesel feedstock in 2020, while other vegetable oils including canola (10.7%), corn oil (13.0%), and palm oil serve regional production requirements. The feedstock diversity ensures supply security and reduces dependency on single raw material sources within the broader Marine Vessel Market fuel transition strategies.
Form Insights
Liquid biofuels dominate with approximately 92% market share in 2026, driven by compatibility with existing marine fuel systems, established bunkering infrastructure, and proven operational performance across diverse vessel applications. Modern refining technologies enable production of liquid biofuels including hydrotreated vegetable oil, FAME, and bio-methanol that satisfy strict maritime fuel specifications and quality requirements. Liquid biofuels benefit from regulatory support including IMO 2020 sulfur regulations and decarbonization mandates that favor cleaner alternatives to traditional marine fuels. The segment’s dominance stems from seamless integration with current marine engines, established distribution networks, and compatibility with existing fuel storage and handling systems. Liquid form biofuels offer superior energy density, storage stability, and operational flexibility compared to gaseous alternatives, supporting widespread adoption across the Marine Propulsion Engine Market ecosystem.
Vessel Type Insights
Cargo vessels represent the leading vessel type with approximately 80% of total marine biofuel demand in 2026, driven by large-scale fuel consumption, international trading routes, and stringent emission regulations for commercial shipping operations. Container ships, bulk carriers, and tankers consume substantial fuel volumes during long-haul voyages, creating significant decarbonization opportunities through biofuel adoption. Maersk demonstrates cargo vessel leadership by transporting 660,000 TEU using green fuels in 2023, while ordering 25 methanol-enabled vessels including large 16,000 TEU container ships for sustainable operations. The segment benefits from predictable fuel consumption patterns, established supply chains, and commercial incentives for emission reductions driven by customer sustainability requirements. Cargo vessels operating on international routes face IMO regulations requiring progressive emission reductions, ensuring sustained demand for marine biofuel solutions throughout the forecast period within the expanding Marine Vessel Market transformation.
Regional Insights
North America Marine Biofuels Trends
North America demonstrates strong regulatory leadership through the US Environmental Protection Agency’s Renewable Fuel Standard (RFS) program requiring specific biofuel volumes across transportation sectors. The RFS establishes annual volume targets including biomass-based diesel requirements of 2.82 billion gallons for 2023, 3.04 billion gallons for 2025, and 3.35 billion gallons for 2026, creating substantial demand for marine-compatible biofuels. The US Navy pioneered military marine biofuel applications through comprehensive testing programs and fleet deployment initiatives supporting both energy security and emission reduction objectives.
Innovation ecosystems across United States and Canada drive technological advancement through partnerships between research institutions, biofuel producers, and shipping companies. Renewable Energy Group Inc. expanded production capacity through strategic acquisitions while developing advanced biodiesel refineries capable of 20-million-gallon nameplate capacity. Regional infrastructure development includes biofuel terminal expansions at major ports and bunkering facilities supporting commercial shipping operations. The Marine Propulsion Engine Market benefits from OEM collaborations developing engines optimized for high-blend biofuel operations.
Europe Marine Biofuels Market Trends
Europe maintains the largest regional market with 34% share in 2026, supported by comprehensive regulatory frameworks, established production infrastructure, and aggressive decarbonization targets. The European Union’s FuelEU Maritime regulation effective 2026 mandates gradual emission reductions from ships operating in European ports, creating sustained demand for sustainable marine fuels. Germany, United Kingdom, France, and Spain lead regional consumption through extensive merchant fleets, advanced refinery capabilities, and supportive government policies promoting renewable energy adoption.
UK Government’s net-zero shipping strategy by 2050 includes domestic maritime fuel regulations and emissions pricing through expanded UK Emissions Trading Scheme (ETS) covering domestic maritime voyages from 2026. European biofuel production is projected to reach 45 billion by 2033 at 5.8% CAGR. Neste Corporation leads HVO production capacity while UPM-Kymmene Oyj and Preem AB expand advanced biofuel facilities. Regional feedstock diversity includes rapeseed oil, used cooking oil, and waste biomass supporting sustainable production without food-versus-fuel conflicts within the Advanced Biofuels Market ecosystem.
Asia Pacific Marine Biofuels Trends
Asia Pacific emerges as the fastest-growing region with 8.3% CAGR between 2026-2033, driven by rapid maritime trade expansion, manufacturing advantages, and supportive government policies across major economies. China represents the largest regional fuel consumer and second globally after the United States, with massive shipbuilding programs and expanding merchant fleet operations requiring substantial biofuel volumes. Japan emphasizes technological innovation and quality standards for premium biofuel formulations supporting both domestic consumption and export applications.
Singapore’s strategic position as a major global bunkering hub facilitates biofuel distribution infrastructure development, while India’s economic growth drives aviation and maritime sector expansion creating emerging biofuel demand. South Korea demonstrates highest expected CAGR growth through strategic biofuel production investments and advanced Marine Propulsion Engine Market technologies. ASEAN nations including Thailand, Malaysia, and Indonesia develop regional biofuel production capabilities leveraging abundant palm oil and biomass feedstock resources. The Asia-Pacific marine biofuel market projects growth from $662.1 million in 2023 to $2.23 billion by 2033, reflecting the region’s central role in global maritime decarbonization initiatives.
Competitive Landscape
The marine biofuels market demonstrates moderate consolidation with established energy companies and specialized biofuel producers maintaining significant market presence through technological expertise, production capacity, and distribution networks. BP plc, Cargill, Neste Oil, Chevron Corporation, and TotalEnergies together account for 45% to 50% market share, leveraging existing refinery infrastructure and global supply chains. Key differentiators include proprietary production technologies, sustainable feedstock sourcing capabilities, and comprehensive regulatory approvals across multiple jurisdictions. GoodFuels pioneered marine biofuel applications since 2015, establishing market leadership through 100% waste-based formulations and strategic partnerships with major shipping companies. Emerging business models focus on integrated supply chain solutions, digital fuel management systems, and carbon credit monetization strategies enhancing customer value propositions.
Key Developments:
- December 2025: ExxonMobil completed successful sea trial of its first marine bio fuel oil with Stena Bulk, demonstrating up to 40% CO2 emission reduction compared to conventional marine fuel, with availability initially in Rotterdam before wider European port network launch.
- September 2025: Maersk expanded ECO Delivery Ocean services with 212 clients opting for green fuel transportation in 2023, achieving 80% greenhouse gas emission reduction on well-to-wake basis through second-generation biodiesel from waste oils.
- June 2026: Neste Corporation announced capacity expansion for HVO production facilities targeting marine fuel applications, leveraging advanced hydrotreatment technologies for superior fuel quality and environmental performance.
Companies Covered in Marine Biofuels Market
- ExxonMobil
- BP plc
- Cargill
- Neste Oil
- Chevron Corporation
- World Energy
- GoodFuels
- Uniper Energy
- Dansuk Industrial
- Cepsa
- Gevo
- TotalEnergies
- UPM
- Emami Group
- Renewable Energy Group Inc.
- Maersk
- Stena Bulk
Frequently Asked Questions
The global marine biofuels market is projected to reach US$ 7.0 billion by 2033, growing from US$ 4.2 billion in 2026 at a CAGR of 7.5% during the forecast period.
Key demand drivers include stringent IMO Net-Zero Framework regulations mandating 20-30% emission reductions by 2030, expanding maritime industry adoption with companies like Maersk achieving significant green fuel usage, and comprehensive regional regulations including FuelEU Maritime effective 2026.
FAME/Biodiesel leads the market with approximately 36% market share in 2026, offering proven compatibility with existing marine engines, established production pathways, and comprehensive regulatory approvals from maritime authorities.
Europe maintains the largest regional market with 34% share in 2026, supported by comprehensive FuelEU Maritime regulations, established production infrastructure, and aggressive decarbonization targets across major shipping nations.
HVO Renewable Diesel presents the most significant growth opportunity as the fastest-growing segment with 8.1% CAGR (2026-2033), driven by superior fuel properties, infrastructure compatibility, and expanding production capacity by major energy companies.
Major market players include BP plc, Cargill, Neste Oil, Chevron Corporation, TotalEnergies, ExxonMobil, GoodFuels, and World Energy, together accounting for 45-50% market share with established global presence and comprehensive product portfolios.


