


- Advanced Materials
- Construction Aggregates Market
Construction Aggregates Market Size, Share, and Growth Forecast for 2026 - 2033
Construction Aggregates Market by Product Type (Crushed Stone Manufactured Sand, Natural Sand, Gravel, Recycled Aggregate, and Others), Application (Commercial, Residential, Industrial, and Infrastructures), and Regional Analysis for 2026 - 2033
Construction Aggregates Market Size and Share Analysis
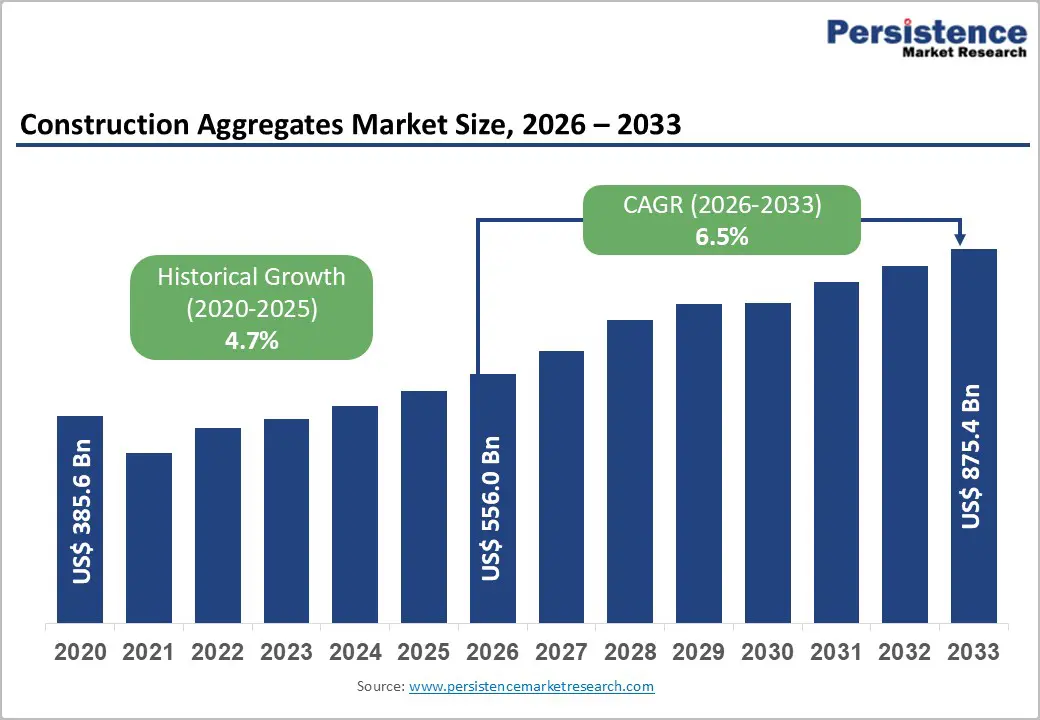
The global construction aggregates market size was valued at US$ 556.0 billion in 2026 and is projected to reach US$ 875.4 billion by 2033, growing at a CAGR of 6.5% between 2026 and 2033.
Robust global infrastructure development, rising urbanization, and consistent demand for construction materials for residential, commercial, and industrial projects are among the prominent factors driving global sales of construction aggregates. Rising government investments in transportation networks, renewable energy infrastructure, and sustainable construction practices further stimulate demand for recycled aggregates and construction chemicals.
Key Industry Highlights:
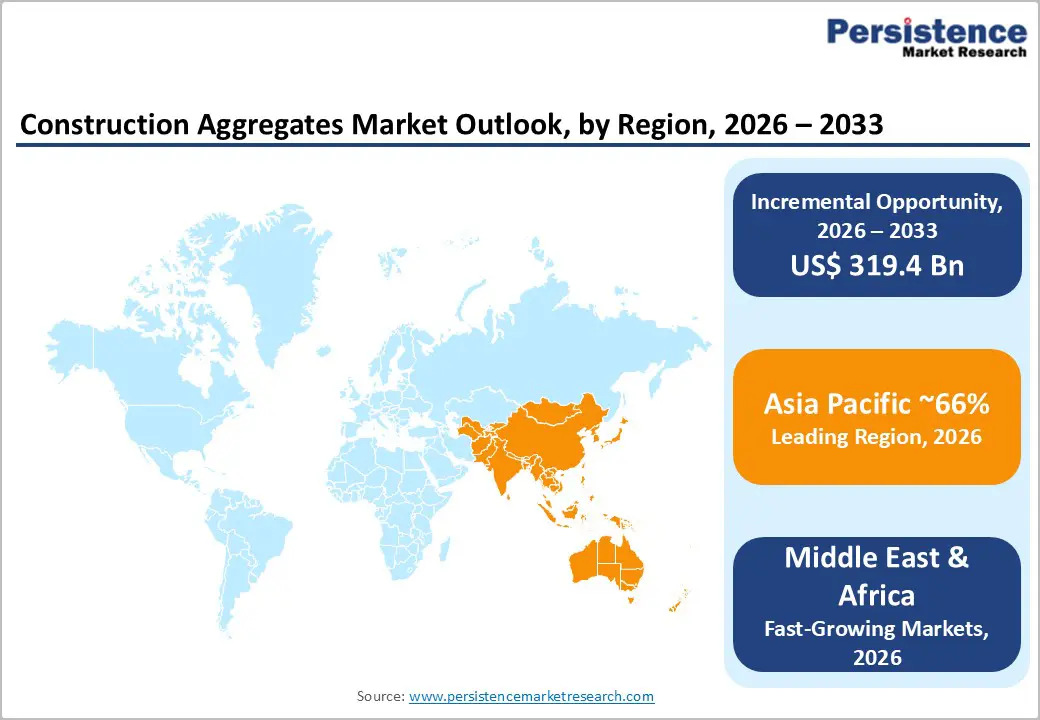
- Leading Region: Asia Pacific commands dominant market position with nearly 60% global market share, driven by rapid industrialization, unprecedented urbanization, and massive infrastructure investment across China, India, and Southeast Asian regions.
- Fastest Growing Region: Middle East & Africa demonstrates highest growth trajectory at approximately 6.8% CAGR, propelled by infrastructure expansion, government diversification strategies, and large-scale construction projects.
- Leading Product Type: Crushed Stone commands largest product type accounting 44% market share, driven by versatility across infrastructure and road construction, superior load-bearing capacity, and consistent global demand across diverse applications.
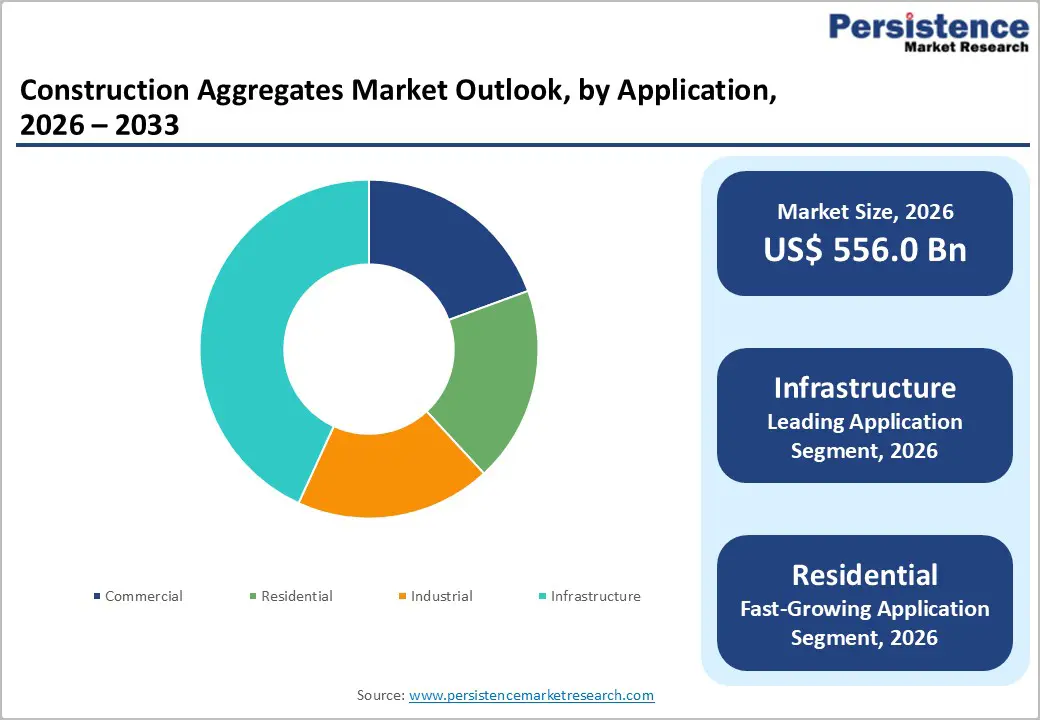
- Leading Applications: Infrastructure stands as the leading application segment, capturing approximately 54% of the total construction aggregates market demand, fueled by large-scale development of transportation networks, bridges, railways, airports, and utility infrastructure that require substantial material volumes for durable and long-lasting construction.
- Growth Indicators: Rising government investments in transportation, urban infrastructure, and smart city projects are major factors driving demand for construction aggregates.
- Opportunity: Increasing adoption of recycled aggregates, driven by stricter environmental regulations, circular economy initiatives, and sustainability certifications, presents a significant opportunity for manufacturers.
| Key Insight | Details |
|---|---|
| Construction Aggregates Market Size (2026E) | US$ 556.0 Bn |
| Projected Market Value (2033F) | US$ 875.4 Bn |
| Global Market Growth Rate (CAGR 2025 to 2033) | 6.5% |
| Historical Market Growth Rate (CAGR 2020 to 2025) | 4.7% |
Markey Dynamics
Drivers - Massive Infrastructure Investments and Urban Growth Propel Global Construction Aggregates Market
Global construction aggregates demand demonstrates exceptional growth momentum driven by unprecedented infrastructure investment and urbanization trends across developed and emerging markets. Global urban population reached 56.2% in 2025, with projections indicating 68% urbanization by 2050 according to international development assessments. Government infrastructure spending exceeded US$ 2 trillion in 2025, supporting massive road network expansion, bridge construction, railway development, and port modernization projects globally.
China's construction aggregate consumption reached nearly 29 billion metric tons in 2025, while India consumed 7.8 billion metric tons, reflecting rapid urbanization supporting new housing, commercial facilities, and infrastructure development. Advanced economies including United States, Germany, and United Kingdom drive demand through infrastructure rehabilitation and renewal projects extending asset lifespan. Consistent material replacement cycles combined with new project development create predictable, multi-year aggregate demand supporting sustained market expansion through 2033.
Global Renewable Energy Expansion Drives Demand for Construction Aggregates
Global renewable energy expansion creates substantial construction aggregate demand through solar farm development, wind turbine installation, hydroelectric facilities, and energy storage infrastructure requiring massive concrete and foundation work. Renewable energy capacity additions exceeded 300 GW annually during 2023-2025, with cumulative investment approaching US$ 1.8 trillion according to international renewable energy assessments.
Hydroelectric projects require extensive concrete work including dam construction and spillway development, consuming millions of tons of crushed stone and sand. Solar panel installation sites demand large concrete foundations and access roads incorporating substantial aggregate volumes. Government renewable energy mandates and corporate sustainability commitments across North America, Europe, and Asia Pacific accelerate green infrastructure development projecting continued aggregate demand expansion supporting energy transition objectives globally.
Restraint - Stringent Environmental Regulations and Supply Constraints Challenge Aggregate Production
Stringent environmental regulations restrict natural aggregate extraction through protected area designations, riverbed mining prohibitions, and sustainability mandates impacting quarry operations. Sand mining depletion rates exceed sustainable replenishment in certain regions, with environmental organizations estimating 40-50 billion tons annual sand consumption exceeding natural regeneration. Transportation bottlenecks, fuel price volatility, and logistics infrastructure limitations create supply disruptions extending project timelines and increasing operational costs. Fuel costs representing 15-20% of aggregate production expenses directly impact profitability during periods of energy price inflation limiting margin expansion for regional producers.
Quality Variability and Processing Challenges Restrain Recycled Aggregate Adoption
Recycled aggregate quality inconsistency stemming from variable feedstock composition, contamination risks, and processing methodology variation limits mainstream adoption for high-strength structural applications. Quality control challenges require sophisticated washing and separation equipment increasing capital investment requirements. Certification gaps and performance uncertainty limit acceptance among specification-driven contractors and engineers. Established market participants resist technology adoption despite environmental benefits due to perceived performance risks and liability concerns.
Opportunity - Smart City Infrastructure and Digital Construction Integration Present Growth Opportunity
Emerging smart city initiatives across Asia Pacific, Europe, and North America create substantial aggregate demand through digitalized infrastructure featuring embedded sensors, autonomous drainage systems, and climate-resilient construction supporting environmental adaptation. Smart infrastructure projects requiring advanced concrete specifications incorporating performance-enhancing aggregates and construction chemicals integration for embedded systems compatibility.
5G network deployment requiring extensive conduit and foundation work generates multi-year aggregate demand across urban centers. Electric vehicle charging infrastructure development demanding substantial concrete and foundation systems creates incremental demand for specialized aggregate formulations. Digitalization enabling real-time supply chain visibility, demand forecasting, and logistics optimization attracts new market entrants and technology-driven service providers addressing efficiency and sustainability requirements.
Marine Dredged Aggregates Offer Significant Growth Opportunity in Coastal and Port Infrastructure
Marine dredged aggregates present substantial market opportunity addressing supply constraints in coastal regions while supporting critical port development. Marine aggregates supply 22% of UK sand and gravel demand, with global marine production expanding through regulated dredging operations. Major ports require approximately 3 billion cubic meters of dredged material over the next 10 years, creating massive aggregate demand.
Marine dredged sand and gravel support coastal defense and beach replenishment exceeding 30 million metric tons globally, addressing climate change impacts and rising sea levels. Advanced dredging technologies incorporating sediment processing and quality screening enable consistent material specifications meeting construction standards.
Environmental regulatory frameworks ensuring sustainable practices create transparent market conditions. Integration with recycled materials positions marine aggregates as environmentally responsible alternative reducing natural quarry pressure while addressing geographic supply constraints in island nations and coastal development zones globally.
Category-wise Analysis
Product Type Insights
Crushed stone dominates the construction aggregates market, commanding approximately 42% market share driven by exceptional versatility across infrastructure, road construction, and concrete production applications. Crushed stone applications including highway base layers, airport runways, and railway ballast leverage superior load-bearing capacity and weathering resistance justifying market leadership.
Global crushed stone production exceeded 25 billion metric tons in 2026, supporting infrastructure networks across developed and emerging markets. Concrete production consuming approximately 75% of total aggregates relies heavily on crushed stone for structural performance and durability optimization. Technology improvements in quarrying efficiency and processing automation enhance supply reliability while reducing environmental impact sustaining competitive positioning through 2033.
Application Insights
Infrastructure applications capture approximately 32% of total construction aggregates market demand through transportation networks, bridges, railways, airports, and utility infrastructure requiring massive material volumes. Government infrastructure investment initiatives totaling trillions of dollars globally support multi-year procurement contracts ensuring consistent demand. Road construction and maintenance consuming approximately 18% of total aggregates create recurring replacement demand as infrastructure ages requiring rehabilitation and upgrade.
Bridge and dam construction demanding specialized high-performance aggregates create premium pricing opportunities supporting profitability optimization. Renewable energy infrastructure including wind farms and solar installations requiring concrete foundations expand application diversity beyond traditional construction markets supporting sustained demand growth.
Regional Insights
North America Construction Aggregates Market Trends
North America maintains significant market position through established infrastructure networks requiring modernization, sustained construction activity, and mature recycled aggregate market development. U.S. construction spending exceeded US$ 2.1 trillion in 2025, with infrastructure modernization targeting aging transportation networks and utility systems. Infrastructure Investment and Jobs Act (IIJA) channeling multi-year funds into roads, bridges, and ports creates substantial aggregate procurement demand supporting regional producer profitability.
The region demonstrates accelerating recycled aggregate adoption through state-level procurement mandates and sustainability certifications driving specification integration across commercial and residential projects. Advanced logistics capabilities and digital supply chain integration enable cost-effective material sourcing and project-specific delivery optimization. Regional consolidation among leading suppliers including Vulcan Materials and Martin Marietta Materials strengthens competitive positioning and operational efficiency across North American markets.
Europe Construction Aggregates Market Trends
Europe demonstrates mature market characteristics with sophisticated environmental regulations, advanced recycled aggregate capabilities, and strong green construction emphasis. European Union environmental directives mandate construction waste recycling achieving 90% diversion rates in leading markets including Germany, Netherlands, and Denmark. Germany produces approximately 600 million metric tons of aggregates annually, leveraging established quarrying infrastructure and advanced processing technology. Aggregates levy on virgin materials incentivizes recycled content adoption creating cost-competitive positioning for sustainable alternatives.
Regional manufacturers including Heidelberg Materials and CRH lead European market activity through comprehensive product portfolios and sustainability credentials supporting compliance with advancing environmental standards. Infrastructure rehabilitation programs across aging bridge and tunnel networks create sustained demand for specialized aggregate solutions. Renewable energy expansion including offshore wind farms requiring specialized concrete aggregates supports incremental demand growth across Northern Europe.
China Construction Aggregates Trends
China dominates global construction aggregates markets commanding approximately 40% of Asia Pacific consumption driven by unprecedented urbanization and infrastructure expansion. China's construction aggregate consumption reached 21 billion metric tons in 2025, with market valuation of US$ 43.6 billion projected to reach US$ 88.7 billion by 2035 expanding at 6.6% CAGR. Government urbanization policies targeting 70% urban population by 2030 create sustained infrastructure and residential construction demand. Belt and Road Initiative investments spanning multiple countries require massive aggregate procurement for transportation networks and development projects.
Major infrastructure programs including Shanghai urban expansion, Beijing-Tianjin-Hebei metropolitan integration, and southern regional development drive consistent multi-year aggregate demand. Regional manufacturers and international players including LafargeHolcim, China National Building Material, and Anhui Conch Cement strengthen market positions through operational excellence and sustainability commitments.
India Construction Aggregates Trends
India demonstrates exceptional market growth potential emerging as second-largest aggregate consumer globally with 7.8 billion metric tons consumed in 2025. Government initiatives including Pradhan Mantri Awas Yojana (PMAY) targeting 30 million affordable housing units, Bharatmala Pariyojana highway development, and Smart Cities Mission create multi-year aggregate demand across residential, commercial, and infrastructure sectors.
Infrastructure investment initiatives including metro rail expansion across major cities and railway network modernization generate sustained crushed stone and sand demand. Government regulations increasingly emphasizing environmental compliance and sustainable materials accelerate recycled aggregate market adoption supporting long-term sustainability objectives.
GCC Construction Aggregates Trends
Gulf Cooperation Council (GCC) countries including Saudi Arabia, United Arab Emirates, Qatar, Kuwait, Oman, and Bahrain demonstrate strong construction aggregates demand driven by economic diversification initiatives and mega-project development. Saudi Arabia dominates GCC construction markets commanding approximately 37.8% market share through Vision 2030 economic transformation program investing minimum SAR 150 billion annually across construction and infrastructure sectors. Neom megacity development project representing one of world's largest construction initiatives requires extraordinary aggregate volumes for infrastructure, residential, and commercial development.
United Arab Emirates contributes substantially through infrastructure modernization, real estate development, and renewable energy projects including massive solar installations. Regional emphasis on sustainability and green construction practices aligned with environmental commitments drives recycled aggregate adoption. Government procurement programs and private sector development initiatives ensure predictable multi-year infrastructure and construction spending supporting sustained aggregate demand through infrastructure maturation.
Competitive Landscape
The construction aggregates market exhibits moderate consolidation with leading manufacturers Holcim Ltd., CRH plc, Heidelberg Materials AG, and Vulcan Materials Company collectively controlling approximately 8-10% market share through extensive quarrying operations, established distribution networks, and regional market dominance.
Tier-two participants including CEMEX, Martin Marietta Materials, and regional specialists capture significant market segments through cost competitiveness and localized service excellence. Substantial capital requirements for quarry development and processing facility establishment create high market entry barriers supporting established player advantages. Strategic acquisition activity consolidates regional market positions as leading companies expand geographic footprint and product portfolio capabilities.
Key Developments:
- In February 2026, Heidelberg Materials Australia has entered into an agreement to acquire the construction materials business of Maas Group Holdings, an ASX-listed diversified industrial company and a major supplier of aggregates, ready-mixed concrete, and asphalt in Eastern Australia. The acquisition comprises 40 quarries with total reserves exceeding 350 million tons, 22 concrete batching plants, two asphalt operations, and one recycling facility.
- In February 2026, Holcim, a global leader in innovative and sustainable building solutions, has entered into a long-term Power Purchase Agreement (PPA) with Peak Energy to implement one of the largest behind-the-meter solar installations in the Philippines. The 25-megawatt-peak (MWp) project will supply clean power to Holcim’s cement manufacturing facilities, generating around 40 gigawatt-hours (GWh) of electricity annually and reducing CO2 emissions by approximately 28,500 tons per year.
- In July 2025, CRH, a global leader in building materials, has announced that it has entered into a definitive agreement to acquire Eco Material Technologies, a leading North American supplier of Supplementary Cementitious Materials (SCMs), for a total consideration of $2.1 billion. Following the transaction, the business will continue to operate under the name Eco Material Technologies as a CRH company.
Companies Covered in Construction Aggregates Market
- Holcim Ltd.
- CRH plc
- Heidelberg Materials AG
- CEMEX S.A.B. de C.V.
- Vulcan Materials Company
- Martin Marietta Materials, Inc.
- LSR Group
- Breedon Group plc
- Vicat SA
- Taiheiyo Cement Corporation
- Summit Materials
- TARMAC Group
- Carmeuse
- Lhoist Group
Frequently Asked Questions
The global construction aggregates market was valued at US$ 556.0 billion in 2026 and is projected to reach US$ 875.4 billion by 2033, representing a CAGR of 6.5% during the forecast period.
Primary demand drivers include accelerating global infrastructure investment, rapid urbanization, government mandates for sustainable construction, and recycled aggregate adoption supporting circular economy objectives globally.
Crushed Stone commands the dominant segment at approximately 42% market share, driven by exceptional versatility across infrastructure and road construction, superior load-bearing capacity for structural applications.
Asia Pacific dominates with 53.3% global market share, driven by rapid industrialization, unprecedented urbanization across China and India.
Renewable energy infrastructure expansion including solar farms, wind turbines, and hydroelectric facilities requiring millions of tons of aggregates presents the highest-growth opportunity.
Market leaders include CRH plc, Vulcan Materials Company (United States) leading North American market through extensive quarrying operations, Holcim Ltd. (Switzerland) maintaining global leadership with comprehensive portfolio, and Heidelberg Materials AG (Germany) strengthening competitive positioning through operational excellence and regional market focus.


