


- Industrial Machinery
- Portable Tools Market
Portable Tools Market
Global Market Study on Portable Tools: Manufacturing and Construction Boost Demand for Personal Protective Equipment and Power Tools
Construction activities to open new opportunity doors for power tools and personal protective equipment
City planners and real estate agents have been raising substantial demand for landscaping in commercial as well as residential areas, as the number of dwellers has increased drastically in the past decade.
With increasing activities in construction and real estate industries, portable tools are expected to gain high traction in upcoming years. With a growing number of consumers ready to pay more for a space with more gardening area, the demand for landscaping is rising in order to provide an aesthetic appeal to residential and commercial properties.
Persistence Market Research’s recently published report on the global market for portable tools (2018-2026) discusses various types of tools, including hand tools, garage tools, power tools, lighting tools, and personal protective equipment.
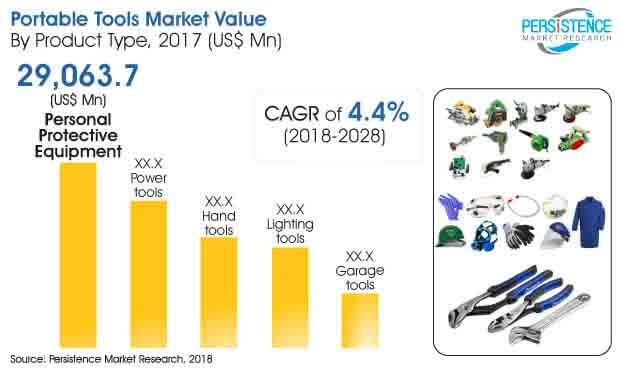
Among all portable tool type segments, according to the report, personal protective equipment (PPE) segment will maintain a significant edge over other categories in terms of revenue generation.
The PPE segment is foreseen to reach a value of over US$ 45,600 Mn by the end of 2026, growing at a CAGR of 5.2%. The forecast makes it a dominant segment in the market, whereas power tools is also identified to be a key segment.
Bolstering housing investments to provide massive scope for portable tools market to grow
Major urbanization and infrastructural growth is being predominantly observed in some of the top countries from developing economies, including India and China. These regions are anticipated to create highly attractive markets for portable tools in the coming years. Sales in Japan grew with the gradual recovery of investments in the housing sector and the demand for restoration following the Great East Japan Earthquake. Also, a large chunk of population usually migrates from rural to urban areas in an effort to achieve better lifestyle and acquire high-quality economic services including education, healthcare, and work opportunities among others.
These urban areas require high maintenance and updated infrastructure, resulting in generating high demand for portable tools. Government support and increased outsourcing of manufacturing endeavors in developed regions will continue to propel industrialization in emerging countries, which is further anticipated to boost growth of regional markets over 2018-2026.
Increased automation may cause a major setback to the demand for portable tools in the global market
Various industries are increasing the use of the automation technology and thereby, lowering the need for manual control i.e. human labor, which is primarily attributed to the advantages of automation - reduced labor costs, mitigation for effects of labor shortage, reduced manufacturing lead time, and improved product quality. Governments in emerging countries such as China, India, South Africa, and Brazil, are progressively injecting funds for automating processes in the manufacturing sector.
Increased adoption of industrial automation in these regions is mainly due to gradual rise in labor wages. However, inclination of manufacturers on cost-cutting for a competitive edge will decrease the labor workforce, which in turn will hamper the adoption of PPE during the next few years. It is expected to have the greatest impact on global portable tools market and all the products involved in it.
On the other hand, the market also has to face the fluctuation in prices of raw materials used for tools, especially gardening tools. The rise in the cost of raw materials used for gardening tools directly affects operational costs of the manufacturing process, which is a primary concern among manufacturers. It ultimately destabilizes the supply chain and product selling price. The market is foreseen to be predominantly influenced by this factor during the forecast period.
Market Taxonomy
| Attribute | Details |
|---|---|
|
By End-Use |
|
|
By Sales Channel |
|
| By Region |
|
Companies Covered in Portable Tools Market
- Akar Tools Ltd.
- Apex Tools Group
- Atlas Copco AB
- Channellock, Inc.
- Danaher Corporation
- Emerson Electric Co. (RIDGID)
- Fiskars Group
- General Tools & Instruments LLC
- Makita Corporation
- JK Files (India) Limited
- Kennametal Inc.
- Klein Tools
- Robert Bosch GmbH
- Q.E.P. Co., Inc.
- Snap-On Inc.
- Stanley Black & Decker, Inc.
- Techtronic Industries Company Limited
- Wera Tools
- 3M Co.
- DowDuPont Inc
- Honeywell International Inc.
- Ansell Limited
- Avon Rubber Plc.
- Msa Safety Inc.
- Lakeland Industries Inc.
- Uvex Safety Group
- Alpha Pro Tech, Ltd
- Rock Fall Ltd.
- Others.


