


- Food Ingredients & Additives
- PHO and Non-PHO based Oils and Fats Market
PHO and Non-PHO based Oils and Fats Market Size, Share, Growth, and Regional Forecast, 2025 - 2032
PHO and Non-PHO based Oils and Fats Market by Product Type (Partially Hydrogenated Oils, Non-Partially Hydrogenated Oils), by Source (Palm Oil, Soy Oil, Groundnut Oil, Coconut Oil, Olive Oil, Others), by End-user (Food and Beverages Industry, Cosmetics & Personal Care, Biofuels, Others), and Regional Analysis from 2025 - 2032
PHO and Non-PHO Oils and Fats Market Share and Trends Analysis
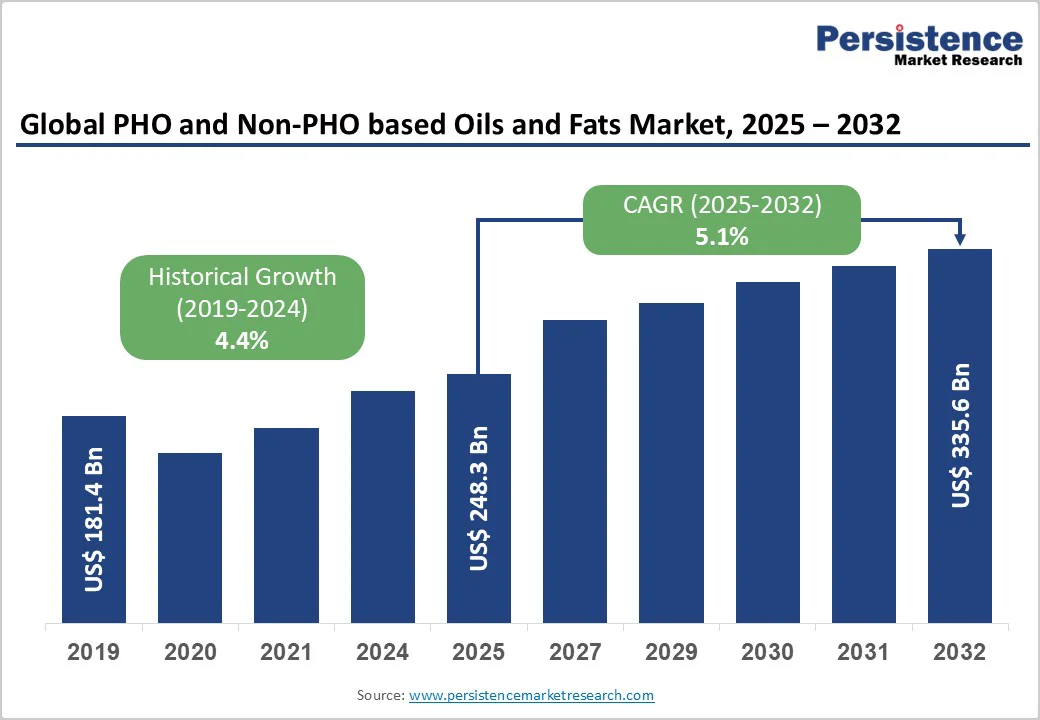
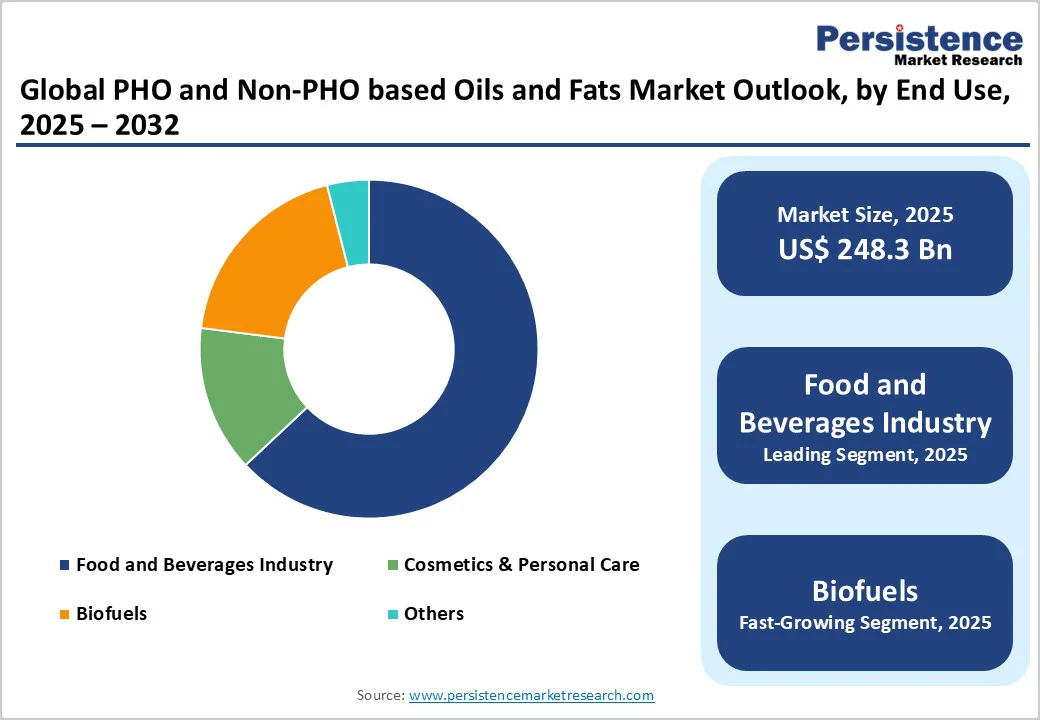
The global PHO and non-PHO based oils and fats market size is valued at US$ 248.3 billion in 2025 and projected to reach US$ 335.6 billion, growing at a CAGR of 5.1% during the forecast period from 2025 to 2032. The global PHO and non-PHO based oils and fats market is undergoing a structural reset as global reformulation cycles accelerate and trans-fat elimination policies force rapid innovation across the value chain. With countries rewriting fat standards and brands racing toward cleaner lipid systems, competitive pressure is reshaping regional dynamics, product priorities, and investment pathways.
Key Industry Highlights:
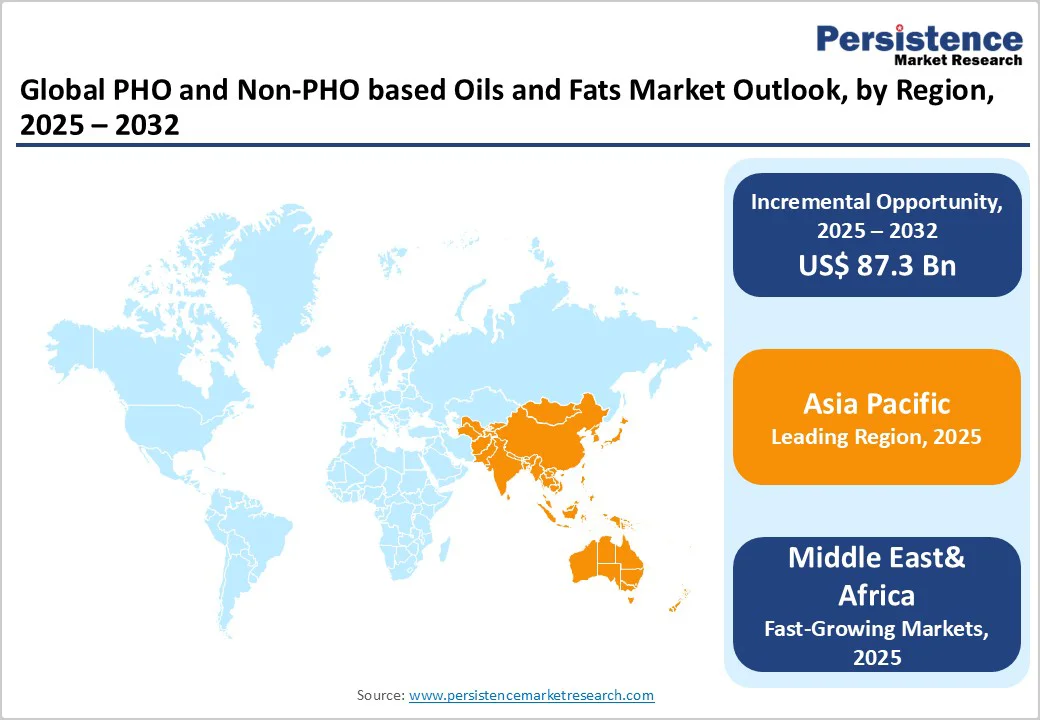
- Leading Region: Asia Pacific dominates the global landscape, supported by large-scale reformulation efforts in China, expanding interesterified fat portfolios in India, and advanced structured-fat innovation in Japan and South Korea.
- Fastest-Growing Region: Middle East and Africa, driven by GCC-led premiumization, Egypt’s refining upgrades, and rising non-PHO adoption across African snack and bakery sectors.
- Fastest-Growing Product Type Segment: Non-PHO Oils & Fats, strengthened by regulatory crackdowns, cleaner-label demand, and rapid uptake of high-oleic and interesterified formulations across bakery, confectionery, and frying applications.
- Market Drivers: The accelerating global withdrawal from trans-fats is pushing manufacturers toward structured non-PHO systems that deliver stability, texture, and compliance amid tightening fat regulations and rising heart-health awareness.
- Opportunities: Scaling specialty non-PHO bakery shortenings for reformulation-intensive clients, backed by enzymatic interesterification, modular crystallization, and co-development partnerships with industrial bakeries and snack producers.
- Key Developments: In May 2025, WHO recognized Austria, Norway, Oman, and Singapore for achieving full elimination of industrial trans fats. In the same month, Cargill claimed the top rank on the Edible Oil Supplier Index 2025 for removing all industrially produced trans-fatty acids across its global edible oils portfolio.
| Key Insights | Details |
|---|---|
|
Global PHO and Non-PHO based Oils and Fats Market Size (2025E) |
US$ 248.3 Bn |
|
Market Value Forecast (2032F) |
US$ 335.6 Bn |
|
Projected Growth (CAGR 2025 to 2032) |
5.1% |
|
Historical Market Growth (CAGR 2019 to 2024) |
4.4% |
Market Dynamics
Driver - The Global Shift Away from Trans-Fats is Accelerating Demand for Non-PHO Structured Fats
The global shift away from trans-fats is accelerating demand for non-PHO structured fats, and this momentum is reshaping formulation strategies across food, bakery, and snacks categories. As more countries enforce strict trans-fat limits and mandate clean, compliant ingredient lists, manufacturers are reformulating to maintain texture, stability, and shelf life without relying on PHOs. This regulatory pressure is pushing brands toward palm-based, interesterified, and high-oleic blends that deliver functionality without harmful lipid profiles. Large food processors are fast-tracking pilot trials of these alternatives to secure long-term supply resilience and meet retailer scrutiny. Rising consumer scrutiny around heart-health risks is further amplifying demand, strengthening the market position of advanced non-PHO fat systems engineered for modern, health-driven product lines.
Restraints - Global Regulatory Bans on Industrial Trans-Fats
Global regulatory bans on industrial trans-fats are tightening operational space for PHO-based oils and fats, creating a structural restraint across multiple food categories. As governments enforce near-zero trans-fat thresholds, manufacturers using PHOs face reformulation pressure, higher compliance costs, and stricter audits tied to public-health mandates. This shift limits the commercial viability of legacy PHO systems that once offered reliable functionality in bakery shortenings, fry oils, and spreads. Companies depending on older hydrogenation setups are dealing with accelerated equipment upgrades, labeling vulnerabilities, and shrinking demand from retailers moving toward trans-fat–free shelves. While alternatives exist, the transition is capital-intensive, slowing margins for firms unable to swiftly pivot toward compliant structured fat systems and reducing market flexibility for PHO-focused producers.
Opportunity - Scaling Specialty Non-PHO Bakery Shortenings to Capture Reformulation Demand from Global Bakery and Snack Manufacturers
Scaling specialty non-PHO bakery shortenings is emerging as a high-impact opportunity as global bakery and snack manufacturers accelerate reformulation programs. With major food brands racing to eliminate trans-fat risks, demand is rising for shortenings that deliver precise performance controlled melting curves, enhanced aeration, and stable crumb structure without relying on traditional PHOs. Companies that invest in modular fat-structuring systems, enzymatic interesterification, and tailored crystallization technologies can secure long-term supply partnerships with industrial bakeries seeking cleaner, compliant inputs. Startups entering this space benefit from agility, allowing them to co-develop custom shortenings for pastries, cookies, and laminated doughs. As bakery producers expand better-for-you product lines, suppliers offering consistent, scalable, and label-friendly non-PHO shortenings stand to gain significant market traction.
Category-wise Analysis
By Product Type Insights
Non-PHO Oils & Fats command approximately 89% of the global market share as of 2024, reflecting a decisive industry transformation driven by health imperatives and regulatory momentum. These alternatives, including palm oil, soybean oil, canola oil, and high-oleic variants, have surged in prominence following widespread bans on partially hydrogenated oils across major economies. Manufacturers favor non-PHO solutions for their versatility in applications ranging from bakery products to confectionery, while maintaining desirable texture and shelf stability without the cardiovascular risks associated with industrial trans fats.
PHO oils and fats, once industry workhorses valued for their extended shelf life and functional properties, now occupy a diminishing corner of the market. Mounting scientific evidence linking trans fatty acids to coronary disease has triggered stringent regulatory crackdowns, particularly in North America and Europe. The food industry's pivot toward healthier lipid profiles has rendered PHO products increasingly obsolete, cementing non-PHO alternatives as the undisputed market leaders.
By End-user Insights
Biofuels are projected to achieve a CAGR of 7.6% during the forecast period, reflecting a strong shift toward low-carbon energy pathways and rising demand for efficient fermentation inputs such as corn steep liquor (CSL). Governments are tightening blending mandates, and ethanol producers are scaling capacity, creating steady pull for nutrient-rich, cost-effective fermentation aids. CSL’s amino acids, vitamins, and organic acids help increase ethanol yields, which makes it a preferred additive for next-generation biofuel plants targeting higher process efficiency. As countries expand grain-based and cellulosic ethanol programs, producers are prioritizing stable, high-quality inputs that support continuous production cycles. This momentum positions CSL suppliers to benefit from expanding bio-refineries and the global push for cleaner energy transitions.
Region-wise Insights
Asia Pacific PHO and Non-PHO based Oils and Fats Market Trends
Asia Pacific holds approximately 39% market share in the global PHO and Non-PHO based Oils and Fats Market, and the region is reshaping industry momentum through rapid reformulation, structural fat innovation, and rising consumer scrutiny of ingredient quality. In China, bakery and confectionery manufacturers are shifting towards customized non-PHO shortenings to meet cleaner-label expectations and evolving food safety rules. India’s edible oil processors are expanding interesterified fat portfolios to serve growing packaged snack demand and tighter trans-fat limits. Japan is driving the uptake of high-stability non-PHO blends for premium bakery and functional food categories, while South Korea is prioritizing high-performance frying oils for its expanding quick-service landscape. Regional players are increasing R&D, enhancing processing technologies, and strengthening traceability to secure long-term competitiveness.
Middle East and Africa PHO and Non-PHO based Oils and Fats Market Trends
Middle East and Africa PHO and Non-PHO based Oils and Fats Market is expected to grow at a CAGR of 7.8% during the forecast period, driven by evolving dietary expectations, tighter fat regulations, and modernization of regional food processing. In the GCC, bakery, confectionery, and quick-service brands are shifting toward premium non-PHO shortenings and frying oils to align with health-focused reformulations and stricter import specifications. Egypt is expanding its refining and blending capabilities to reduce reliance on imported fats and enhance cost stability. Across emerging African markets, rising consumption of packaged snacks is pushing local processors to adopt non-PHO structured fats with improved shelf-life performance. Regional players are upgrading refining technology, enhancing quality certifications, and exploring sustainable sourcing models to strengthen long-term competitiveness.
Competitive Landscape
The global PHO and Non-PHO based Oils and Fats market reflects a moderately consolidated structure, shaped by established refiners expanding capacity and sharpening their technical edge. Leading companies are reengineering formulations with interesterification, enzymatic modification, and advanced fractionation to deliver clean-label, zero-trans-fat solutions tailored for bakery, confectionery, and frying applications. Sustainability pressures are prompting tighter traceability programs, deforestation-free sourcing policies, and upgraded quality certifications. Startups are entering with agile, niche innovations such as structured fats from regenerative oilseed supply chains or precision-fermented lipid ingredients. Regulatory bans on industrial trans-fats continue to steer product development toward healthier lipid profiles. Across the value chain, producers are enhancing stability, texture, and oxidative performance to stay relevant in reformulation-driven markets.
Key Industry Developments:
- In May 2025, the World Health Organization honored Austria, Norway, Oman, and Singapore for fully eliminating industrially produced trans fats from their national food systems. The recognition strengthens global momentum toward healthier fat reformulation and raises compliance pressure across the oils and fats industry.
- In May 2025, Cargill secured the top position on the inaugural Edible Oil Supplier Index 2025 released by the Access to Nutrition Initiative. The ranking highlights its achievement in eliminating industrially produced trans-fatty acids from its entire edible oils portfolio, including regions lacking regulatory requirements.
Companies Covered in PHO and Non-PHO based Oils and Fats Market
- Cargill, Inc.
- Wilmar International
- AAK AB
- Bunge Limited
- ADM
- PURATOS
- Musim Mas Group
- Fuji Oil Co., Ltd.
- FGV Holdings
- IOI Corporation Berhad
- Others
Frequently Asked Questions
The global PHO and Non-PHO based Oils and Fats market is projected to be valued at US$ 248.3 Bn in 2025.
The worldwide move to eliminate trans-fats is sharply increasing the adoption of non-PHO structured fats, becoming a major force propelling the global PHO and non-PHO oils and fats market.
The global PHO and Non-PHO based Oils and Fats market is poised to witness a CAGR of 5.1% between 2025 and 2032.
Scaling specialty non-PHO bakery shortenings to capture reformulation demand from global bakery and snack manufacturers represents a major market opportunity.
Major players in the global PHO and Non-PHO based Oils and Fats market include Cargill, Inc., Wilmar International, AAK AB, Bunge Limited, ADM, and others.


