


- Carbon Capture & Storage
- Carbon Capture, Utilization, and Storage Market
Carbon Capture, Utilization, and Storage Market Size, Share, and Growth Forecast 2026 - 2033
Carbon Capture, Utilization, and Storage Market by Service Type (Capture, Transportation, Storage, Utilization), Industry (Oil & Gas, Power Generation, Iron & Steel, Chemical & Petrochemical, Cement, Others), and Regional Analysis, 2026 - 2033
Carbon Capture, Utilization, and Storage Market Size and Trend Analysis
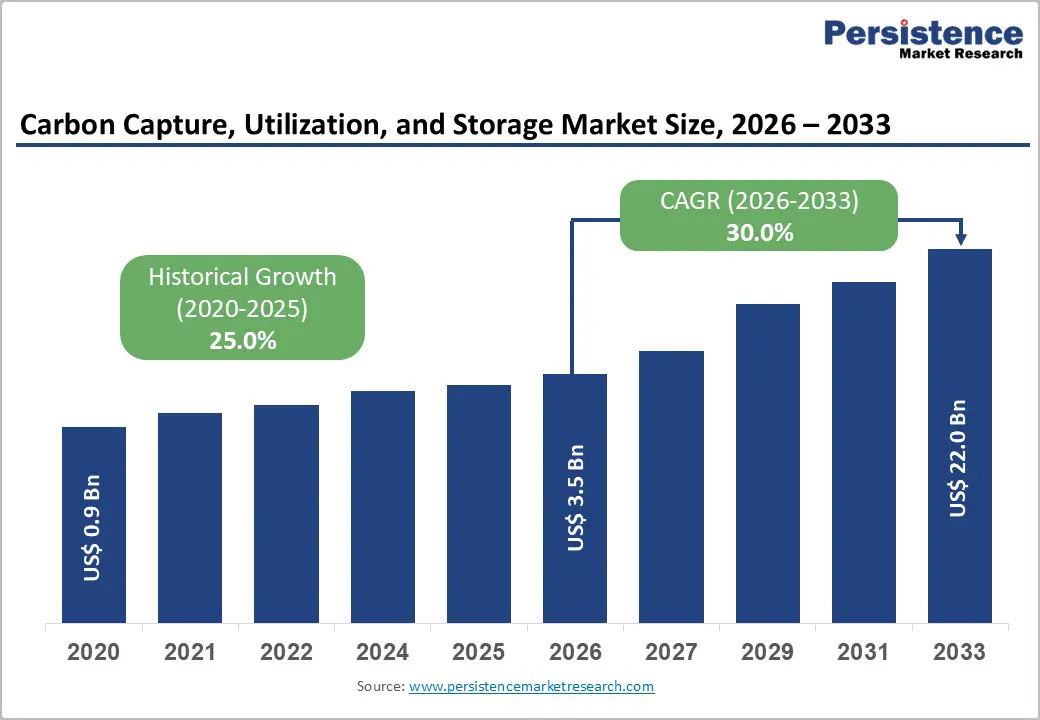
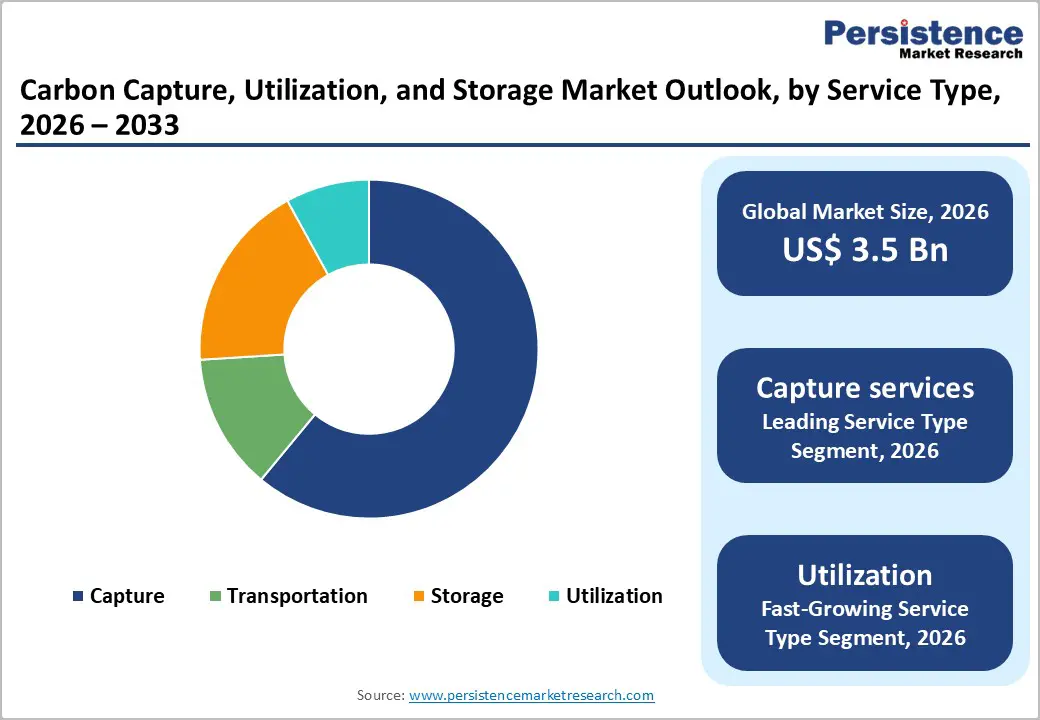
The global Carbon Capture, Utilization, and Storage market size is expected to be valued at US$ 3.5 billion in 2026 and projected to reach US$ 22.0 billion by 2033, growing at a CAGR of 30.0% between 2026 and 2033.
Market expansion is fundamentally driven by accelerating global decarbonization commitments, with over 474 projects announced worldwide targeting 812 million tonnes per annum (mtpa) of capacity by 2030; stringent emissions regulations from governments worldwide; and the International Energy Agency (IEA) estimating that operational capture capacity will reach 430 million tonnes by 2030. Additionally, the United States Inflation Reduction Act of 2022 offers substantial tax incentives for CCUS deployment, while voluntary carbon markets signed advanced offtake agreements for close to 6 million tonnes of CO2 removal in 2024, providing necessary revenue certainty for project development.
Key Industry Highlights:
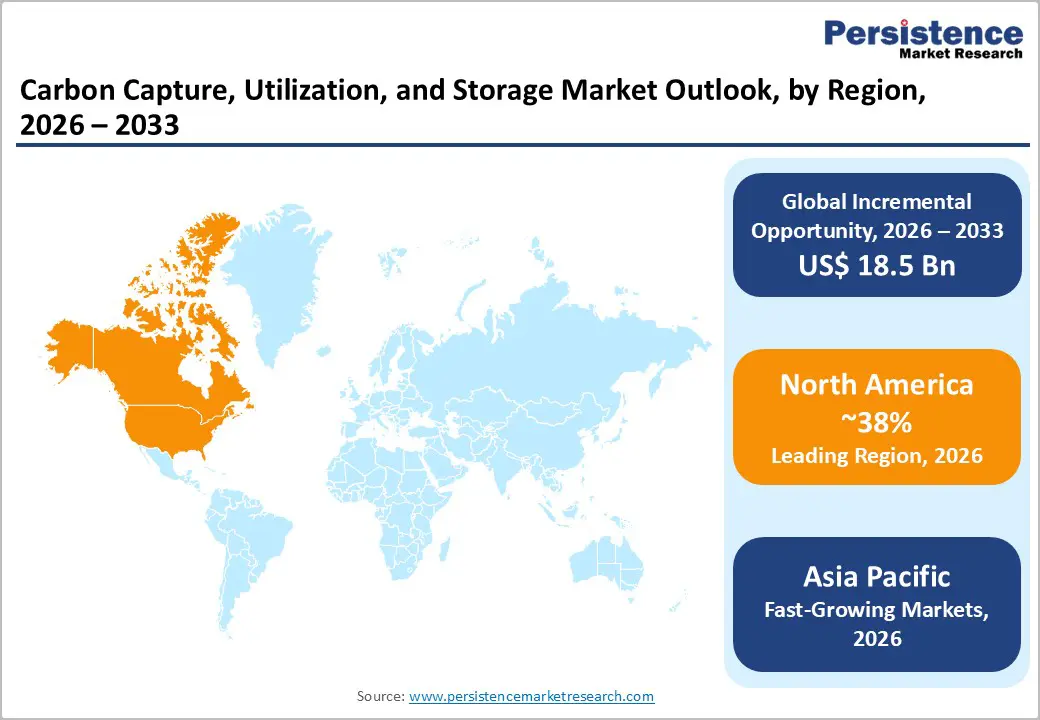
- Leading Region: North America dominates the global Carbon Capture, Utilization, and Storage market with approximately 38% revenue share in 2025, driven by the United States leadership supported by the Inflation Reduction Act of 2022 tax incentives, U.S. Department of Energy funding, net-zero by 2050 commitments, and 35% projected share of global CCS capacity by 2030.
- Fastest-Growing Region: Asia Pacific emerges as the fastest-growing regional market through 2033, propelled by China’s 2060 net-zero target, India’s 2070 pledge announced at COP26, the world’s first cement production CO2 capture plant operational in China in 2024, and Indonesia’s major FID for Tangguh natural gas processing CCUS project.
- Dominant Segment: Capture services dominate the service type segment with approximately 61% share in 2025, supported by post-combustion technology projected to account for 73% share of 2030 capture capacity, over 60% operational capacity at natural gas processing facilities, and Capture-as-a-Service models gaining traction among industrial emitters.
- Fastest Growing Segment: Direct Air Capture (DAC) represents the fastest-growing segment projected to account for 7% of captured CO2 by 2070, fueled by voluntary carbon market offtake agreements for close to 6 million tonnes in 2024, representing 75% of removal credits purchases, world’s largest DAC plant commissioning in United States in 2025, and essential role in achieving net-zero targets.
- Key Opportunity: Oil & Gas end-use industry presents substantial growth opportunities commanding 42% market share in 2025, with major operators including ExxonMobil, BP, and Equinor positioned to become leading CCS players by 2030, CO2-EOR providing revenue streams offsetting capture costs, and the UK’s NEP project demonstrating integrated CCUS hub development serving multiple industrial emitters.
| Key Insights | Details |
|---|---|
|
Carbon Capture, Utilization, and Storage Market Size (2026E) |
US$ 3.5 billion |
|
Market Value Forecast (2033F) |
US$ 22.0 billion |
|
Projected Growth CAGR (2026-2033) |
30.0% |
|
Historical Market Growth (2020-2025) |
25.0% |
Market Dynamics
Drivers - Stringent Government Climate Policies and Substantial Tax Incentives Accelerating Project Deployment
Governments worldwide have implemented comprehensive policy frameworks that combine emissions-reduction mandates with financial incentives to accelerate CCUS deployment across industrial sectors. The United States Inflation Reduction Act of 2022 significantly boosted forecasts for CCUS installations through enhanced tax credits, providing up to US$ 85 per tonne for captured CO2 permanently stored and US$ 60 per tonne for captured CO2 utilized in products, creating compelling economic viability for previously marginal projects. According to the International Energy Agency (IEA), as of the first quarter of 2025, there was just over 50 million tonnes (Mt) of CO2 capture and storage capacity in operation, demonstrating modest but steady growth.
The CCUS pipeline is projected to grow strongly in the coming years, with current project announcements indicating a 49% CAGR between 2025 and 2030, reaching over 812 million tonnes per annum (mtpa) across 474 projects globally. The European Union has increased incentives to attract capital for ambitious low-carbon goals, while India announced its commitment to achieving net-zero emissions by 2070 at the COP26 summit, with pledges to reduce carbon intensity by 45% by 2030 relative to 2005 levels, necessitating large-scale CCUS deployment, particularly in hard-to-abate industries such as cement and petrochemicals. These regulatory frameworks create sustained market momentum as industries face mounting pressure to meet upcoming Net Zero Emissions (NZE) targets.
Growing Demand from Power Generation and Hard-to-Abate Industrial Sectors
The power generation sector emerges as the primary growth driver, projected to become the main industry adopter of CCUS by 2030, accounting for approximately 40% of captured CO2 by 2070, with almost half linked to bioenergy according to IEA analysis. The power sector, responsible for approximately 40% of global energy-related CO2 emissions today, confronts the dual challenge of tripling electricity demand by 2070 while achieving net-zero emissions during the 2050s. In 2024, the first natural gas power plant with carbon capture and storage reached Final Investment Decision (FID) in the United Kingdom, targeting a capture capacity of 2 million tonnes of CO2 per year, demonstrating the commercial viability of power sector CCUS applications.
Heavy industries, including cement, iron & steel, and chemicals, account for nearly 20% of global CO2 emissions, with CCUS representing virtually the only technology solution for deep emissions reductions from cement production, where process emissions from calcination cannot be eliminated through fuel switching or electrification. The cement industry specifically saw a groundbreaking development as a plant in China that started operations in 2024 became the world’s first to capture CO2 emissions from cement production, while Norway is set to commission the world’s largest capture project at a cement plant in 2025 with capacity to capture 400,000 tonnes of CO2 per year, validating technical feasibility and paving pathways for sector-wide adoption.
Restraints - High Capital Expenditure and Operational Costs Limiting Project Economics
The CCUS industry confronts substantial economic barriers stemming from high capital investment requirements for capture equipment, transportation infrastructure, and storage facilities, creating particularly acute challenges for industries operating on tight margins. The cost per tonne of captured CO2 remains elevated, with capture technologies requiring significant energy inputs that can reduce power plant net output by 15-25% or demand dedicated energy infrastructure for industrial facilities. Small to medium-scale industrial emitters face disproportionate cost burdens as economies of scale favor large-capacity installations, with per-unit capital costs declining substantially above 500,000 tonnes per year capture thresholds.
Transport infrastructure entails additional capital intensity, requiring either dedicated pipeline networks with costs ranging from US$50,000 to US$100,000 per kilometer for onshore pipelines or specialized shipping infrastructure in regions lacking proximity to geological storage. Storage site characterization, well drilling, and long-term monitoring incur additional operational expenditures that extend for decades beyond initial commissioning. These cumulative cost structures demand either sustained carbon pricing above US$ 50-80 per tonne or government subsidies to achieve financial viability, limiting deployment velocity in jurisdictions lacking robust policy support frameworks.
Technical Complexity and Infrastructure Constraints in Transportation and Storage
The CCUS value chain faces substantial technical challenges, including optimization of capture efficiency, CO2 transportation logistics, and the availability of geological storage sites, that constrain rapid market expansion. Post-combustion capture systems, while most widely deployed, typically achieve 85-90% capture rates, leaving residual emissions, while requiring significant retrofitting investments for existing facilities. Transportation infrastructure presents geographic constraints: 80% of capture capacity that could become operational by 2030 is concentrated in North America or Europe, compared with just below 60% of operational capacity, according to IEA analysis, indicating potential regional imbalances between emission sources and storage availability.
Geological storage site characterization requires extensive subsurface analysis to confirm adequate reservoir capacity, caprock integrity, and long-term containment security, with permitting processes under frameworks such as U.S. EPA Class VI wells requiring a minimum of 2-3 years for approval. The world’s first large-scale storage project in a depleted gas field began operations in Australia in 2024, demonstrating technical feasibility while highlighting the extended development timelines for novel storage approaches that require comprehensive reservoir understanding and injection well optimization.
Opportunity - Direct Air Capture and Carbon Dioxide Removal Technologies Attracting Substantial Investment
Direct Air Capture (DAC) technologies represent transformative growth opportunities as governments and corporations seek carbon dioxide removal capabilities essential for achieving net-zero emissions targets beyond industrial point-source capture. According to the IEA, DAC is projected to account for 7% of captured CO2 by 2070, serving dual purposes as both a carbon-neutral source of CO2 for synthetic fuel production and a pathway for generating negative emissions when combined with permanent geological storage. Voluntary carbon markets provided strong demand signals in 2024, with advanced offtake agreements signed for close to 6 million tonnes of CO2 removal with developers of Bioenergy with Carbon Capture and Storage (BECCS) and DAC projects, making up 75% of total carbon dioxide removal credits purchases in 2024, almost twice as high as 2023, providing necessary revenue certainty for projects to reach FID.
The CCUS industry is expected to continue its development in 2025, as major projects come online, including the world’s largest DAC plant in the United States, thereby demonstrating technology maturation and scale-up capabilities. A DAC pilot started construction in Kenya after securing venture capital investment, representing the first-ever CCUS project in the region and validating global geographic expansion potential beyond traditional industrial hubs. As costs decline through technological learning curves and manufacturing scale-up, DAC is positioned to capture significant market share, addressing diffuse emissions sources impossible to abate through point-source capture alone.
Carbon Utilization Pathways Creating Value-Added Revenue Streams
Carbon utilization is a high-potential growth segment, transforming captured CO2 from a waste-disposal challenge into a valuable feedstock for fuels, chemicals, building materials, and industrial processes. While only approximately 8% of the total captured CO2 is used or recycled according to IEA projections for 2070, this utilization plays an important role in supporting the decarbonization of the transport and industry sectors through the production of synthetic fuels and chemical feedstocks. CO2-Enhanced Oil Recovery (CO2-EOR) is the most commercially mature utilization pathway, simultaneously boosting hydrocarbon extraction while sequestering emissions underground, and it has gained strong policy support in Canada and the United States, where it provides economic justification for capture infrastructure investments.
Emerging applications include converting CO2 into methanol, urea, carbonates, and polymers, offering industrial synergies and circular-economy potential that reduce the net cost per tonne of captured CO2 through revenue from product sales. In February 2024, several companies initiated feasibility studies to assess the conversion of captured CO2 into building materials, such as concrete aggregates and curing agents, thereby sequestering emissions within construction infrastructure while generating demand in the construction industry. Several startups and established companies are investing heavily in research and development to scale these technologies and reduce energy requirements of the conversion process, with maturation expected to significantly improve economic viability and encourage broader market adoption across manufacturing sectors seeking to integrate circular carbon management into production processes.
Category-wise Analysis
Service Type Insights
Capture services dominate the CCUS market with approximately 61% market share in 2025, as carbon capture represents the essential entry point for all CCUS value chains. Demand is driven by the need to reduce emissions from existing power plants and industrial facilities without full asset replacement, making capture solutions highly attractive. Post-combustion capture, in particular, is gaining traction due to its compatibility with existing infrastructure and its flexibility across multiple industries.
A large proportion of operational capture capacity remains concentrated in natural gas processing facilities, where high CO concentrations enable cost-efficient separation. Increasingly, emitters are adopting capture-as-a-service models to avoid capital-intensive investments and technological risks, accelerating outsourcing to specialized providers and reinforcing capture’s structural dominance within CCUS deployment.
Industry Insights
The oil and gas industry is the largest end-use segment in the CCUS market, accounting for approximately 42% of the market in 2025, driven by its high emissions profile and unmatched subsurface expertise. The sector plays a dual role as both a major CO emitter and a key enabler of storage development, leveraging existing geological data, pipelines, and reservoir management capabilities.
Natural gas processing remains the largest application globally for CO capture, benefiting from the high CO content in raw gas streams and mature separation technologies. Additionally, CO-enhanced oil recovery provides a commercial incentive by offsetting capture costs while enabling permanent sequestration. Ongoing investments in integrated CCUS hubs further strengthen the oil and gas sector’s leadership in large-scale deployment.
Regional Insights
North America Carbon Capture, Utilization, and Storage Market Trends and Insights
North America leads the global CCUS market, accounting for approximately 38% of revenue in 2025, driven primarily by the United States’ strong policy and funding framework. The Inflation Reduction Act of 2022 significantly improved project economics through enhanced tax credits, while U.S. Department of Energy funding continues to support the development of capture, removal, and storage technologies. The region benefits from decades of oil and gas exploration, which has provided extensive subsurface data that accelerates the identification and permitting of geological storage sites.
Industry projections indicate North America will account for nearly 35% of global CCS capacity by 2030, reflecting sustained deployment momentum. In March 2025, Baker Hughes partnered with Frontier Infrastructure to advance U.S. CCS projects, with Frontier holding three Class VI permits and targeting first CO- injection by end-2025. Canada also positions CCUS as central to its net-zero 2050 strategy, supported by Pathways Alliance oil sands initiatives and growing ESG-driven investment.
Europe Carbon Capture, Utilization, and Storage Market Trends and Insights
Europe accounts for approximately 31% of revenue in 2025, supported by stringent environmental regulations under the EU Green Deal and the REACH framework. CCUS adoption is accelerating across cement, steel, power, and chemical industries, where emissions are difficult to abate. The United Kingdom reached a major milestone in 2024 when its first gas-fired power plant with CCS achieved FID, targeting 2 million tonnes of CO capture per year.
In December 2024, the Northern Endurance Partnership achieved financial close on three CCS projects within the East Coast Cluster, supported by a 145-kilometer offshore pipeline connected to the Endurance saline aquifer at around 1,000 meters depth. Norway is commissioning the world’s largest cement CCS project in 2025 with 400,000 tonnes per year capacity, while Sweden approved its largest CO removal project in 2024. Proximity to North Sea storage sites strengthens Europe’s regional integration.
Asia Pacific Carbon Capture, Utilization, and Storage Market Trends and Insights
Asia-Pacific accounts for approximately 19% of global CCUS revenue in 2025 and is a high-growth market, driven by industrial emissions and national net-zero commitments. China’s 2060 carbon-neutrality target and India’s 2070 pledge are key drivers, while China and the Middle East together account for 25% of CCUS capacity that is operational or under construction, according to the IEA. China achieved a major milestone in 2024 by commissioning the world’s first cement plant with operational CO capture.
Indonesia reached Final Investment Decision in 2024 for a large-scale CCUS project at the Tangguh LNG facility, marking Southeast Asia’s first project to enter construction. Japan and South Korea continue advancing pilot and cluster-based CCUS programs, while India faces pressure to cut emissions intensity 45% by 2030, reinforcing the need for CCUS deployment in cement, steel, and petrochemicals despite slower near-term capacity additions.
Competitive Landscape
The global Carbon Capture, Utilization, and Storage (CCUS) market is characterized by moderate fragmentation, with competition spanning capture technology providers, engineering and construction firms, storage operators, and infrastructure developers. Market structure is evolving toward integrated value-chain participation, where players aim to offer end-to-end solutions covering capture, transport, storage, and monitoring. Business strategies increasingly emphasize cost competitiveness through technology efficiency gains, standardized project designs, and scale benefits within CCUS hubs and clusters. Collaboration is a core strategic lever, with partnerships formed to combine capture expertise, subsurface storage access, and project execution capabilities.
Participants are also pursuing geographic diversification, particularly in regions with strong policy incentives and industrial decarbonization mandates. Service-oriented models, such as CCUS-as-a-Service, are gaining traction as industrial emitters seek to outsource emissions management rather than invest in owned assets. Additionally, integration of CCUS with hydrogen production and other low-carbon value chains is emerging as a strategy to improve asset utilization and long-term project economics, while independent verification and monitoring services support regulatory compliance and carbon credit credibility.
Key Developments
- December 2024: Equinor, BP, and TotalEnergies, through NEP and their Net Zero Teesside Power joint venture, announced financial close after taking Final Investment Decision to execute three of the UK’s first carbon capture and storage projects in the East Coast Cluster.
- March 2025: Baker Hughes announced a partnership with Frontier Infrastructure to accelerate development of carbon capture and storage projects in the United States, with Frontier holding three Class VI permits and commencing drilling on the first wells targeting year-end 2025 injection.
- August 2025: Halliburton secured a contract with the Northern Endurance Partnership (NEP), a joint venture of BP, Equinor, and TotalEnergies, to deliver completions and downhole monitoring services for the UK’s first offshore carbon capture and storage project in the North Sea.
Companies Covered in Carbon Capture, Utilization, and Storage Market
- Baker Hughes
- Halliburton
- SGS SA
- DNV (Det Norske Veritas)
- Tenaris S.A.
- EagleBurgmann Group
- Equinor ASA
- Eni S.p.A.
- Pathways Alliance
- Deep Sky Carbon Capture
- ExxonMobil Corporation
- BP Plc
- TotalEnergies
- Shell
- Schlumberger (SLB)
- Fluor Corporation
- TechnipEnergies
- Linde plc
- Air Liquide
- Mitsubishi Heavy Industries
Frequently Asked Questions
The CCUS market is valued at about US$ 3.5 billion in 2026 and is projected to reach US$ 22.0 billion by 2033 at a CAGR of 30.0%.
Demand is driven by stringent climate policies, incentives such as the U.S. Inflation Reduction Act, over 474 announced projects targeting 812 mtpa by 2030, and rising decarbonization commitments across power and industrial sectors.
North America leads with around 38% revenue share in 2025, supported by strong U.S. tax credits of up to US$ 85 per tonne and a projected 35% share of global CCS capacity by 2030.
Direct Air Capture is the key opportunity, expected to account for 7% of captured CO₂ by 2070, supported by nearly 6 million tonnes of offtake agreements signed in 2024 and large-scale plant commissioning.
Leading market players include Baker Hughes, Halliburton, Equinor ASA, BP Plc, TotalEnergies, ExxonMobil Corporation, Eni S.p.A., Shell, Schlumberger (SLB), Fluor Corporation, TechnipEnergies, DNV, and SGS SA among others.


