


- Communication Infrastructure & Services
- Consumer Mobile Payments Market
Consumer Mobile Payments Market Size, Share, and Growth Forecast 2026 - 2033
Consumer Mobile Payments Market by Mode of Payment (Remote, Proximity), Technology (Near Field Communication, Direct Mobile Billing, Mobile Web Payment, USSD, QR Codes, Other), End-use Industry (Retail, Hospitality & Tourism, IT & Telecommunication, BFSI, Media & Entertainment, Healthcare, Airline, Others), and Regional Analysis for 2026-2033
Consumer Mobile Payments Market Size and Trend Analysis
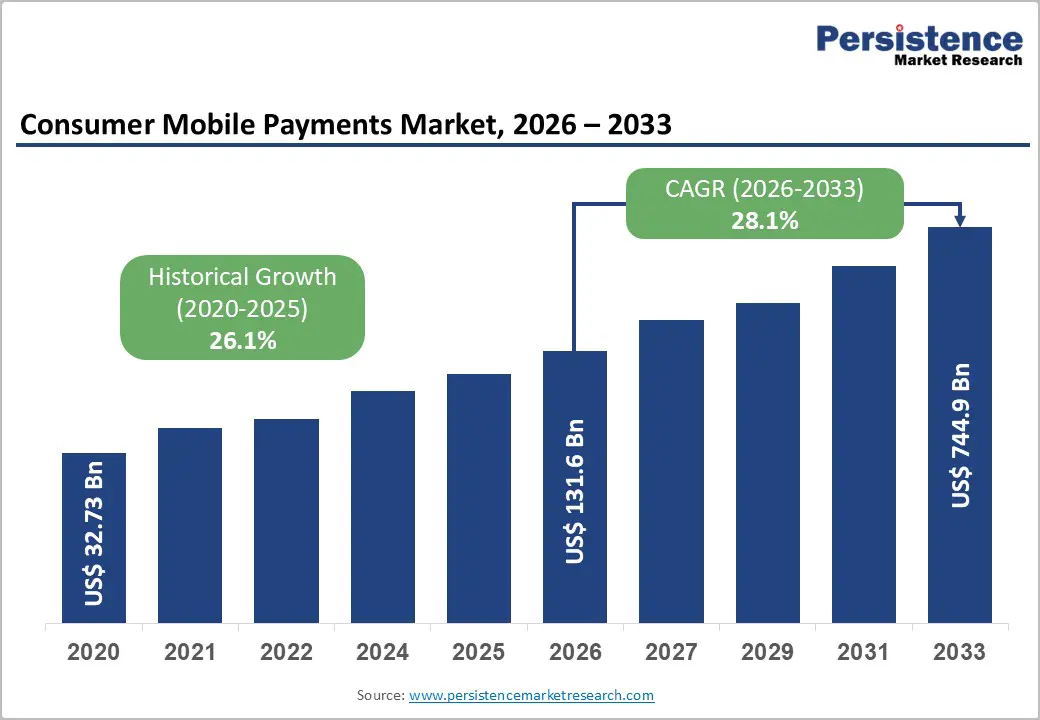
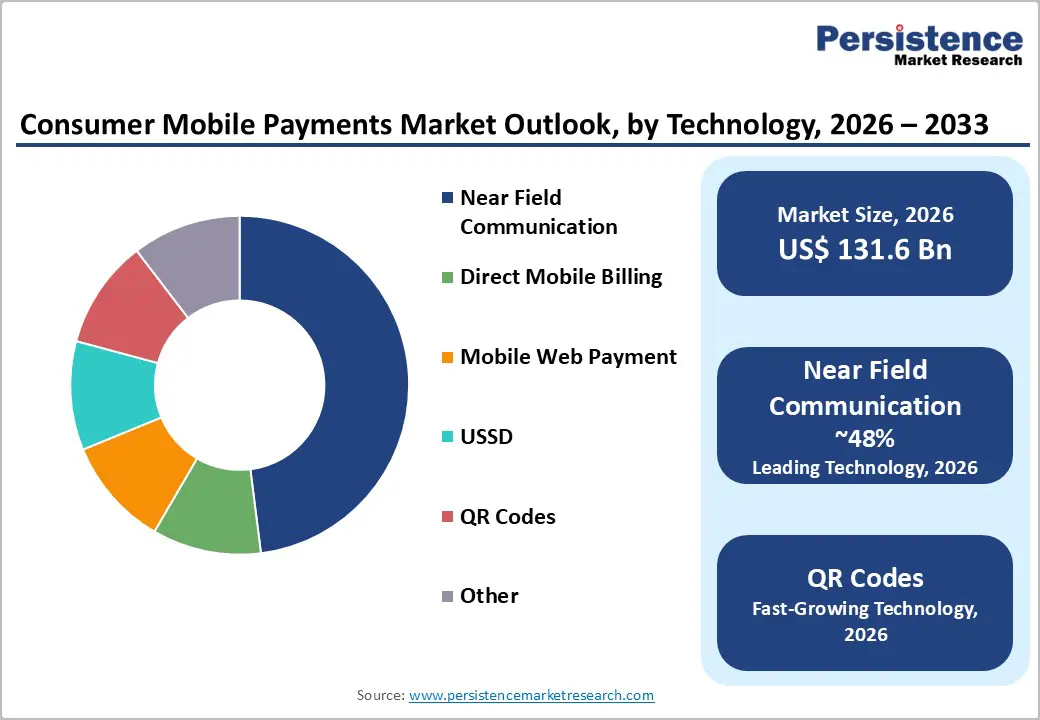
The global Consumer Mobile Payments market size is supposed to be valued at US$ 131.6 Bn in 2026 and is projected to reach US$ 744.9 Bn by 2033, growing at a CAGR of 28.1% between 2026 and 2033.
This robust expansion is driven by accelerating smartphone penetration, with consumers making an average of 11 mobile payments per month in 2024, up from just four payments in 2018, according to the Federal Reserve Services. The proliferation of secure payment technologies, including Near Field Communication (NFC) and biometric authentication, combined with government-led digital economy initiatives across emerging markets, continues to reshape traditional payment behaviors and drive cashless transaction adoption globally.
Key Market Highlights
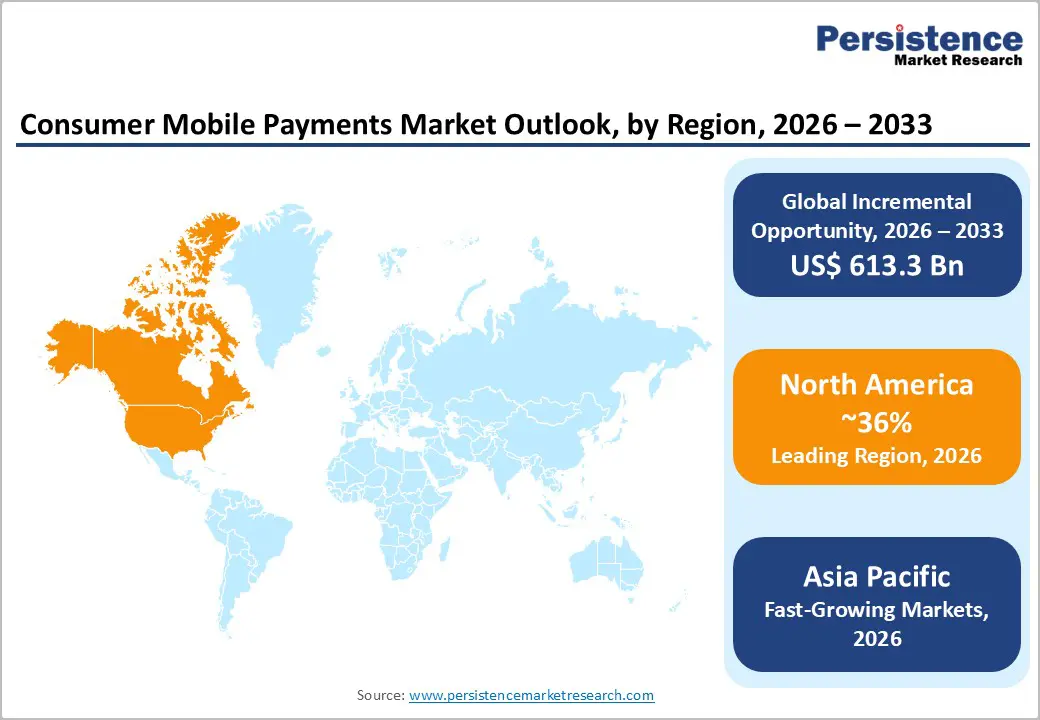
- Leading Region: North America dominates the Consumer Mobile Payments market, with 36% market share, through advanced payment infrastructure, regulatory stability, and high consumer digital payment literacy.
- Fastest Growing Region: Asia-Pacific demonstrates exceptional growth momentum, with China, India, and Indonesia leading adoption through smartphone proliferation, government digital payment initiatives, and regional payment platform dominance.
- Dominant Segment: Proximity payments powered by NFC and contactless technologies capture approximately 58% market share through consumer preference for speed, security, and ease-of-use, enabling tap-and-pay transactions globally and establishing dominance across retail, transportation, and hospitality verticals as the preferred payment mode.
- Fastest Growing Segment: QR Code payments demonstrate exceptional growth from US$ 36.8 billion in 2026 to projected US$ 290 billion by 2033 with 33.8% CAGR, driven by retail adoption reaching 36.8% market share and enabled by 67.8 crore active QR codes in India alone, representing accessibility and affordability advantages over NFC infrastructure.
- Key Market Opportunity: Buy Now, Pay Later (BNPL) integration into mobile wallets and Central Bank Digital Currency (CBDC) deployment across 130+ countries represent transformative opportunities, with BNPL growing 50%+ annually.
| Key Insights | Details |
|---|---|
| Consumer Mobile Payments Size (2026E) | US$ 131.6 Bn |
| Market Value Forecast (2033F) | US$ 744.9 Bn |
| Projected Growth CAGR (2026-2033) | 28.1% |
| Historical Market Growth (2020-2025) | 26.1% |
Market Dynamics
Market Growth Drivers
Explosive Growth in E-Commerce and Mobile-First Retail
The rapid expansion of e?commerce and mobile?first retail channels has become a key catalyst for the growth of the Consumer Mobile Payments market. Digital wallets now account for 50% of online purchases in 2024, underscoring strong consumer preference for seamless checkout experiences. Mobile commerce is expected to grow by 19.2% globally between 2019 and 2029, supported by significant regional momentum. The emergence of super?apps, particularly in Southeast Asia, has transformed consumer behavior by integrating shopping, transportation, food services, and financial activities into unified platforms.
Retailers are increasingly adopting mobile payment solutions such as Apple Pay, Google Pay, PhonePe, and Paytm to enhance convenience and reduce checkout friction. Additionally, fast?commerce platforms reliant on app?based transactions have accelerated adoption, with studies indicating that mobile payments reduce cart abandonment by up to 40%.
Rising Smartphone Penetration and Enhanced Device Security
The surge in smartphone adoption, particularly in Asia-Pacific with over 750 million active users, coupled with advanced biometric security, is driving significant growth in mobile payments. Digital wallet penetration has reached 90.8% in India and 87.3% in China, underscoring rapid adoption across emerging markets. Apple Pay exemplifies commercial viability, processing US$ 6 trillion in transactions in 2022 and generating US$ 1.9 billion annually.
Regulatory evolution in the European Union, transitioning from PSD2 to PSD3 by 2026-2027, introduces standardized APIs, expands oversight to BNPL and cryptocurrency platforms, and enforces stronger authentication protocols. Biometric technologies such as facial recognition and fingerprint verification have enhanced consumer trust, reducing fraud risks by 45%. Additionally, iOS 18.1 introduced in-app NFC capabilities, enabling broader payment integration beyond proprietary wallets and fostering greater accessibility.
Market Restraints
Persistent Security Concerns and Cybersecurity Threats
Persistent security vulnerabilities and rising cybersecurity threats continue to be critical impediments to mobile payment adoption. High-profile data breaches have eroded consumer trust, with 38% of users citing privacy concerns as a primary barrier. Advanced phishing schemes, SIM-swap attacks, and unauthorized account access surged in 2024-2025, disproportionately impacting markets with lower digital literacy. Recorded Future reported 269 million compromised card records and 1.9 million stolen U.S. checks posted online in 2024, highlighting systemic risks.
Card-not-present fraud escalated alongside remote transactions, contributing to $12.5 billion in consumer losses, a 25% increase over 2023, per FTC data, with investment and imposter scams accounting for $5.7 billion. Additionally, Magecart e-skimmer infections tripled due to payment system vulnerabilities. PCI DSS compliance imposes high costs on smaller merchants, while global fraud losses exceeded $14.2 billion, constraining growth in emerging economies.
Infrastructure Limitations and Digital Divide Challenges
Despite significant technological progress, infrastructure limitations continue to hinder mobile payment adoption across certain regions and demographic segments. Although nearly all smartphones are expected to feature NFC capabilities by 2027, many sub-USD 150 devices in price-sensitive markets lack the required hardware or experience battery performance issues due to always-on radio functionality. Consumer behavior also poses challenges, such as 93% of Malaysians still prefer cash for dining transactions despite government-led cashless initiatives, reflecting entrenched habits resistant to digital transformation.
Additional barriers include inadequate internet connectivity in rural areas, limited merchant acceptance among small and medium enterprises, and generational gaps in digital literacy. Furthermore, transaction fees disproportionately affecting low-value purchases reinforce the economic rationale for cash usage, slowing the pace of mobile payment penetration in emerging markets.
Market Opportunities
Explosive Growth in Buy Now, Pay Later (BNPL) and Installment Payments
The integration of Buy Now, Pay Later (BNPL) and installment payment solutions within mobile wallets presents significant growth potential. The BNPL market expanded by over 50% year-on-year during 2024 and 2025, driven by major players such as Square, Inc., and PayPal Holdings, Inc., which enhanced their installment offerings. Leading platforms, including Google Pay and Apple Pay, introduced credit features enabling consumers to convert transactions into manageable installments without additional applications.
Such innovations address the rising demand for flexible payment options and boost average transaction values by 25-35%. Emerging markets such as India, Indonesia, and Brazil exhibit strong BNPL adoption due to income distribution patterns and limited access to traditional credit. Furthermore, investments exceeding US$400 million by Fiserv, Inc. and ACI Worldwide Inc. in BNPL technologies underscore confidence in its growth trajectory and revenue potential.
Central Bank Digital Currencies (CBDCs) and Cross-Border Mobile Payments
Central Bank Digital Currencies (CBDCs) and cross-border mobile payment corridors represent a transformative opportunity for global market expansion. As of 2025, more than 130 countries are actively developing or piloting CBDC initiatives, with China’s Digital Currency Electronic Payment (DCEP), Sweden’s e-Krona, and the European Central Bank’s Digital Euro advancing toward retail deployment. China’s e-CNY pilot has demonstrated successful integration with Alipay and WeChat Pay, creating hybrid ecosystems that combine regulatory oversight with consumer convenience.
Similar initiatives, including India’s digital rupee trials, Thailand’s retail CBDC programs, and Singapore’s Project Orchid, reflect coordinated strategies to leverage mobile wallet networks while maintaining monetary policy control. These developments will enable frictionless cross-border transactions, reduce remittance costs by up to 70%, and unlock a US$50 trillion opportunity, positioning CBDCs as the most significant growth driver for mobile payments.
Category-wise Insights
Mode of Payment Analysis
Proximity payments have emerged as the dominant mode within the Consumer Mobile Payments Market, accounting for approximately 58% of market share as consumers increasingly favor tap-and-go transactions at retail outlets, quick-service restaurants, and public transportation systems. According to McKinsey’s Digital Payments Survey, in-store digital wallet adoption in the United States rose from 19% in 2019 to 28% in 2024, representing nearly $10 trillion in transaction value.
This segment demonstrates stronger growth potential compared to remote payment channels, driven by consumer preference for speed, security, and immediate transaction confirmation. Apple Pay exemplifies this trend, commanding 54% of U.S. in-store mobile wallet transactions. Asia-Pacific markets, including Japan with 96% NFC merchant acceptance and South Korea with 78% NFC adoption, reinforce global leadership. Similarly, the UK reported one in three consumers using mobile contactless payments monthly in 2023.
Technology Analysis
Near Field Communication (NFC) has emerged as the leading technology segment, accounting for approximately 48% of market share by 2025. Apple Pay processes approximately $8.7 trillion worldwide in 2025, with 32% of all U.S. contactless point-of-sale activity utilizing NFC technology. Global adoption has been driven by Apple Pay and Google Wallet, which standardized NFC across consumer devices, supported by 11,000 banks in over 90 countries for Apple Pay and availability in 86 countries for Google Wallet.
In 2026, Samsung Electronics and UnionPay International introduced integrated NFC-QR payment services in Shanghai and Hong Kong, signaling the convergence of complementary technologies. Meanwhile, QR Code payments, holding 28% market share, are expected to grow from US$36.8 billion in 2026 to US$290 billion by 2033, ensuring a diversified and resilient payment technology landscape.
End-use Industry Analysis
Retail leads the end-use industry segment, holding approximately 46% market share as of 2025. This dominance is driven by the seamless integration of mobile payments with omnichannel retail strategies and the rapid growth of online shopping platforms. In 2024, global retail and e-commerce merchants processed over US$2.8 trillion in mobile payment transactions, accounting for 38% of total retail commerce.
Digital wallet penetration for in-app purchases in the United States reached 60%, an increase of eight percentage points since 2019. Major Fortune 500 retailers, including Walmart and Amazon, have implemented mobile payment acceptance across 99% of store locations, making it a core retail infrastructure. Hospitality and tourism accelerated adoption to 62% of transactions by 2025, while BFSI integration within banking apps and fintech platforms further enhanced consumer convenience and competitive dynamics.
Regional Insights
North America Consumer Mobile Payments Trends
North America has established itself as a mature, high-value Consumer Mobile Payments market, supported by advanced payment infrastructure and strong consumer familiarity with digital transactions. U.S. proximity mobile payment transactions reached US$670.5 billion in 2024 and are projected to surpass US$1 trillion by 2027, reflecting 156% growth over three years. Apple Pay leads the market with 60.2 million U.S. users in 2024, expected to exceed 75 million by 2030, capturing 54% of in-store mobile wallet transactions. Google Wallet maintains a significant presence with approximately 48.6 million users. Regulatory frameworks such as the Electronic Fund Transfer Act (EFTA) and state-level regulations have fostered a stable environment for adoption. Infrastructure investments exceeding US$3.2 billion in 2024 by ACI Worldwide, Fiserv, and FIS modernized merchant systems, while softPOS solutions and Square’s 24 million active users exemplify innovation-driven growth.
Europe Consumer Mobile Payments Trends
Europe demonstrates strong progress in Consumer Mobile Payments adoption, driven by regulatory harmonization and heightened consumer privacy standards. By 2025, 52% of European online shoppers preferred digital wallets over traditional payment methods, with Nordic countries achieving 76% penetration for physical transactions. The transition from PSD2 to PSD3, agreed in January 2025 and expected to be fully implemented by 2026–2027, will broaden regulatory scope to include instant payments, BNPL solutions, cryptocurrency platforms, and digital identity services.
PSD2’s Strong Customer Authentication (SCA) requirements significantly reduced online fraud, while PSD3’s standardized APIs are set to accelerate Open Banking innovation. Worldline reported a 78% increase in mobile payment usage among Italian consumers post-regulation. The UK leads with 91% adoption for point-of-sale transactions, while the European Central Bank’s Digital Euro initiative signals future convergence with mobile payment ecosystems.
Asia Pacific Consumer Mobile Payments Trends
Asia-Pacific is the fastest-growing regional market for consumer mobile payments, driven by government-led cashless initiatives, widespread smartphone penetration, and the evolution of integrated digital payment ecosystems. Mobile wallets have become the leading point-of-sale payment method, with their share projected to increase from 50% in 2023 to over 60% by 2027.
China has achieved near-universal adoption, with Alipay and WeChat Pay controlling more than 90% of the digital wallet market. India leads globally with 90.8% penetration, supported by its UPI infrastructure, which processed 18.1 billion transactions worth ?24.04 trillion by June 2025. Government programs, including India’s ?1,500 crore BHIM-UPI initiative, have accelerated financial inclusion. Additionally, Africa recorded a 35% rise in mobile money users in 2024, while Latin America saw 50% annual growth, led by Brazil’s Pix system capturing 44% of online payments.
Competitive Landscape
Market Structure Analysis
The Consumer Mobile Payments market reflects a consolidating structure dominated by global platforms alongside regional leaders and emerging fintech innovators. Apple Pay, Google Wallet, and Alipay collectively account for approximately 62% of global digital wallet transaction value, creating oligopolistic dynamics in developed markets. Conversely, Asia-Pacific remains highly fragmented, with regional players such as Paytm, PhonePe, WeChat Pay, and UnionPay competing through localized features and regulatory compliance. Market consolidation has accelerated via strategic acquisitions, including Fiserv’s platform expansions and Square’s infrastructure development. Competitive differentiation increasingly relies on biometric authentication, BNPL integration, cross-border payment capabilities, and region-specific compliance frameworks. Companies leveraging AI-driven fraud detection and predictive analytics report transaction success rates 15-20% above industry norms, while emerging SoftPOS solutions enabling smartphones to accept contactless payments without terminals are reshaping SME adoption and challenging traditional hardware providers.
Key Market Developments
- July 2024: Alipay, China's leading mobile payments provider, introduced Alipay Tap!, marking the first adoption of NFC-based contactless payment services by a major Chinese platform, enabling users to complete transactions by tapping unlocked smartphones on merchant terminals or dedicated tags without app opening requirements.
- January 2026: Samsung Electronics and UnionPay International jointly introduced an integrated NFC-QR all-in-one mobile payment service in Shanghai, adding UnionPay cards to Samsung Wallet and expanding to Hong Kong SAR through BOC Credit Card integration, demonstrating the convergence of complementary payment technologies.
- December 2024: The National Payments Corporation of India (NPCI) removed user cap restrictions on WhatsApp Pay, enabling Meta to offer UPI services to the platform's entire 853.8 million Indian user base, resulting in 61 million transactions recorded in January 2025 compared to 26.08 million in January 2024.
Top Companies in Consumer Mobile Payments
Apple Inc. (Cupertino, U.S.) - Apple Inc. dominates global mobile payments through Apple Pay, commanding 54% of the U.S. in-store mobile wallet market share and servicing 640 million global users by 2025. With 85% of U.S. retailers accepting Apple Pay and seamless iOS integration, Apple Inc. established unparalleled consumer trust and transaction volume among developed market payment platforms, maintaining market leadership through continuous feature innovation, including biometric authentication and NFC security enhancements.
Google LLC (Mountain View, U.S.) - Google LLC operates Google Wallet, serving 200-250 million global users with availability in approximately 86 countries. Google Wallet enabled 48.6 million U.S. users by 2025, with projections reaching 57 million by 2028, demonstrating consistent growth in competitive American markets. Google's open Android NFC architecture provides flexible payment integration across diverse merchant ecosystems, enabling ticket sharing, file transfer capabilities, and Wear OS smartwatch integration, establishing competitive differentiation through technical flexibility and ecosystem breadth beyond pure payment functionality.
Visa Inc. (San Francisco, U.S.) - Visa Inc. functioned as a critical payment infrastructure provider, enabling mobile wallet integrations for Apple Pay, Google Wallet, and regional payment platforms. Visa's global merchant network, exceeding 80 million acceptance locations, provided essential infrastructure for mobile payment ecosystem expansion. Visa's investment in tokenization technology and biometric authentication standardization across payment networks created a foundational security infrastructure, enabling consumer confidence in mobile payment systems globally.
Companies Covered in Consumer Mobile Payments Market
• Apple Inc.
• Google LLC
• ACI Worldwide Inc.
• DH Corp
• Fidelity National Information Services, Inc.
• Fiserv, Inc.
• Jack Henry & Associates Inc.
• MasterCard Incorporated
• PayPal Holdings, Inc.
• Square, Inc.
• Visa Inc.
Frequently Asked Questions
The global Consumer Mobile Payments market is valued at US$ 131.6 Bn in 2026 and projected to reach US$ 744.9 Bn by 2033, representing growth at 28.1% CAGR over the 2026-2033 period, demonstrating accelerating market momentum.
Primary demand drivers include explosive e-commerce growth with mobile commerce exceeding 60% of digital transactions globally, rising smartphone penetration reaching 750 million+ users in Asia-Pacific alone, and post-pandemic consumer preference for contactless transactions with digital wallets adopted by 5.3 billion users by 2026.
Near Field Communication (NFC) dominates the technology segment with approximately 48% market share, driven by Apple Pay's dominance with 640 million global users, 11,000 supporting banks, and 90 countries' availability, alongside Google Wallet's 200-250 million users across 86 countries, establishing NFC as the preferred proximity payment technology globally.
North America dominates the market with U.S. proximity mobile payments reaching US$ 670.5 Bn in 2024. Apple Pay's 54% in-store wallet market share, 85% retailer acceptance rates, and advanced payment infrastructure investment exceeding US$ 3.2 Bn in 2024 through ACI Worldwide Inc., Fiserv, Inc., and FIS, establishing mature regulatory environments and consumer digital literacy, enabling market leadership across developed payment ecosystems.
Buy Now, Pay Later (BNPL) and Central Bank Digital Currency (CBDC) integration represent transformative opportunities, with the BNPL market growing 50%+ annually and Square, Inc. plus PayPal Holdings, Inc. investing US$ 400 Mn+ in 2024, while CBDC deployment across 130+ countries, including China's DCEP, Sweden's e-Krona, and the European Central Bank's Digital Euro enable frictionless cross-border transactions and capture estimated US$ 50 trillion international payment opportunity.
Key market leaders include Apple Inc., Google LLC, Visa Inc., MasterCard Incorporated, and regional powerhouses, including Alipay, WeChat Pay, alongside India's UPI ecosystem, processing 18.1 billion transactions monthly.


