


- Display Technologies
- Holographic Display Market
Holographic Display Market Size, Share, and Growth Forecast, 2026 - 2033
Holographic Display Market by Component (Scanners, Monitors, Digital Micrometers, Lenses, and Light Modular), Technology (Electro-holographic, Touchable Laser Piston By Dimension (2D, 3D, and 4D), End-user (Digital Signage, CT and MRI, Smart TV, Medical Imaging, Camera, and Others), Vertical (Consumer Electronics, Retail, Healthcare, Industrial, National Defense, and Misc.), and Regional Analysis for 2026 - 2033
Holographic Display Market Size and Trends Analysis
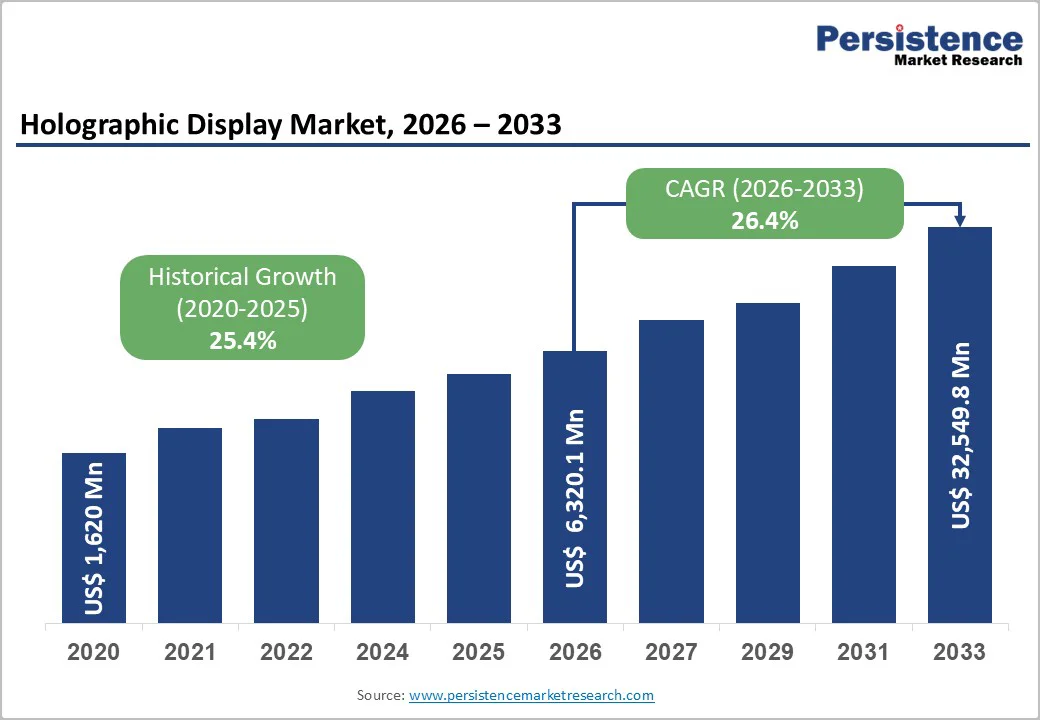
The global holographic display market size is projected to rise from US$ 6,320.1 million in 2026 to US$ 32,549.8 million by 2033. It is anticipated to grow at a CAGR of 26.4% from 2026 to 2033.
Holographic displays are changing how users experience digital content by using light to create 2D, 3D, and even 4D images that can be viewed from multiple angles without using special glasses or headsets. This technology offers a highly immersive and interactive experience for entertainment and advertising.
Hence, the demand for high-quality, realistic visuals is pushing the need for better holographic displays. With their ability to captivate and engage, they’re becoming a game-changer in how users consume digital content.
Key Industry Highlights:
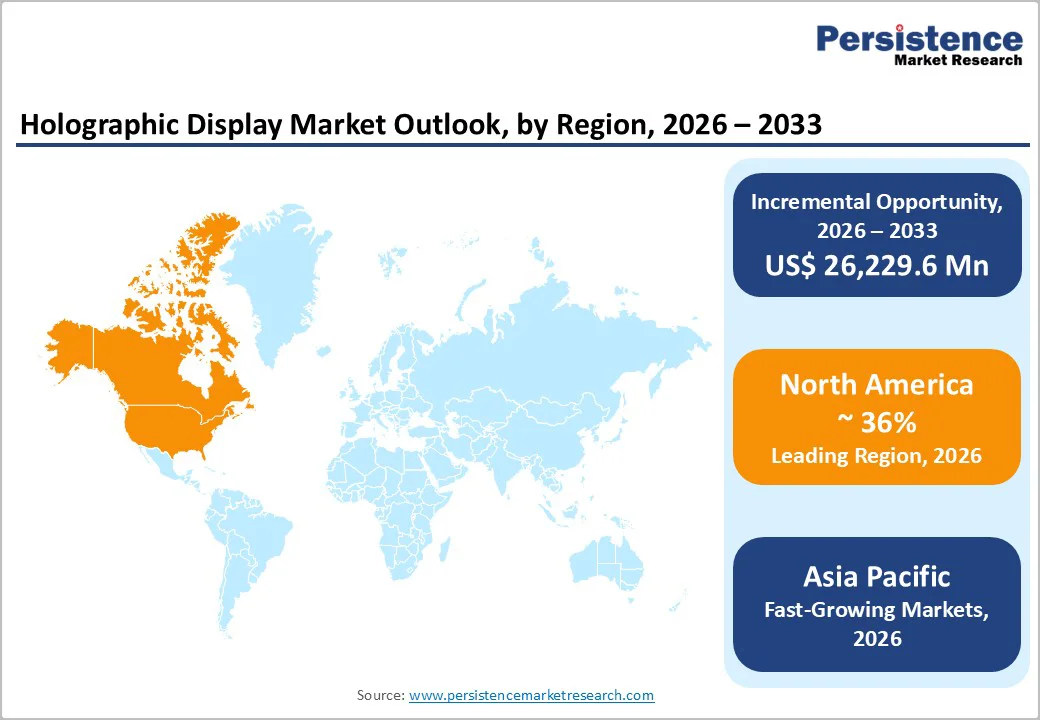
- Regional Analysis: North America is estimated to hold a 36.9% share in 2026, owing to the region's strong technological advancements and high consumer demand for innovative and interactive experiences.
- Segmental Analysis: Electro-Holography is projected to hold a 71.3% share in 2026, driven by its superior ability to render dynamic, real-time images with high resolution and depth perception.
- The retail sector is expected to account for 30.5% of total retail sales in 2026, driven by the growing adoption of immersive technologies to enhance customer engagement and the in-store experience.
- Artificial Intelligence (AI) is optimizing hologram generation by reducing computational complexity and enabling real-time rendering with deep learning algorithms, significantly improving image quality.
- Spatial light modulators (SLMs) are enhancing holographic displays by improving resolution, refresh rates, and phase modulation capabilities, leading to better depth perception and clarity.
| Key Insights | Details |
|---|---|
| Holographic Display Market Size (2026E) | US$ 6,320.1 Mn |
| Market Value Forecast (2033F) | US$ 32,549.8 Mn |
| Projected Growth (CAGR 2026 to 2033) | 26.4%% |
| Historical Market Growth (CAGR 2019 to 2025) | 25.4% |
Market Dynamics
Drivers - Immersive Retail Experiences Driving Holographic Display Adoption
Holographic displays are revolutionizing consumer engagement by creating immersive, three-dimensional experiences in retail environments. Customers can explore products from various angles, enhancing their shopping experience and helping them make informed decisions.
For example, jewelry stores use holograms to showcase intricate designs, offering a more detailed view than traditional photos. This level of interaction is also evident in interactive advertisements, with brands such as Kellogg’s seeing a 60% increase in Special K cereal sales in French stores after adopting holographic ads.
The integration of holograms with digital signage further elevates brand engagement by replacing static displays with dynamic, floating visuals. Luxury brands, such as watch retailers, have used holographic ads to present products in fine detail, leading to stronger customer connections and a premium brand image.
For instance, a fashion brand using holographic mannequins saw a 20% sales boost, while a consumer electronics store reported a 15% increase after showcasing products via 3D holograms. These innovative approaches are driving the market growth.
Restraint - Real-Time Rendering and System Performance
The systems face significant hurdles in achieving the clarity and precision by traditional displays such as LCDs and LEDs in the fields of medical imaging and scientific visualization. For example, current holographic technology struggles to match the detail required for precise diagnostics, while its lower refresh rates make it less effective for dynamic applications, such as gaming and live broadcasting, where real-time responsiveness is crucial.
Moreover, rendering complex 3D holograms in real-time demands immense computational power, burdening system processors. As holograms grow in size or wider viewing angles are sought, image clarity often suffers. In healthcare, holograms are promising for surgical monitoring and diagnostics; however, their high costs and the need for infrastructure upgrades challenge widespread adoption.
Opportunity - Shift Towards Touchless Solutions
The COVID-19 pandemic altered digital solutions, pushing the demand for touchless technology into the spotlight. As a result, holographic displays capable of projecting interactive 3D images into space are gaining traction in places where hygiene matters most, such as hospitals, public transport, and retail spaces.
Healthcare, in particular, benefited significantly from this technology. In the U.K., the NHS reported a 26% jump in imaging activity in 2022, with 44 million tests conducted, up from 34.9 million the year before, highlighting the growing demand for advanced visual tools.
Companies such as Holo Industries are meeting this need with contactless holographic displays that use Neonode sensors and ASKA3D plates to create touchless human-machine interfaces (HMIs). From hospital operating rooms to restaurant kiosks and elevators, these germ-free solutions are shaping the future of interaction.
Category - wise Analysis
Technology Insights
Based on technology, the market is divided into electro-holographic, touchable, laser, and piston. Among these, Electro-holographic is projected to account for nearly 71.3% of the holographic display market share in 2026. This technology offers a true three-dimensional visual experience without the need for glasses or headgear.
The electro-holography captures and reconstructs the light field of an object, creating incredibly realistic depth, motion, and parallax. This realism is driving its adoption across a range of industries, from advertising and automotive design to medical imaging and education.
Touchable, on the other hand, is expected to grow at a significant rate during the forecast period. As digital experiences continue to evolve, there's a growing demand for more natural, interactive ways to engage with content, and that's exactly where touchable holograms come in.
Industry Insights
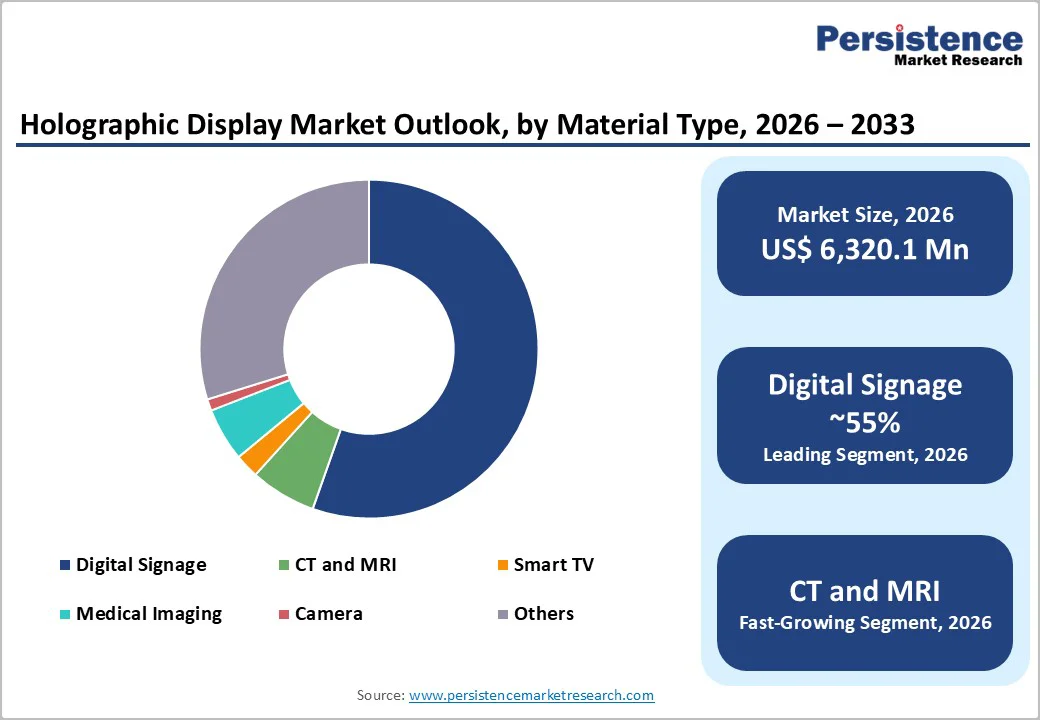
By industry, the holographic display market is segregated into consumer electronics, retail, healthcare, industrial, national defense, and others. The retail segment is expected to account for 30.5% of the market in 2026 due to growing demand for innovative, interactive, and visually engaging customer experiences.
It enables retailers to create immersive, futuristic environments that capture customers' attention and enhance the in-store experience. For example, global brands such as Nike, Adidas, and Samsung have used 3D holograms in their flagship stores to showcase product features and dynamic visuals that traditional displays cannot match.
The industrial sector is expected to grow rapidly due to the rising demand for innovative visualization techniques for training, product design, maintenance, and product prototyping.
For example, in automotive manufacturing, holographic displays are used to visualize car designs in 3D dimensions, allowing engineers and designers to interact with and modify virtual prototypes without physical models. This reduces the need for expensive prototypes and shortens product development cycles.
Regional Insights and Trends
North America Leads Holographic Displays Market Driven by Technology Investments
North America is projected to account for a market share above 36% in 2026. This is attributed to significant technology investments and the widespread adoption of holographic displays across sectors such as healthcare, defense, and education. Initiatives such as the National Science Foundation’s funding for advanced display technologies drive the digital growth in the U.S.
In the commercial sector, companies such as Microsoft and Google have been instrumental in integrating holographic displays into their products. Microsoft’s HoloLens, a mixed-reality headset, has seen widespread adoption in industries such as manufacturing and healthcare, improving training and operational efficiency.
Similarly, Google’s Project Starline aims to revolutionize virtual communication by creating life-sized, 3D holographic video calls, which are currently being tested in various business environments across the U.S.
China Leads Asia Pacific Holographic Displays Through 5G and Smart Cities
China is estimated to lead countries such as Japan and South Korea in the Asia-Pacific through 2033. The country's significant investments in 5G infrastructure and artificial intelligence (AI) have fueled this progress.
As a result, the Chinese holographic display market has seen substantial growth, driven by rising consumer electronics sales and growing demand in digital signage and automotive applications. For instance, UnionPay uses 500 million holograms annually, valued at US$ 55 million.
South Korea's commitment to smart city development is evident through its K-Smart City initiative. The country's 4th Smart City Comprehensive Plan (2024 - 2029) emphasizes integrating advanced technologies, including holographic displays, to enhance urban living.
Seoul is leading the smart city initiative by deploying 50,000 IoT sensors to monitor social activity. The curated data is expected to improve city management and traffic conditions.
Europe Advances Holographic Technologies Across Automotive, Healthcare, and Industry 4.0
In Europe, German automotive manufacturers are exploring holographic technology for advanced driver-assistance systems (ADAS) and in-car infotainment, aiming to enhance user experience and safety. The German government's commitment to Industry 4.0 initiatives supports this trend, fostering innovation in the manufacturing and technology sectors.
The U.K. is witnessing growth in digital holography, with applications spanning microscopy, holographic displays, and telepresence. British medical institutions are adopting holographic imaging for surgical planning and medical training, improving precision and outcomes.
The National Health Service (NHS) supports pilot programs using holography techniques to visualize complex anatomical structures, indicating strong governmental support for such technological advancements.
Competitive Landscape
The global holographic display market is highly fragmented, with numerous startups, technology firms, and established players introducing innovative solutions.
Companies such as Looking Glass Factory, Holoxica, and RealView Imaging are investing in light field displays, laser-based holography, and AI-driven image processing to create more realistic and interactive 3D visuals. These innovations enhance user experience in sectors such as automotive, healthcare, retail, and entertainment.
Key Industry Developments:
- In February 2025, Xiaomi India partnered with Khushi D3X to unveil a groundbreaking marketing campaign for the Redmi Note 14 Pro+ 5G, leveraging PRISMOX anamorphic and Hypervsn holographic technologies. The campaign features an 8K anamorphic display at Nexus Hyderabad Mall, creating a striking 360-degree visual experience.
- In December 2024, Looking Glass Integrated Unity-based iOS support for its holographic displays, enabling the latest iPhones and iPads to power multiview 3D experiences without needing a PC. This boosts portability and cuts deployment costs.
- In October 2024, Data Vault Holdings, Inc. launched DVHolo, a cutting-edge 3D holographic product suite developed with HYPERVSN and powered by ADIO. Designed for advertising, signage, and events, DVHolo boosts viewer engagement by 40%, doubles visibility, and increases product sales by up to 40%.
Companies Covered in Holographic Display Market
- Holotec
- Holoxica Ltd
- HYPERVSN
- RealView Imaging Ltd.
- VIRTUAL ON LTD
- Realfiction Holdings AB
- Continental AG
- HY-LINE
- VividQ Ltd
- Looking Glass Factory Inc.
- Other Market Players
Frequently Asked Questions
The Holographic Display market is estimated to be valued at US$ 6,320.1 Mn in 2026.
The primary demand driver for the holographic display market is the rising adoption of immersive visualization technologies across entertainment, advertising, medical imaging, and automotive applications.
In 2026, the North America region will dominate the market with an exceeding 36% revenue share in the global Holographic Display market.
Among end-users, Digital Signage has the highest preference, capturing beyond 55% of the market revenue share in 2026, surpassing other end-users.
Holotec, Holoxica Ltd, HYPERVSN, RealView Imaging Ltd., VIRTUAL ON LTD, Realfiction Holdings AB, Continental AG are a few leading players in the Holographic Display market.


