Radar Sensor Market Size, Share, and Growth Forecast for 2025 - 2032

Radar Sensor Market by Type (Imaging Radar, CW Radar, Pulse Radar, Non-imaging Radar, Speed Gauge, Altimeter), by Technology (Time Domain Reflectometry - TDR, Ultra-Wideband - UWB, RF MEMS-based Radar Sensors, Millimeter Wave), by Component (Antenna, Duplexer, Transmitter, Receiver, Video Amplifier), and Regional Analysis

ID: PMRREP33474
Calendar

August 2025

198 Pages

Author : Rajat Zope

Radar Sensor Market Size and Share Analysis

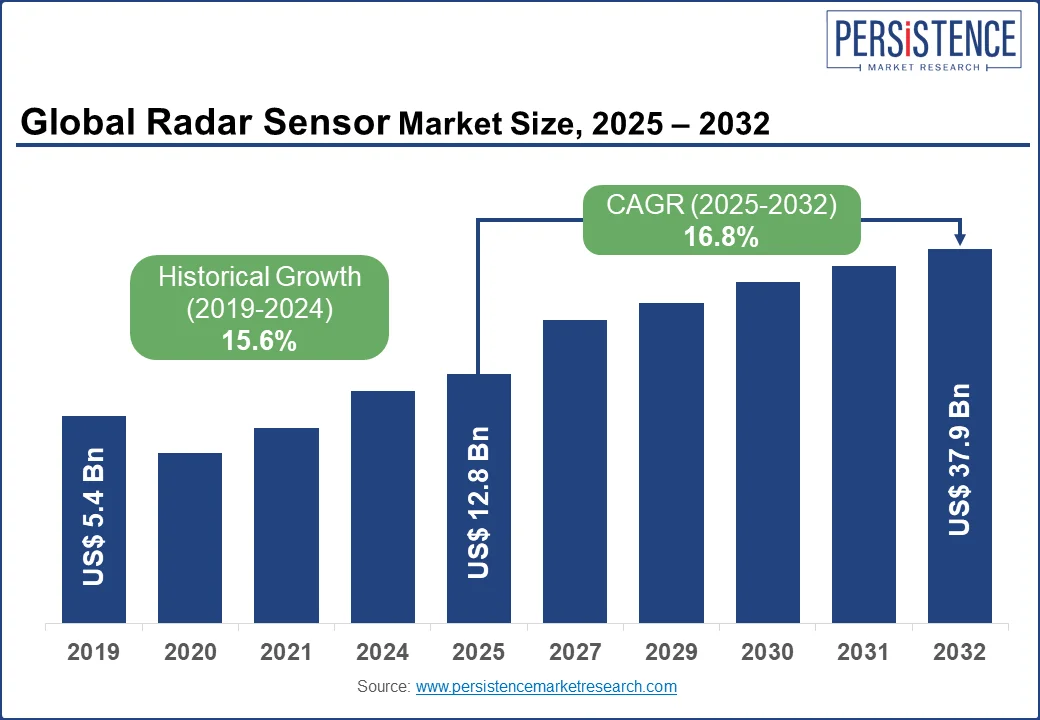
The global radar sensor market is predicted to reach US$ 12.8 billion by 2025, with a CAGR of 16.8%. As a result, revenues are expected to reach US$ 37.9 billion by 2032. With the development of semiconductor technology in recent years, radar has significantly reduced its power consumption and size. The capabilities of the system have also been enhanced, which have been improved through multiple transmissions and receptions, ultra-wideband technology, millimeter-wave technology, signal processing technology, and ICs with increasingly sophisticated processing capabilities.

With the aging of the population, there are more fall accidents and cognitive illnesses like Alzheimer's. In addition to reducing suffering, preventative measures can also reduce costs. About 100,000 people older than 65 in Sweden require medical care after sustaining a bad fall, including 70,000 in hospitals. The number of elderly people who die from fall accidents each year is approximately 1,000. Fall accidents lead to three million visits to emergency departments each year among elderly Americans.

Radar Sensor Market Size 2025 - 2032

An innovative radar sensor developed by Swedish researchers can predict falls and cognitive diseases such as Alzheimer's. A radar sensor developed by Chalmers University of Technology is able to detect a person's walking pattern in homes and healthcare facilities, which can be mounted to walls, furniture, or ceilings.

Report Attributes Details

Radar Sensor Market Size (2025)

US$ 12.8 billion

Radar Sensor Projected Market Value (2032)

US$ 37.9 billion

Radar Sensor Market CAGR (2025 to 2032)

16.8%

United States Market Size (2032)

US$ 14.6 billion

China Market Size (2032)

US$ 3.7 billion

Sales of Radar Sensors are Predicted to Rise From 2025 to 2032 from 2019 to 2024

According to Persistence Market Research (PMR), radar sensor revenues grew by 19% CAGR between 2019 and 2024. Analysts predict that sales across the globe will grow by 16.8% between 2025 and 2032.

Radar sensors offer several benefits, which have led many businesses and government agencies to increase their research and development efforts, which are likely to have a positive impact on the market.

Surveillance systems are becoming increasingly common in military forces, and security concerns are increasing across the globe. New security and monitoring systems are being integrated by governments from several nations to increase their military power.

As the military and defense markets continue to grow, the increasing demand for intelligent targeting, countermeasures, navigation, and missile guidance for military and defense applications is contributing to this growth.

In 2019, there were an estimated 6.4 billion devices that were connected, according to the National Cybersecurity Center of Excellence. Approximately 20 billion devices were expected to be in use by 2020. As a result of the high level of demand for radar sensing technologies, market players continually innovate, reducing the competitiveness of their competitors.

What are the Key Factors Driving the Radar Sensor Market?

“Automation and Industry 4.0 to Drive Demand for Radar Sensor Market.”

Growing demand for the Internet of Things (IoT) and smart devices among developing nations is expected to drive market growth for radar sensors. With improved performance in different temperature and lighting conditions, these sensors are accelerating the demand for smart home devices for automation and security.

Over the next few years, improvements in automotive safety systems and autonomous driving are expected to drive demand. In the next few years, radar sensors are expected to become more prevalent as the development of medical devices grows. Moreover, sensor fusion and railway integration are driving the market's growth, as is the popularity of sensor fusion technology.

Systems such as adaptive cruise control and collision avoidance utilize these sensors to sense the environment. As security systems grow in sophistication, and advances and applications of high-tech technologies are being made in the market, the demand for radar sensors is expected to increase.

Due to the growth of the industrial sector, it has become increasingly necessary to integrate radar sensors into their designs, thus driving the global radar sensor market to grow. The use of radar sensors is common in industrial applications for detecting and tracking moving objects. All these factors are expected to drive demand for radar sensors in the market.

Country-wise Insights

How Fast is the Growth of the Radar Sensor Market in North America?

“New Technologies and the Increasing Demand for Autonomous Vehicles is Likely to Drive Demand in the Radar Sensor Market.”

The radar sensor market is expected to be dominated by North America. According to PMR, the North American radar sensor market will reach US$ 18.72 billion by 2032.

Technology advancements are being supported by increasing investments in the region. With increased security and surveillance focuses in the region, along with projected growth in radar sensor markets, radar sensor production is likely to increase.

As smartphones and wearable devices become more prevalent, there will be an increase in the demand for radar sensors in the market. As smartphone manufacturers integrate more sensors and features into their smartphones, the demand for radar sensors is also expected to increase. North America will have nearly 270 million mobile connections by the end of 2025, according to the GSMA.

The United States is expected to account for 78% of all market share during the forecast period. In 2032, revenues for the radar sensor market are projected to reach US$ 14.6 billion, growing at a CAGR of 15.5%.

Vehicle advancements and growing automobile purchases are likely to drive demand for the product. Recently, with the release of Automated Vehicles 3.0 by the NHTSA, new federal guidelines for automated vehicles have been released that have expanded the market for ADAS in mid-range vehicles, increasing production. Radar sensors are becoming increasingly popular among various brands. As a result of these factors is experiencing significant growth in the market.

What Role do Radars Hold in the Asia-Pacific Region?

“Expanding Government Initiatives and Military Investments are Likely to Increase Demand for Radar Sensor Market.”

The radar sensor market is expected to be dominated by Asian markets in the near future. According to estimates, the radar sensor market is estimated to be worth US$ 10.62 billion by the year 2032. According to PMR, the Chinese market will account for 35% of the market in 2032.

With the rise of the manufacturing industry, robots, and industrial automation are becoming more popular. The rise of disposable incomes, rising living standards, and technological advancements in automotive also contribute to the growth of the industry.

As the government takes initiatives to implement radar sensors in a variety of aerospace applications, which has resulted in a rapid growth of the market in Asia Pacific. Growing advances in the naval industry, as well as the growth of the internet in these regions, have increased the demand for radar sensors.

China, Japan, India, and South Korea are expected to show rapid growth for radar sensors in the coming years. It is estimated that China will generate US$ 3.7 billion by 2032. Between 2025 and 2032, the radar sensor market in China is projected to grow at a CAGR of 17.9%.

With increasing initiatives by government agencies to introduce safety systems into vehicles to mitigate the risk of accidents, the radar sensor market is expected to grow. These systems are also being incorporated into high-end commercial vehicles and motor vehicles around the world, enhancing road safety. All these factors are expected to grow demand for radar systems in the Asia Pacific region.

Category-wise Insight

Which Type of Radar Sensors are Driving Market Growth?

“Growing Innovations in Imaging Technologies are Expected to Grow Market.”

Based on type, the market is segmented into imaging radar, CW radar, pulse radar, non-imaging radar, speed gauge, and altimeter.

Radar-based sensors are intended to bridge the gap between current-generation lidars and radars, while RF sensors maintain their advantages over current-generation radars.

Imaging radar sensors are becoming increasingly popular among security, surveillance, and weather forecasting applications, resulting in the growth of the market for industrial and commercial applications.

Various businesses committed to innovation, companies continue to develop 4-D imaging radars to promote the acceptance of advanced automotive safety systems. As a result of 4D imaging radars, the capabilities of autonomous driving will be increased to 300 meters, allowing the market to expand.

As infrastructure projects become more demanding, radar technology is adopted more frequently in defense and security applications, and autonomous vehicles are increasingly being developed. Using artificial intelligence and machine learning to improve the quality of radar images, developing lightweight, compact radar systems, and the growing use of multi-sensor systems for enhancing situational awareness all represent advanced radar technologies.

What will be the Dominant Radar Sensor Application on the Market?

“The Automotive Segment is Likely to Lead the Radar Sensor Market.”

Demand for radar sensors is expected to rise in the automation segment. By 2032, the radar sensor market for automotive is expected to grow at a CAGR of 16.5%. The demand for automation and the development of advanced technologies will contribute to the growth of the radar sensor market in the automotive industry.

Growing sensors and technologies demand building autonomous vehicles to monitor their environment including cameras, LIDAR (Light Detection and Ranging), radar, and ultrasonics.

Using machine learning algorithms and other technologies, an autonomous vehicle makes decisions about navigating its surroundings based on data from these sensors.

Through the use of these various sensors, autonomous vehicles can compute their surroundings comprehensively and make real-time decisions to avoid obstacles, stay in their lane, and follow traffic laws.

Compared to radar positioning, laser location becomes increasingly precise with this new method. In low visibility environments, radar sensors can replace laser sensors in vehicles by seeing through dust, smoke, and fog.

With each new development, it appears that autonomous vehicles become more reliable, and they are becoming more widespread in the public eye with every passing day.

Competitive Landscape

Radar sensors are booming in the industry as companies develop devices to detect these signals. The key to gaining market share is providing a variety of products, creating outstanding marketing campaigns, and thoroughly understanding the industry's technical aspects. Different companies can combine their strengths to develop innovative products.

Research and development often result in the development of new products and technologies. Product improvements or the development of new ones can be used to gain a competitive advantage.

  • In May 2023, Porsche and Mobileye announced a strategic collaboration for the production of premium ADAS solutions. A new sensor suite from Mobileye called SuperVision will be used in future Porsche models.
  • In April 2023, Gapwaves AB (publ) announced that it would acquire 30 percent of Sensrad AB ("Sensrad"), which was previously a wholly owned subsidiary of Qamcom Group AB ("Qamcom"). Sensrad shares are subscribed for a total of SEK 40 million through cash on hand, and the total amount invested is SEK 40 million. A further 30% share of Sensrad can also be acquired by Gapwaves on certain conditions up until June 30, 2024.

Companies Covered in Radar Sensor Market

  • Robert Bosch GmbH
  • Continental AG
  • Denso Corporation
  • ZF Friedrichshafen AG
  • Airbus Group
  • Delphi Automotive LLP
  • Hella KGaA Hueck & Co
  • Infineon Technologies AG
  • Autoliv Inc.
  • Hitachi, Ltd.
  • Lockheed Martin Corporation
  • NXP Semiconductors N.V.
  • Smart Microwave Sensors GmbH
  • Start-Up Ecosystem
  • Echodyne, Inc.
  • Oculii Corporation
  • Northrop Grumman Corporation
  • ManTech International Corporation
  • Saab AB
  • Arbe Robotics
Frequently Asked Questions

Globally, the radar sensor market was worth US$ 8 billion by 2022.

By 2023, the radar sensor is expected to generate US$ 9.5 billion in revenue.

Radar sensor market growth is expected to reach US$ 45 billion by 2033.

The radar sensor market is expected to grow at a CAGR of 16.8% during the forecast period.

According to PMR, radar sensor sales increased by 19.6% between 2018 and 2022.

Automotive application is expected to increase by 16.5% by 2033.

The radar sensor market in Japan is expected to grow by 16.2% CAGR over the next few years.

Radar Sensor Market Report Scope
Attribute Details

Forecast Period

2025 to 2032

Historical Data Available for

2019 to 2024

Market Analysis

US$ Billion for Value

Key Countries Covered

  • United States
  • Canada
  • Brazil
  • Mexico
  • Germany
  • United Kingdom
  • France
  • Spain
  • Italy
  • China
  • Japan
  • South Korea
  • Singapore
  • Thailand
  • Indonesia
  • Australia
  • New Zealand
  • GCC Countries
  • South Africa
  • Israel

Key Market Segments Covered

  • Type
  • Application
  • Region

Key Companies Profiled

  • Robert Bosch GmbH
  • Continental AG
  • Denso Corporation
  • ZF Friedrichshafen AG
  • Airbus Group
  • Delphi Automotive LLP
  • Hella KGaA Hueck & Co
  • Infineon Technologies AG
  • Autoliv Inc.
  • Hitachi, Ltd.
  • Lockheed Martin Corporation
  • NXP Semiconductors N.V.
  • Smart Microwave Sensors GmbH
  • Start-Up Ecosystem
  • Echodyne, Inc.
  • Oculii Corporation
  • Northrop Grumman Corporation
  • ManTech International Corporation
  • Saab AB
  • Arbe Robotics

Pricing

Available upon Request

Radar Sensor Market Segmentation

By Type:

  • Imaging Radar
  • CW Radar
  • Pulse Radar
  • Non-imaging Radar
  • Speed Gauge
  • Altimeter

By Technology:

  • Time Domain Reflectometry - TDR
  • Ultra-Wideband - UWB
  • RF MEMS-based Radar Sensors
  • Millimeter Wave

By Component:

  • Antenna
  • Duplexer
  • Transmitter
  • Receiver
  • Video Amplifier

By Band:

  • HF, VHF, and UHF Bands
  • L, S, C, and X Bands
  • Ku, K, Ka, V, and W Bands

By Range:

  • Short-Range Radar
  • Mid-Range Radar
  • Long-Range Radar

By Application:

  • Automotive
  • Aerospace and Defence
  • Industrial
  • Security and Surveillance
  • Traffic Monitoring and Management
  • Environmental and Weather Monitoring
  • Others

By Region:

  • North America
  • Latin America
  • Europe
  • Asia Pacific
  • Middle East and Africa

Related Reports

1. Executive Summary

    1.1. Global Market Outlook

    1.2. Demand-side Trends

    1.3. Supply-side Trends

    1.4. Technology Roadmap Analysis

    1.5. Analysis and Recommendations

2. Market Overview

    2.1. Market Coverage / Taxonomy

    2.2. Market Definition / Scope / Limitations

3. Market Background

    3.1. Market Dynamics

        3.1.1. Drivers

        3.1.2. Restraints

        3.1.3. Opportunity

        3.1.4. Trends

    3.2. Scenario Forecast

        3.2.1. Demand in Optimistic Scenario

        3.2.2. Demand in Likely Scenario

        3.2.3. Demand in Conservative Scenario

    3.3. Opportunity Map Analysis

    3.4. Product Life Cycle Analysis

    3.5. Supply Chain Analysis

        3.5.1. Supply Side Participants and their Roles

            3.5.1.1. Producers

            3.5.1.2. Mid-Level Participants (Traders/ Agents/ Brokers)

            3.5.1.3. Wholesalers and Distributors

        3.5.2. Value Added and Value Created at Node in the Supply Chain

        3.5.3. List of Raw Material Suppliers

        3.5.4. List of Existing and Potential Buyer’s

    3.6. Investment Feasibility Matrix

    3.7. Value Chain Analysis

        3.7.1. Profit Margin Analysis

        3.7.2. Wholesalers and Distributors

        3.7.3. Retailers

    3.8. PESTLE and Porter’s Analysis

    3.9. Regulatory Landscape

        3.9.1. By Key Regions

        3.9.2. By Key Countries

    3.10. Regional Parent Market Outlook

    3.11. Production and Consumption Statistics

    3.12. Import and Export Statistics

4. Global Radar Sensor Market Analysis 2018-2022 and Forecast, 2023-2033

    4.1. Historical Market Size Value (US$ Mn) & Volume (Units) Analysis, 2018-2022

    4.2. Current and Future Market Size Value (US$ Mn) & Volume (Units) Projections, 2023-2033

        4.2.1. Y-o-Y Growth Trend Analysis

        4.2.2. Absolute $ Opportunity Analysis

5. Global Radar Sensor Market Analysis 2018-2022 and Forecast 2023-2033, By Type

    5.1. Introduction / Key Findings

    5.2. Historical Market Size Value (US$ Mn) & Volume (Units) Analysis By Type, 2018-2022

    5.3. Current and Future Market Size Value (US$ Mn) & Volume (Units) Analysis and Forecast By Type, 2023-2033

        5.3.1. Imaging Radar

        5.3.2. CW Radar

        5.3.3. Pulse Radar

        5.3.4. Non-imaging Radar

        5.3.5. Speed Gauge

        5.3.6. Altimeter

    5.4. Y-o-Y Growth Trend Analysis By Type, 2018-2022

    5.5. Absolute $ Opportunity Analysis By Type, 2023-2033

6. Global Radar Sensor Market Analysis 2018-2022 and Forecast 2023-2033, By Technology

    6.1. Introduction / Key Findings

    6.2. Historical Market Size Value (US$ Mn) & Volume (Units) Analysis By Technology, 2018-2022

    6.3. Current and Future Market Size Value (US$ Mn) & Volume (Units) Analysis and Forecast By Technology, 2023-2033

        6.3.1. Time Domain Reflectometry - TDR

        6.3.2. Ultra-Wideband - UWB

        6.3.3. RF MEMS-based Radar Sensors

        6.3.4. Millimeter Wave

    6.4. Y-o-Y Growth Trend Analysis By Technology, 2018-2022

    6.5. Absolute $ Opportunity Analysis By Technology, 2023-2033

7. Global Radar Sensor Market Analysis 2018-2022 and Forecast 2023-2033, By Component

    7.1. Introduction / Key Findings

    7.2. Historical Market Size Value (US$ Mn) & Volume (Units) Analysis By Component, 2018-2022

    7.3. Current and Future Market Size Value (US$ Mn) & Volume (Units) Analysis and Forecast By Component, 2023-2033

        7.3.1. Antenna

        7.3.2. Duplexer

        7.3.3. Transmitter

        7.3.4. Receiver

        7.3.5. Video Amplifier

    7.4. Y-o-Y Growth Trend Analysis By Component, 2018-2022

    7.5. Absolute $ Opportunity Analysis By Component, 2023-2033

8. Global Radar Sensor Market Analysis 2018-2022 and Forecast 2023-2033, By Band

    8.1. Introduction / Key Findings

    8.2. Historical Market Size Value (US$ Mn) & Volume (Units) Analysis By Band, 2018-2022

    8.3. Current and Future Market Size Value (US$ Mn) & Volume (Units) Analysis and Forecast By Band, 2023-2033

        8.3.1. HF, VHF, and UHF Bands

        8.3.2. L, S, C, and X Bands

        8.3.3. Ku, K, Ka, V, and W Bands

    8.4. Y-o-Y Growth Trend Analysis By Band, 2018-2022

    8.5. Absolute $ Opportunity Analysis By Band, 2023-2033

9. Global Radar Sensor Market Analysis 2018-2022 and Forecast 2023-2033, By Range

    9.1. Introduction / Key Findings

    9.2. Historical Market Size Value (US$ Mn) & Volume (Units) Analysis By Range, 2018-2022

    9.3. Current and Future Market Size Value (US$ Mn) & Volume (Units) Analysis and Forecast By Range, 2023-2033

        9.3.1. Short-Range Radar

        9.3.2. Mid-Range Radar

        9.3.3. Long-Range Radar

    9.4. Y-o-Y Growth Trend Analysis By Range, 2018-2022

    9.5. Absolute $ Opportunity Analysis By Range, 2023-2033

10. Global Radar Sensor Market Analysis 2018-2022 and Forecast 2023-2033, By Application

    10.1. Introduction / Key Findings

    10.2. Historical Market Size Value (US$ Mn) & Volume (Units) Analysis By Application, 2018-2022

    10.3. Current and Future Market Size Value (US$ Mn) & Volume (Units) Analysis and Forecast By Application, 2023-2033

        10.3.1. Automotive

        10.3.2. Aerospace and Defence

        10.3.3. Industrial

        10.3.4. Security and Surveillance

        10.3.5. Traffic Monitoring and Management

        10.3.6. Environmental and Weather Monitoring

        10.3.7. Others

    10.4. Y-o-Y Growth Trend Analysis By Application, 2018-2022

    10.5. Absolute $ Opportunity Analysis By Application, 2023-2033

11. Global Radar Sensor Market Analysis 2018-2022 and Forecast 2023-2033, By Region

    11.1. Introduction

    11.2. Historical Market Size Value (US$ Mn) & Volume (Units) Analysis By Region, 2018-2022

    11.3. Current Market Size Value (US$ Mn) & Volume (Units) Analysis and Forecast By Region, 2023-2033

        11.3.1. North America

        11.3.2. Latin America

        11.3.3. Europe

        11.3.4. Asia Pacific

        11.3.5. MEA

    11.4. Market Attractiveness Analysis By Region

12. North America Radar Sensor Market Analysis 2018-2022 and Forecast 2023-2033, By Country

    12.1. Historical Market Size Value (US$ Mn) & Volume (Units) Trend Analysis By Market Taxonomy, 2018-2022

    12.2. Market Size Value (US$ Mn) & Volume (Units) Forecast By Market Taxonomy, 2023-2033

        12.2.1. By Country

            12.2.1.1. U.S.

            12.2.1.2. Canada

        12.2.2. By Type

        12.2.3. By Technology

        12.2.4. By Component

        12.2.5. By Band

        12.2.6. By Range

        12.2.7. By Application

    12.3. Market Attractiveness Analysis

        12.3.1. By Country

        12.3.2. By Type

        12.3.3. By Technology

        12.3.4. By Component

        12.3.5. By Band

        12.3.6. By Range

        12.3.7. By Application

    12.4. Key Takeaways

13. Latin America Radar Sensor Market Analysis 2018-2022 and Forecast 2023-2033, By Country

    13.1. Historical Market Size Value (US$ Mn) & Volume (Units) Trend Analysis By Market Taxonomy, 2018-2022

    13.2. Market Size Value (US$ Mn) & Volume (Units) Forecast By Market Taxonomy, 2023-2033

        13.2.1. By Country

            13.2.1.1. Brazil

            13.2.1.2. Mexico

            13.2.1.3. Rest of Latin America

        13.2.2. By Type

        13.2.3. By Technology

        13.2.4. By Component

        13.2.5. By Band

        13.2.6. By Range

        13.2.7. By Application

    13.3. Market Attractiveness Analysis

        13.3.1. By Country

        13.3.2. By Type

        13.3.3. By Technology

        13.3.4. By Component

        13.3.5. By Band

        13.3.6. By Range

        13.3.7. By Application

    13.4. Key Takeaways

14. Europe Radar Sensor Market Analysis 2018-2022 and Forecast 2023-2033, By Country

    14.1. Historical Market Size Value (US$ Mn) & Volume (Units) Trend Analysis By Market Taxonomy, 2018-2022

    14.2. Market Size Value (US$ Mn) & Volume (Units) Forecast By Market Taxonomy, 2023-2033

        14.2.1. By Country

            14.2.1.1. Germany

            14.2.1.2. U.K.

            14.2.1.3. France

            14.2.1.4. Spain

            14.2.1.5. Italy

            14.2.1.6. Rest of Europe

        14.2.2. By Type

        14.2.3. By Technology

        14.2.4. By Component

        14.2.5. By Band

        14.2.6. By Range

        14.2.7. By Application

    14.3. Market Attractiveness Analysis

        14.3.1. By Country

        14.3.2. By Type

        14.3.3. By Technology

        14.3.4. By Component

        14.3.5. By Band

        14.3.6. By Range

        14.3.7. By Application

    14.4. Key Takeaways

15. Asia Pacific Radar Sensor Market Analysis 2018-2022 and Forecast 2023-2033, By Country

    15.1. Historical Market Size Value (US$ Mn) & Volume (Units) Trend Analysis By Market Taxonomy, 2018-2022

    15.2. Market Size Value (US$ Mn) & Volume (Units) Forecast By Market Taxonomy, 2023-2033

        15.2.1. By Country

            15.2.1.1. China

            15.2.1.2. Japan

            15.2.1.3. South Korea

            15.2.1.4. Singapore

            15.2.1.5. Thailand

            15.2.1.6. Indonesia

            15.2.1.7. Australia

            15.2.1.8. New Zealand

            15.2.1.9. Rest of Asia Pacific

        15.2.2. By Type

        15.2.3. By Technology

        15.2.4. By Component

        15.2.5. By Band

        15.2.6. By Range

        15.2.7. By Application

    15.3. Market Attractiveness Analysis

        15.3.1. By Country

        15.3.2. By Type

        15.3.3. By Technology

        15.3.4. By Component

        15.3.5. By Band

        15.3.6. By Range

        15.3.7. By Application

    15.4. Key Takeaways

16. MEA Radar Sensor Market Analysis 2018-2022 and Forecast 2023-2033, By Country

    16.1. Historical Market Size Value (US$ Mn) & Volume (Units) Trend Analysis By Market Taxonomy, 2018-2022

    16.2. Market Size Value (US$ Mn) & Volume (Units) Forecast By Market Taxonomy, 2023-2033

        16.2.1. By Country

            16.2.1.1. GCC Countries

            16.2.1.2. South Africa

            16.2.1.3. Israel

            16.2.1.4. Rest of MEA

        16.2.2. By Type

        16.2.3. By Technology

        16.2.4. By Component

        16.2.5. By Band

        16.2.6. By Range

        16.2.7. By Application

    16.3. Market Attractiveness Analysis

        16.3.1. By Country

        16.3.2. By Type

        16.3.3. By Technology

        16.3.4. By Component

        16.3.5. By Band

        16.3.6. By Range

        16.3.7. By Application

    16.4. Key Takeaways

17. Key Countries Radar Sensor Market Analysis

    17.1. U.S.

        17.1.1. Pricing Analysis

        17.1.2. Market Share Analysis, 2022

            17.1.2.1. By Type

            17.1.2.2. By Technology

            17.1.2.3. By Component

            17.1.2.4. By Band

            17.1.2.5. By Range

            17.1.2.6. By Application

    17.2. Canada

        17.2.1. Pricing Analysis

        17.2.2. Market Share Analysis, 2022

            17.2.2.1. By Type

            17.2.2.2. By Technology

            17.2.2.3. By Component

            17.2.2.4. By Band

            17.2.2.5. By Range

            17.2.2.6. By Application

    17.3. Brazil

        17.3.1. Pricing Analysis

        17.3.2. Market Share Analysis, 2022

            17.3.2.1. By Type

            17.3.2.2. By Technology

            17.3.2.3. By Component

            17.3.2.4. By Band

            17.3.2.5. By Range

            17.3.2.6. By Application

    17.4. Mexico

        17.4.1. Pricing Analysis

        17.4.2. Market Share Analysis, 2022

            17.4.2.1. By Type

            17.4.2.2. By Technology

            17.4.2.3. By Component

            17.4.2.4. By Band

            17.4.2.5. By Range

            17.4.2.6. By Application

    17.5. Germany

        17.5.1. Pricing Analysis

        17.5.2. Market Share Analysis, 2022

            17.5.2.1. By Type

            17.5.2.2. By Technology

            17.5.2.3. By Component

            17.5.2.4. By Band

            17.5.2.5. By Range

            17.5.2.6. By Application

    17.6. U.K.

        17.6.1. Pricing Analysis

        17.6.2. Market Share Analysis, 2022

            17.6.2.1. By Type

            17.6.2.2. By Technology

            17.6.2.3. By Component

            17.6.2.4. By Band

            17.6.2.5. By Range

            17.6.2.6. By Application

    17.7. France

        17.7.1. Pricing Analysis

        17.7.2. Market Share Analysis, 2022

            17.7.2.1. By Type

            17.7.2.2. By Technology

            17.7.2.3. By Component

            17.7.2.4. By Band

            17.7.2.5. By Range

            17.7.2.6. By Application

    17.8. Spain

        17.8.1. Pricing Analysis

        17.8.2. Market Share Analysis, 2022

            17.8.2.1. By Type

            17.8.2.2. By Technology

            17.8.2.3. By Component

            17.8.2.4. By Band

            17.8.2.5. By Range

            17.8.2.6. By Application

    17.9. Italy

        17.9.1. Pricing Analysis

        17.9.2. Market Share Analysis, 2022

            17.9.2.1. By Type

            17.9.2.2. By Technology

            17.9.2.3. By Component

            17.9.2.4. By Band

            17.9.2.5. By Range

            17.9.2.6. By Application

    17.10. China

        17.10.1. Pricing Analysis

        17.10.2. Market Share Analysis, 2022

            17.10.2.1. By Type

            17.10.2.2. By Technology

            17.10.2.3. By Component

            17.10.2.4. By Band

            17.10.2.5. By Range

            17.10.2.6. By Application

    17.11. Japan

        17.11.1. Pricing Analysis

        17.11.2. Market Share Analysis, 2022

            17.11.2.1. By Type

            17.11.2.2. By Technology

            17.11.2.3. By Component

            17.11.2.4. By Band

            17.11.2.5. By Range

            17.11.2.6. By Application

    17.12. South Korea

        17.12.1. Pricing Analysis

        17.12.2. Market Share Analysis, 2022

            17.12.2.1. By Type

            17.12.2.2. By Technology

            17.12.2.3. By Component

            17.12.2.4. By Band

            17.12.2.5. By Range

            17.12.2.6. By Application

    17.13. Singapore

        17.13.1. Pricing Analysis

        17.13.2. Market Share Analysis, 2022

            17.13.2.1. By Type

            17.13.2.2. By Technology

            17.13.2.3. By Component

            17.13.2.4. By Band

            17.13.2.5. By Range

            17.13.2.6. By Application

    17.14. Thailand

        17.14.1. Pricing Analysis

        17.14.2. Market Share Analysis, 2022

            17.14.2.1. By Type

            17.14.2.2. By Technology

            17.14.2.3. By Component

            17.14.2.4. By Band

            17.14.2.5. By Range

            17.14.2.6. By Application

    17.15. Indonesia

        17.15.1. Pricing Analysis

        17.15.2. Market Share Analysis, 2022

            17.15.2.1. By Type

            17.15.2.2. By Technology

            17.15.2.3. By Component

            17.15.2.4. By Band

            17.15.2.5. By Range

            17.15.2.6. By Application

    17.16. Australia

        17.16.1. Pricing Analysis

        17.16.2. Market Share Analysis, 2022

            17.16.2.1. By Type

            17.16.2.2. By Technology

            17.16.2.3. By Component

            17.16.2.4. By Band

            17.16.2.5. By Range

            17.16.2.6. By Application

    17.17. New Zealand

        17.17.1. Pricing Analysis

        17.17.2. Market Share Analysis, 2022

            17.17.2.1. By Type

            17.17.2.2. By Technology

            17.17.2.3. By Component

            17.17.2.4. By Band

            17.17.2.5. By Range

            17.17.2.6. By Application

    17.18. GCC Countries

        17.18.1. Pricing Analysis

        17.18.2. Market Share Analysis, 2022

            17.18.2.1. By Type

            17.18.2.2. By Technology

            17.18.2.3. By Component

            17.18.2.4. By Band

            17.18.2.5. By Range

            17.18.2.6. By Application

    17.19. South Africa

        17.19.1. Pricing Analysis

        17.19.2. Market Share Analysis, 2022

            17.19.2.1. By Type

            17.19.2.2. By Technology

            17.19.2.3. By Component

            17.19.2.4. By Band

            17.19.2.5. By Range

            17.19.2.6. By Application

    17.20. Israel

        17.20.1. Pricing Analysis

        17.20.2. Market Share Analysis, 2022

            17.20.2.1. By Type

            17.20.2.2. By Technology

            17.20.2.3. By Component

            17.20.2.4. By Band

            17.20.2.5. By Range

            17.20.2.6. By Application

18. Market Structure Analysis

    18.1. Competition Dashboard

    18.2. Competition Benchmarking

    18.3. Market Share Analysis of Top Players

        18.3.1. By Regional

        18.3.2. By Type

        18.3.3. By Technology

        18.3.4. By Component

        18.3.5. By Band

        18.3.6. By Range

        18.3.7. By Application

19. Competition Analysis

    19.1. Competition Deep Dive

        19.1.1. Robert Bosch GmbH

            19.1.1.1. Overview

            19.1.1.2. Product Portfolio

            19.1.1.3. Profitability by Market Segments

            19.1.1.4. Sales Footprint

            19.1.1.5. Strategy Overview

                19.1.1.5.1. Marketing Strategy

                19.1.1.5.2. Product Strategy

                19.1.1.5.3. Channel Strategy

        19.1.2. Continental AG

            19.1.2.1. Overview

            19.1.2.2. Product Portfolio

            19.1.2.3. Profitability by Market Segments

            19.1.2.4. Sales Footprint

            19.1.2.5. Strategy Overview

                19.1.2.5.1. Marketing Strategy

                19.1.2.5.2. Product Strategy

                19.1.2.5.3. Channel Strategy

        19.1.3. Denso Corporation

            19.1.3.1. Overview

            19.1.3.2. Product Portfolio

            19.1.3.3. Profitability by Market Segments

            19.1.3.4. Sales Footprint

            19.1.3.5. Strategy Overview

                19.1.3.5.1. Marketing Strategy

                19.1.3.5.2. Product Strategy

                19.1.3.5.3. Channel Strategy

        19.1.4. ZF Friedrichshafen AG

            19.1.4.1. Overview

            19.1.4.2. Product Portfolio

            19.1.4.3. Profitability by Market Segments

            19.1.4.4. Sales Footprint

            19.1.4.5. Strategy Overview

                19.1.4.5.1. Marketing Strategy

                19.1.4.5.2. Product Strategy

                19.1.4.5.3. Channel Strategy

        19.1.5. Airbus Group

            19.1.5.1. Overview

            19.1.5.2. Product Portfolio

            19.1.5.3. Profitability by Market Segments

            19.1.5.4. Sales Footprint

            19.1.5.5. Strategy Overview

                19.1.5.5.1. Marketing Strategy

                19.1.5.5.2. Product Strategy

                19.1.5.5.3. Channel Strategy

        19.1.6. Delphi Automotive LLP

            19.1.6.1. Overview

            19.1.6.2. Product Portfolio

            19.1.6.3. Profitability by Market Segments

            19.1.6.4. Sales Footprint

            19.1.6.5. Strategy Overview

                19.1.6.5.1. Marketing Strategy

                19.1.6.5.2. Product Strategy

                19.1.6.5.3. Channel Strategy

        19.1.7. Hella KGaA Hueck & Co

            19.1.7.1. Overview

            19.1.7.2. Product Portfolio

            19.1.7.3. Profitability by Market Segments

            19.1.7.4. Sales Footprint

            19.1.7.5. Strategy Overview

                19.1.7.5.1. Marketing Strategy

                19.1.7.5.2. Product Strategy

                19.1.7.5.3. Channel Strategy

        19.1.8. Infineon Technologies AG

            19.1.8.1. Overview

            19.1.8.2. Product Portfolio

            19.1.8.3. Profitability by Market Segments

            19.1.8.4. Sales Footprint

            19.1.8.5. Strategy Overview

                19.1.8.5.1. Marketing Strategy

                19.1.8.5.2. Product Strategy

                19.1.8.5.3. Channel Strategy

        19.1.9. Autoliv Inc.

            19.1.9.1. Overview

            19.1.9.2. Product Portfolio

            19.1.9.3. Profitability by Market Segments

            19.1.9.4. Sales Footprint

            19.1.9.5. Strategy Overview

                19.1.9.5.1. Marketing Strategy

                19.1.9.5.2. Product Strategy

                19.1.9.5.3. Channel Strategy

        19.1.10. Hitachi, Ltd.

            19.1.10.1. Overview

            19.1.10.2. Product Portfolio

            19.1.10.3. Profitability by Market Segments

            19.1.10.4. Sales Footprint

            19.1.10.5. Strategy Overview

                19.1.10.5.1. Marketing Strategy

                19.1.10.5.2. Product Strategy

                19.1.10.5.3. Channel Strategy

        19.1.11. Lockheed Martin Corporation

            19.1.11.1. Overview

            19.1.11.2. Product Portfolio

            19.1.11.3. Profitability by Market Segments

            19.1.11.4. Sales Footprint

            19.1.11.5. Strategy Overview

                19.1.11.5.1. Marketing Strategy

                19.1.11.5.2. Product Strategy

                19.1.11.5.3. Channel Strategy

        19.1.12. NXP Semiconductors N.V.

            19.1.12.1. Overview

            19.1.12.2. Product Portfolio

            19.1.12.3. Profitability by Market Segments

            19.1.12.4. Sales Footprint

            19.1.12.5. Strategy Overview

                19.1.12.5.1. Marketing Strategy

                19.1.12.5.2. Product Strategy

                19.1.12.5.3. Channel Strategy

        19.1.13. Smart Microwave Sensors GmbH

            19.1.13.1. Overview

            19.1.13.2. Product Portfolio

            19.1.13.3. Profitability by Market Segments

            19.1.13.4. Sales Footprint

            19.1.13.5. Strategy Overview

                19.1.13.5.1. Marketing Strategy

                19.1.13.5.2. Product Strategy

                19.1.13.5.3. Channel Strategy

        19.1.14. Start-Up Ecosystem

            19.1.14.1. Overview

            19.1.14.2. Product Portfolio

            19.1.14.3. Profitability by Market Segments

            19.1.14.4. Sales Footprint

            19.1.14.5. Strategy Overview

                19.1.14.5.1. Marketing Strategy

                19.1.14.5.2. Product Strategy

                19.1.14.5.3. Channel Strategy

        19.1.15. Echodyne, Inc.

            19.1.15.1. Overview

            19.1.15.2. Product Portfolio

            19.1.15.3. Profitability by Market Segments

            19.1.15.4. Sales Footprint

            19.1.15.5. Strategy Overview

                19.1.15.5.1. Marketing Strategy

                19.1.15.5.2. Product Strategy

                19.1.15.5.3. Channel Strategy

        19.1.16. Oculii Corporation

            19.1.16.1. Overview

            19.1.16.2. Product Portfolio

            19.1.16.3. Profitability by Market Segments

            19.1.16.4. Sales Footprint

            19.1.16.5. Strategy Overview

                19.1.16.5.1. Marketing Strategy

                19.1.16.5.2. Product Strategy

                19.1.16.5.3. Channel Strategy

        19.1.17. Northrop Grumman Corporation

            19.1.17.1. Overview

            19.1.17.2. Product Portfolio

            19.1.17.3. Profitability by Market Segments

            19.1.17.4. Sales Footprint

            19.1.17.5. Strategy Overview

                19.1.17.5.1. Marketing Strategy

                19.1.17.5.2. Product Strategy

                19.1.17.5.3. Channel Strategy

        19.1.18. ManTech International Corporation

            19.1.18.1. Overview

            19.1.18.2. Product Portfolio

            19.1.18.3. Profitability by Market Segments

            19.1.18.4. Sales Footprint

            19.1.18.5. Strategy Overview

                19.1.18.5.1. Marketing Strategy

                19.1.18.5.2. Product Strategy

                19.1.18.5.3. Channel Strategy

        19.1.19. Saab AB

            19.1.19.1. Overview

            19.1.19.2. Product Portfolio

            19.1.19.3. Profitability by Market Segments

            19.1.19.4. Sales Footprint

            19.1.19.5. Strategy Overview

                19.1.19.5.1. Marketing Strategy

                19.1.19.5.2. Product Strategy

                19.1.19.5.3. Channel Strategy

        19.1.20. Arbe Robotics

            19.1.20.1. Overview

            19.1.20.2. Product Portfolio

            19.1.20.3. Profitability by Market Segments

            19.1.20.4. Sales Footprint

            19.1.20.5. Strategy Overview

                19.1.20.5.1. Marketing Strategy

                19.1.20.5.2. Product Strategy

                19.1.20.5.3. Channel Strategy

20. Assumptions & Acronyms Used

21. Research Methodology

Research Methodology Framework for Market Research Excellence

At Persistence Market Research, we implement a comprehensive, validated, and multi-dimensional approachto market analysis that delivers actionable insights across complex market landscapes. Our methodology combines the analytical rigor of leading consulting firms with innovative research techniques, ensuring robust market assessments that guide strategic decision-making with confidence.

Core Research Philosophy

Our methodology is built on four foundational pillars:

Research Philosophy Image

At Persistence Market Research, our methodology is designed to transcend conventional market studies by combining analytical rigor, multi-source validation, and future-focused insights.

We integrate advanced research frameworks, robust data collection strategies, cutting-edge analytics, and innovative technologies to deliver a 360-degree view of complex markets.

We integrate advanced research frameworks, robust data collection strategies, cutting-edge analytics, and innovative technologies to deliver a 360-degree view of complex markets.

Each stage spanning from strategic scoping and hypothesis-building to competitive intelligence, quality validation, and actionable recommendations is engineered to provide clients with unmatched clarity, precision, and confidence in decision-making.

By embedding innovation and technology at the core, our approach ensures that insights are not only comprehensive but also predictive, empowering businesses to seize opportunities, mitigate risks, and achieve sustainable growth

Research Philosophy Image

Capturing Key Information and Events

During this phase, key research objectives focus on essential information and data points for assessing the market, including:

Research Philosophy Image

TAM-SAM-SOM Framework Implementation

We employ both top-down and bottom-up approaches to ensure accurate market sizing.

Top-Down Market SizingBottom-Up Market Sizing
Universe Definition: Total global/regional market identificationUnit Economics: Average transaction values, purchase frequencies, customer lifecycle
Segmentation Filters: Geographic, demographic, and behavioral constraintsCustomer Segmentation: Detailed buyer persona development and sizing
Market Share Analysis: Competitive landscape assessment and share allocationPenetration Analysis: Market penetration rates by segment and geography
Growth Rate Application: Historical trends and forward-looking growth assumptionsScaling Methodology: Extrapolation techniques with confidence intervals

Validation & Cross-Verification

  • Triangulation: Comparing top-down and bottom-up results for consistency
  • Sensitivity Analysis: Testing key assumptions and parameter variations
  • Peer Benchmarking: Comparison with analogous markets and industry benchmarks
  • Expert Review: External validation through industry specialist consultation

Research Philosophy Image

Forecasting & Projection Modeling

Our proprietary forecasting models incorporate multiple variables and scenarios.

Forecasting Components

  • Historical Trend Analysis: 10-year historical growth patterns and cyclical variations
  • Driver-Based Modeling: Economic indicators, demographic shifts, technology adoption
  • Scenario Planning: Base case, optimistic, and conservative projections
  • Monte Carlo Simulations: Probability-weighted outcomes and risk assessments

Model Validation

  • Back-Testing: Historical accuracy assessment over 3–5-year periods
  • Cross-Validation: Multiple modeling approaches for result comparison
  • External Benchmarking: Comparison with established market forecasts
  • Continuous Calibration: Quarterly model updates based on new data

Comprehensive Data Collection Strategy

Our secondary research phase establishes a robust knowledge base utilizing diverse, credible sources.

Secondary Data Sourcess

  • Industry Publications & Reports
  • Government & Regulatory Data
  • Financial Intelligence (filings & reports)
  • Academic Research & Digital Intelligence

Quality Assurance Protocol

  • Source credibility assessment and publication date validation
  • Data consistency checks across multiple sources
  • Bias identification and neutralization techniques
  • Information gap tracking for primary research prioritization

Research Philosophy Image

Primary Research Excellence

Our primary research methodology employs best-in-class techniques to capture unique market insights.

Quantitative Research Methods

  • Large-Scale Surveys: Statistically representative samples with 95% confidence intervals
  • Survey Methodology: Multi-channel deployment (online, telephone, in-person)
  • Question Architecture and Response Optimization

Qualitative Research Methods

  • Executive Interviews
  • Focus Groups
  • Expert Consultations

Quality Assurance & Validation Framework

Multi-Stage Validation Process

  • Source Verification and Consistency Testing
  • Outlier Detection and Bias Assessment
  • Peer Review Process and External Validation
  • Sensitivity Analysis and Confidence Intervals

Research Philosophy Image

Methodology Validation & Credibility

Our research methodology has been extensively validated through:

  • Academic Partnerships: Collaborations with top-tier business schools and research institutions
  • Client Success Stories: Documented case studies demonstrating research impact and ROI
  • Continuous Benchmarking: Performance comparison with leading global research firms

This comprehensive methodology framework positions Persistence Market Research at the forefront of market intelligence, combining the analytical sophistication of top-tier consulting firms with innovative research techniques. Our approach ensures that every market assessment delivers precise, actionable, and strategically valuable insights that drive business success in competitive market environments.

Ready to unlock your market potential? Contact our research experts to discuss how our validated methodology can transform your strategic decision-making with data-driven market intelligence.

Copyright © 2026 Persistence Market Research. All Rights Reserved

Connect With Us -
Radar Sensor Market Size, Trends & Business Insights, 2033