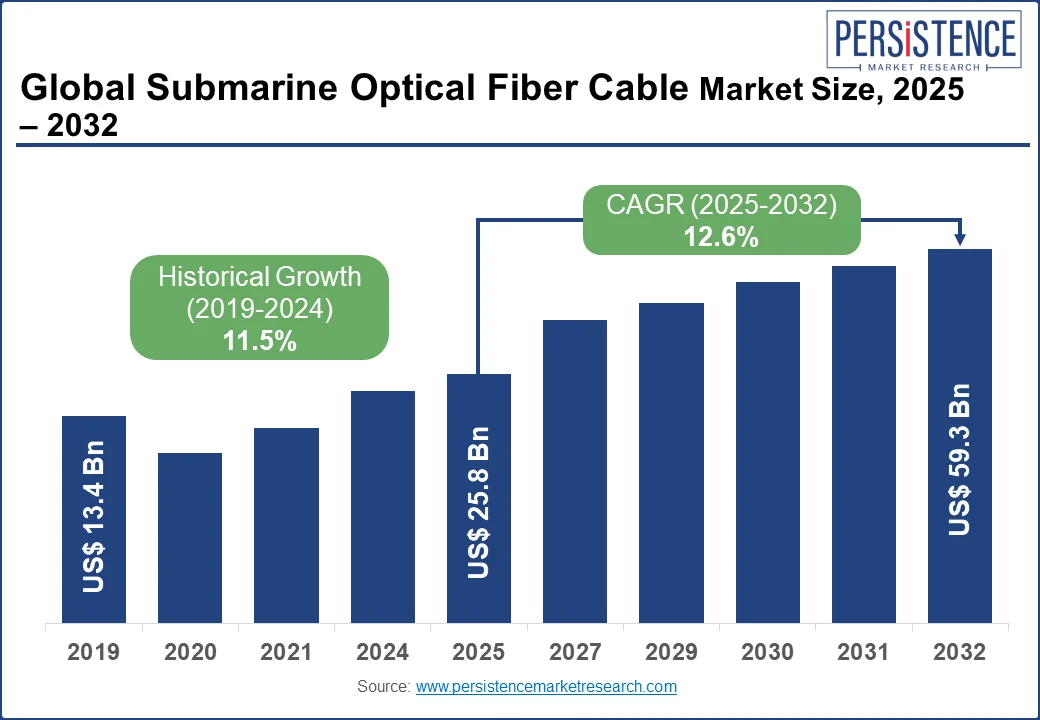
Submarine Optical Fiber Cable Market Size, Share, and Growth Forecast for 2025 - 2032

Submarine Optical Fiber Cable Market by Type (Single Mode, Multi-mode), by Application (Communication, Oil & Gas, Defense, Scientific Research), and Regional Analysis

ID: PMRREP33477
Calendar

August 2025

250 Pages

Author : Sayali Mali

Submarine Optical Fiber Cable Market Size and Share Analysis

The global submarine optical fiber cable industry size is anticipated to reach US$ 59.3 billion in 2032. It is set to exhibit a CAGR of around 12.6% in the estimated time frame between 2025 and 2032. The market is likely to surpass a valuation of US$ 25.8 billion by 2025.

Ongoing expansion of global telecommunications networks is driving the need for extensive submarine cable infrastructure. This expansion is fueled by increasing demand for high-speed data transmission, reliable connectivity, and seamless global communication.

Surging digitization across various sectors, including finance, e-commerce, media, and healthcare, has led to a substantial increase in data generation & consumption. This exponential growth in data volumes requires robust and scalable connectivity solutions. Submarine optical fiber cables provide the necessary backbone for transmitting vast amounts of data over long distances.

Global adoption of cloud computing services and proliferation of digital content streaming platforms have significantly increased bandwidth requirements. Submarine optical fiber cables offer high-capacity data transmission capabilities that can meet the bandwidth demands of these services, ensuring smooth and uninterrupted connectivity.

Submarine Optical Fiber Cable Market Size 2025 - 2032

A few latest trends in the global submarine optical fiber cable market:

  • Increasing deployment of high-capacity submarine optical fiber cables to meet growing bandwidth demands is likely to push growth.
  • Adoption of advanced technologies such as coherent transmission and wavelength division multiplexing (WDM) for increased data transmission capacity would aid sales.
  • Collaboration between key players for joint cable projects to optimize costs and improve efficiency is expected to bolster growth.
  • Increasing use of submarine cable systems for renewable energy projects and offshore data centers is likely to accelerate sales.
  • Exploration of new routes and landing points to expand global submarine cable network coverage is estimated to drive growth.
  • Integration of advanced monitoring and maintenance systems for proactive cable management is set to fuel growth
Attributes Key Insights

Submarine Optical Fiber Cable Market Estimated Size (2025E)

US$ 25.8 billion

Projected Market Valuation (2032F)

US$ 59.3 billion

Value-based CAGR (2025 to 2032)

12.6%

United States Value-based CAGR (2025 to 2032)

12.5%

2019 to 2024 Submarine Optical Fiber Cable Market Outlook Compared to Demand Forecast from 2025 to 2032

Persistence Market Research (PMR) mentions that the global submarine optical fiber cable industry showcased a CAGR of 14.0% in the historical period. It is anticipated to exhibit 12.6% CAGR in the next ten years.

Demand for submarine optical fiber cables has experienced significant growth in recent years due to several key factors in the industry. Rapid expansion of global telecommunications networks has necessitated the deployment of extensive undersea cable infrastructure.

It is mainly propelled by increasing demand for high-speed data transmission and reliable connectivity. Growth is further fueled by proliferation of digital content, cloud computing services, and exponential growth of internet users worldwide.

Emergence of advanced technologies and bandwidth-intensive applications such as video streaming, online gaming, and virtual reality, has placed higher requirements on data transmission capacities & latency reduction. Submarine optical fiber cables, with their ability to transmit vast amounts of data over long distances, have become the preferred solution to meet these connectivity needs.

Growing interconnectivity between continents and regions for international trade, finance, and global collaboration has resulted in rising demand for reliable & secure communication links. Submarine optical fiber cables would offer a robust and secure transmission medium, ensuring an uninterrupted flow of critical data across borders.

What Are the Drivers Fueling Submarine Optical Fiber Cable Sales Globally?

With proliferation of digital content and cloud services, there is a growing demand for high-speed data transmission across the globe. Surging need for high-speed data transmission solutions has propelled submarine optical fiber cable sales in the market.

High demand can be attributed to exponential rise in digital content creation and consumption, as well as widespread adoption of data-intensive applications. A couple of these include cloud services and video streaming. Crucial need for real-time data analysis and decision-making in various sectors is also expected to push demand.

In order to meet these requirements, market players are seeking the fastest and most reliable means of transmitting large volumes of data over significant distances. These factors are making submarine optical fiber cables the preferred choice in the global market.

Demand for high-speed data transmission is expected to continue to surge in the next ten years. It would be driven by increasing adoption of 5G wireless networks, the internet of things (IoT), and other emerging technologies. This is projected to expand the submarine optical fiber cable industry, as demand for faster and more reliable communication across the globe continues to increase.

In 2018, there were around 5.52 billion IoT connections worldwide, which increased to about 14.82 billion by 2024. It is projected that by 2028, there will be around 38.12 billion IoT connections worldwide.

As transmission of data between these devices and the cloud requires a reliable and high-bandwidth infrastructure, the market is set to expand. With increasing adoption of IoT around the world, demand for faster global communication is projected to surge during the assessment period.

Increasing internet penetration amid rising adoption of smartphones, tablets, and other connected devices is projected to bolster sales. Need to browse the web, stream videos, play games, and use social media platforms is likely to further propel demand for these devices globally. As a result, demand for high-speed internet access is growing rapidly.

Submarine optical fiber cables serve as the fundamental infrastructure supporting the interconnected global telecommunications network. With their capability to facilitate high-speed data transmission across extensive distances, these cables have become integral for establishing reliable internet connectivity.

Such cables play a vital role in interconnecting critical components such as data centers, internet service providers, and other entities with significant bandwidth requirements. These help to ensure seamless and efficient data transfer throughout the network.

In 2019, there were around 12 million 5G subscribers globally, which increased to about 1 billion by 2024. These are projected to reach 4 billion by 2027. Rapid adoption of 5G around the world is anticipated to bolster submarine optical fiber cable demand during the evaluation period.

Country-wise Insights:

Are Submarine Optical Fiber Cables in High Demand across the United States?

The United States submarine optical fiber cable industry is expected to surpass US$ 13.7 billion by 2032. It is likely to create an absolute dollar opportunity of US$ 9.5 billion in the evaluation period.

The United States witnessed growth at a CAGR of 13.9% from 2019 to 2024. It is likely to bolster at a CAGR of 12.5% from 2025 to 2032.

Demand for submarine optical fiber cables in the country can be attributed to expansion of telecommunications networks. Increasing adoption of digital services is also set to generate a significant need for robust and reliable connectivity infrastructure. Submarine optical fiber cables would provide the necessary high-speed data transmission capabilities to meet this growing demand.

The United States is witnessing a rapid growth in data consumption due to proliferation of digital content, cloud computing, and bandwidth-intensive applications. As a result, there is a heightened requirement for submarine optical fiber cables to support the seamless transmission of large volumes of data over long distances.

Will the United Kingdom Experience Significant Sales of Submarine Optical Fiber Cables?

The United Kingdom submarine optical fiber cable market is set to be worth US$ 2.5 billion in 2032. It is predicted to create an absolute dollar growth of US$ 1.7 billion till 2032.

The United Kingdom witnessed steady growth at a CAGR of 13.7% from 2019 to 2024. It is expected to elevate at a CAGR of 12.2% from 2025 to 2032.

The United Kingdom has a highly developed telecommunications sector with a strong emphasis on connectivity and digital infrastructure. As demand for high-speed data transmission and reliable connectivity continues to rise, there is an increasing need for submarine optical fiber cables. These would help to support expansion of the country's telecommunications networks.

The United Kingdom serves as a leading hub for international business and finance. This role necessitates robust and secure communication links, which are facilitated by submarine optical fiber cables. These cables enable reliable and high-capacity data transmission, meeting the connectivity demands of the financial sector, global enterprises, and other industries that rely on seamless international communication.

Is There a Notable Demand for Submarine Optical Fiber Cables in China?

China submarine optical fiber cable market is expected to be worth US$ 14.8 billion by 2032. It is anticipated to create an incremental opportunity of US$ 10.2 billion in the assessment period.

China exhibited considerable growth at a CAGR of 13.8% from 2019 to 2024. It is likely to surge at a CAGR of 12.3% from 2025 to 2032.

China is witnessing exponential growth in internet users, mobile device penetration, and data consumption. This surge in digital activity, driven by e-commerce, video streaming, and cloud computing, necessitates the deployment of extensive submarine cable infrastructure. Submarine optical fiber cables provide the high-capacity transmission capabilities required to support this burgeoning digital ecosystem.

China's Belt and Road Initiative (BRI) aims to enhance connectivity and trade across Asia, Europe, and Africa. Submarine optical fiber cables play a vital role in establishing the necessary communication links between these regions. These would further help in facilitating seamless data exchange and enabling economic cooperation.

Category-wise Insights

Which Type of Submarine Optical Fiber Cable would Showcase High Popularity?

The single-mode segment by type is anticipated to dominate the global submarine optical fiber cable market in the forecast period. It witnessed average growth at a CAGR of 13.5% from 2019 to 2024. It is expected to rise at a CAGR of 12.4% from 2025 to 2032.

Increasing demand for higher data transmission capacities and longer transmission distances necessitates the use of single-mode fibers. These fibers have a smaller core diameter compared to multi-mode fibers, allowing for lower signal attenuation and higher bandwidth capabilities. As a result, single-mode submarine optical fiber cables can support high-speed data transmission over vast distances, meeting growing connectivity needs of the market.

Adoption of advanced technologies such as coherent transmission and wavelength division multiplexing (WDM) has further propelled the popularity of single-mode cables. These technologies require high-quality transmission paths that can minimize signal degradation and maximize spectral efficiency.

Single-mode fibers excel in providing low signal loss and high spectral efficiency, making them an ideal choice for deploying cutting-edge technologies. These can also be used for maximizing the capacity of submarine cable systems.

Which is the Dominant Application of Submarine Optical Fiber Cables?

Based on application, the communication segment is projected to witness significant growth through 2032. It showcased a decent CAGR of 13.8% from 2019 to 2024. The segment is anticipated to accelerate at a CAGR of 12.2% from 2025 to 2032.

Submarine optical fiber cables provide a high-capacity bandwidth, allowing for efficient transmission of large volumes of data. This is crucial in the communication sector, where demand for data-intensive services such as video streaming, cloud computing, and online collaboration continues to rise exponentially.

Low signal loss and high-speed data transmission capabilities of submarine optical fiber cables make them crucial for achieving fast and efficient communication. In sectors such as finance, where split-second transactions are critical, low latency connectivity provided by submarine cables is essential for maintaining real-time data transfer and decision-making.

Submarine optical fiber cables are designed to transmit data over vast distances, making them ideal for establishing communication links between continents, islands, and remote coastal regions. They enable seamless and reliable connectivity across long distances, supporting global communication networks and international data exchange.

Competitive Landscape

Submarine optical fiber cable manufacturers are investing heavily in research & development to innovate and enhance the performance of their cables. This includes developing higher-capacity cables, improving signal transmission efficiency, and increasing resilience of cables to external factors such as deep-sea conditions & natural disasters.

They are constantly seeking ways to optimize production costs without compromising quality. This involves streamlining manufacturing processes, sourcing raw materials efficiently, and adopting cost-effective design & production techniques.

A few other companies are expanding their global presence by establishing manufacturing facilities, research centers, and sales offices in strategic locations. This would enable them to better serve regional markets, tap into emerging markets, and reduce logistical costs.

A few recent developments in the submarine optical fiber cable market are:

  • In February 2022, SubCom LLC announced that a contract is in force between SubCom LLC and Southeast Asia-Middle East Western Europe 6 consortium (SEA-ME-WE 6). The company also announced that it will supply and install about 19,200 km of undersea cable systems between Singapore and France connecting at 12 locations. These new cable systems will enable the consortium partners to provide better services to their customers.
  • In March 2021, Google and Facebook announced a partnership to lay a set of two subsea cables called Echo and Bifrost. These trans-pacific cables will enable the increase of data capacity in Asia and North America by around 70%. They would also help to improve the overall internet reliability.

Companies Covered in Submarine Optical Fiber Cable Market

  • ABB Ltd.
  • Bharti Airtel Ltd
  • Corning, Inc
  • Ciena Corporation
  • Amphenol Corporation
  • Chunghwa Telecom Co., Ltd.
  • Belden, Inc
  • China Unicom Global Limited
  • AFL
  • Dialog Axiata PLC
Frequently Asked Questions

The global submarine optical fiber cable industry was worth US$ 18.2 billion in 2022.

The submarine optical fiber cable industry is projected to surpass market size of US$ 20.6 billion in 2023.

The submarine optical fiber cable industry in 2033 is expected to reach US$ 67.8 billion.

The submarine optical fiber cable industry exhibited a CAGR of 14.0% over the last 4 days.

The submarine optical fiber cable industry is likely to witness a CAGR of 12.6% in the next ten years.

The communication segment in terms of application is set to garner a significant share by 2023.

Japan and South Korea submarine optical fiber cable industry is set to exhibit CAGRs of 12.5% and 12.3%, respectively between 2023 and 2033.

Submarine Optical Fiber Cable Market Report Scope
Attribute Detail

Estimated Market Size (2025)

US$ 25.8 billion

Projected Market Valuation (2032)

US$ 59.3 billion

Value-based CAGR (2025 to 2032)

12.6%

Historical Data

2019 to 2024

Forecast Period

2025 to 2032

Quantitative Units

  • Value (US$ billion)
  • Volume (meter)

Market Segments Covered

  • Type
  • Application
  • Region

Regions Covered

  • North America
  • Latin America
  • Europe
  • Asia Pacific
  • Middle East and Africa

Key Countries Covered

  • United States
  • Canada
  • Mexico
  • Argentina
  • Brazil
  • Germany
  • Italy
  • France
  • United Kingdom
  • Spain
  • Nordics
  • BENELUX
  • Poland
  • Hungary
  • Romania
  • Czech Republic
  • Russia
  • China
  • Japan
  • South Korea
  • India
  • Association of Southeast Asian Nations
  • Australia and New Zealand
  • Kingdom of Saudi Arabia
  • United Arab Emirates
  • Türkiye
  • Northern Africa
  • South Africa
  • Israel

Key Companies Profiled

  • ABB Ltd.
  • Bharti Airtel Ltd.
  • Corning, Inc.
  • Ciena Corporation
  • Amphenol Corporation
  • Chunghwa Telecom Co., Ltd.
  • Belden, Inc.
  • China Unicom Global Limited
  • AFL
  • Dialog Axiata PLC

Report Coverage

  • Revenue Forecast
  • Volume Forecast
  • Company Ranking
  • Competitive Landscape
  • Growth Factors
  • Trends
  • Pricing Analysis
Submarine Optical Fiber Cable Market Segmentation

By Type:

  • Single Mode
  • Multi-mode

By Application:

  • Communication
  • Oil & Gas
  • Defense
  • Scientific Research

By Region:

  • North America
  • Latin America
  • Europe
  • Asia Pacific
  • Middle East and Africa

Related Reports

1. Executive Summary

    1.1. Global Submarine Optical Fiber Cable Market Outlook

    1.2. Demand-side Trends

    1.3. Supply-side Trends

    1.4. Technology Roadmap Analysis

    1.5. Analysis and Recommendations

2. Market Overview

    2.1. Market Coverage / Taxonomy

    2.2. Market Definition / Scope / Limitations

3. Market Background

    3.1. Market Dynamics

        3.1.1. Drivers

        3.1.2. Restraints

        3.1.3. Opportunity

        3.1.4. Trends

    3.2. Scenario Forecast

        3.2.1. Demand in Optimistic Scenario

        3.2.2. Demand in Likely Scenario

        3.2.3. Demand in Conservative Scenario

    3.3. Opportunity Map Analysis

    3.4. Product Life Cycle Analysis

    3.5. Supply Chain Analysis

        3.5.1. Supply Side Participants and their Roles

            3.5.1.1. Producers

            3.5.1.2. Mid-Level Participants (Traders/ Agents/ Brokers)

            3.5.1.3. Wholesalers and Distributors

        3.5.2. Value Added and Value Created at Node in the Supply Chain

        3.5.3. List of Raw Material Suppliers

        3.5.4. List of Existing and Potential Buyer’s

    3.6. Investment Feasibility Matrix

    3.7. Value Chain Analysis

        3.7.1. Profit Margin Analysis

        3.7.2. Wholesalers and Distributors

        3.7.3. Retailers

    3.8. PESTLE and Porter’s Analysis

    3.9. Regulatory Landscape

        3.9.1. By Key Regions

        3.9.2. By Key Countries

    3.10. Regional Parent Market Outlook

    3.11. Production and Consumption Statistics

    3.12. Import and Export Statistics

4. Global Submarine Optical Fiber Cables Market Analysis 2018 to 2022 and Forecast, 2023 to 2033

    4.1. Historical Market Size Value (US$ billion) & Volume (meter) Analysis, 2018 to 2022

    4.2. Current and Future Market Size Value (US$ billion) & Volume (meter) Projections, 2023 to 2033

        4.2.1. Y-o-Y Growth Trend Analysis

        4.2.2. Absolute $ Opportunity Analysis

5. Global Submarine Optical Fiber Cables Market Analysis 2018 to 2022 and Forecast 2023 to 2033, By Type

    5.1. Introduction / Key Findings

    5.2. Historical Market Size Value (US$ billion) & Volume (meter) Analysis By Type, 2018 to 2022

    5.3. Current and Future Market Size Value (US$ billion) & Volume (meter) Analysis and Forecast By Type, 2023 to 2033

        5.3.1. Single-Mode

        5.3.2. Multi-mode

    5.4. Y-o-Y Growth Trend Analysis By Type, 2018 to 2022

    5.5. Absolute $ Opportunity Analysis By Type, 2023 to 2033

6. Global Submarine Optical Fiber Cables Market Analysis 2018 to 2022 and Forecast 2023 to 2033, By Application

    6.1. Introduction / Key Findings

    6.2. Historical Market Size Value (US$ billion) & Volume (meter) Analysis By Application, 2018 to 2022

    6.3. Current and Future Market Size Value (US$ billion) & Volume (meter) Analysis and Forecast By Application, 2023 to 2033

        6.3.1. Communication

        6.3.2. Oil & Gas

        6.3.3. Defense

        6.3.4. Scientific Research

    6.4. Y-o-Y Growth Trend Analysis By Application, 2018 to 2022

    6.5. Absolute $ Opportunity Analysis By Application, 2023 to 2033

7. Global Submarine Optical Fiber Cables Market Analysis 2018 to 2022 and Forecast 2023 to 2033, By Region

    7.1. Introduction

    7.2. Historical Market Size Value (US$ billion) & Volume (meter) Analysis By Region, 2018 to 2022

    7.3. Current Market Size Value (US$ billion) & Volume (meter) Analysis and Forecast By Region, 2023 to 2033

        7.3.1. North America

        7.3.2. Latin America

        7.3.3. Europe

        7.3.4. Asia Pacific

        7.3.5. Middle East and Africa

    7.4. Market Attractiveness Analysis By Region

8. North America Submarine Optical Fiber Cables Market Analysis 2018 to 2022 and Forecast 2023 to 2033, By Country

    8.1. Historical Market Size Value (US$ billion) & Volume (meter) Trend Analysis By Market Taxonomy, 2018 to 2022

    8.2. Market Size Value (US$ billion) & Volume (meter) Forecast By Market Taxonomy, 2023 to 2033

        8.2.1. By Country

            8.2.1.1. United States

            8.2.1.2. Canada

        8.2.2. By Type

        8.2.3. By Application

    8.3. Market Attractiveness Analysis

        8.3.1. By Country

        8.3.2. By Type

        8.3.3. By Application

    8.4. Key Takeaways

9. Latin America Submarine Optical Fiber Cables Market Analysis 2018 to 2022 and Forecast 2023 to 2033, By Country

    9.1. Historical Market Size Value (US$ billion) & Volume (meter) Trend Analysis By Market Taxonomy, 2018 to 2022

    9.2. Market Size Value (US$ billion) & Volume (meter) Forecast By Market Taxonomy, 2023 to 2033

        9.2.1. By Country

            9.2.1.1. Brazil

            9.2.1.2. Mexico

            9.2.1.3. Rest of Latin America

        9.2.2. By Type

        9.2.3. By Application

    9.3. Market Attractiveness Analysis

        9.3.1. By Country

        9.3.2. By Type

        9.3.3. By Application

    9.4. Key Takeaways

10. Europe Submarine Optical Fiber Cables Market Analysis 2018 to 2022 and Forecast 2023 to 2033, By Country

    10.1. Historical Market Size Value (US$ billion) & Volume (meter) Trend Analysis By Market Taxonomy, 2018 to 2022

    10.2. Market Size Value (US$ billion) & Volume (meter) Forecast By Market Taxonomy, 2023 to 2033

        10.2.1. By Country

            10.2.1.1. Germany

            10.2.1.2. United Kingdom

            10.2.1.3. France

            10.2.1.4. Spain

            10.2.1.5. Italy

            10.2.1.6. Rest of Europe

        10.2.2. By Type

        10.2.3. By Application

    10.3. Market Attractiveness Analysis

        10.3.1. By Country

        10.3.2. By Type

        10.3.3. By Application

    10.4. Key Takeaways

11. Asia Pacific Submarine Optical Fiber Cables Market Analysis 2018 to 2022 and Forecast 2023 to 2033, By Country

    11.1. Historical Market Size Value (US$ billion) & Volume (meter) Trend Analysis By Market Taxonomy, 2018 to 2022

    11.2. Market Size Value (US$ billion) & Volume (meter) Forecast By Market Taxonomy, 2023 to 2033

        11.2.1. By Country

            11.2.1.1. China

            11.2.1.2. Japan

            11.2.1.3. South Korea

            11.2.1.4. Singapore

            11.2.1.5. Thailand

            11.2.1.6. Indonesia

            11.2.1.7. Australia

            11.2.1.8. New Zealand

            11.2.1.9. Rest of Asia Pacific

        11.2.2. By Type

        11.2.3. By Application

    11.3. Market Attractiveness Analysis

        11.3.1. By Country

        11.3.2. By Type

        11.3.3. By Application

    11.4. Key Takeaways

12. Middle East and Africa Submarine Optical Fiber Cables Market Analysis 2018 to 2022 and Forecast 2023 to 2033, By Country

    12.1. Historical Market Size Value (US$ billion) & Volume (meter) Trend Analysis By Market Taxonomy, 2018 to 2022

    12.2. Market Size Value (US$ billion) & Volume (meter) Forecast By Market Taxonomy, 2023 to 2033

        12.2.1. By Country

            12.2.1.1. GCC Countries

            12.2.1.2. South Africa

            12.2.1.3. Israel

            12.2.1.4. Rest of Middle East and Africa

        12.2.2. By Type

        12.2.3. By Application

    12.3. Market Attractiveness Analysis

        12.3.1. By Country

        12.3.2. By Type

        12.3.3. By Application

    12.4. Key Takeaways

13. Key Countries Submarine Optical Fiber Cables Market Analysis

    13.1. United States

        13.1.1. Pricing Analysis

        13.1.2. Market Share Analysis, 2022

            13.1.2.1. By Type

            13.1.2.2. By Application

    13.2. Canada

        13.2.1. Pricing Analysis

        13.2.2. Market Share Analysis, 2022

            13.2.2.1. By Type

            13.2.2.2. By Application

    13.3. Brazil

        13.3.1. Pricing Analysis

        13.3.2. Market Share Analysis, 2022

            13.3.2.1. By Type

            13.3.2.2. By Application

    13.4. Mexico

        13.4.1. Pricing Analysis

        13.4.2. Market Share Analysis, 2022

            13.4.2.1. By Type

            13.4.2.2. By Application

    13.5. Germany

        13.5.1. Pricing Analysis

        13.5.2. Market Share Analysis, 2022

            13.5.2.1. By Type

            13.5.2.2. By Application

    13.6. United Kingdom

        13.6.1. Pricing Analysis

        13.6.2. Market Share Analysis, 2022

            13.6.2.1. By Type

            13.6.2.2. By Application

    13.7. France

        13.7.1. Pricing Analysis

        13.7.2. Market Share Analysis, 2022

            13.7.2.1. By Type

            13.7.2.2. By Application

    13.8. Spain

        13.8.1. Pricing Analysis

        13.8.2. Market Share Analysis, 2022

            13.8.2.1. By Type

            13.8.2.2. By Application

    13.9. Italy

        13.9.1. Pricing Analysis

        13.9.2. Market Share Analysis, 2022

            13.9.2.1. By Type

            13.9.2.2. By Application

    13.10. China

        13.10.1. Pricing Analysis

        13.10.2. Market Share Analysis, 2022

            13.10.2.1. By Type

            13.10.2.2. By Application

    13.11. Japan

        13.11.1. Pricing Analysis

        13.11.2. Market Share Analysis, 2022

            13.11.2.1. By Type

            13.11.2.2. By Application

    13.12. South Korea

        13.12.1. Pricing Analysis

        13.12.2. Market Share Analysis, 2022

            13.12.2.1. By Type

            13.12.2.2. By Application

    13.13. Singapore

        13.13.1. Pricing Analysis

        13.13.2. Market Share Analysis, 2022

            13.13.2.1. By Type

            13.13.2.2. By Application

    13.14. Thailand

        13.14.1. Pricing Analysis

        13.14.2. Market Share Analysis, 2022

            13.14.2.1. By Type

            13.14.2.2. By Application

    13.15. Indonesia

        13.15.1. Pricing Analysis

        13.15.2. Market Share Analysis, 2022

            13.15.2.1. By Type

            13.15.2.2. By Application

    13.16. Australia

        13.16.1. Pricing Analysis

        13.16.2. Market Share Analysis, 2022

            13.16.2.1. By Type

            13.16.2.2. By Application

    13.17. New Zealand

        13.17.1. Pricing Analysis

        13.17.2. Market Share Analysis, 2022

            13.17.2.1. By Type

            13.17.2.2. By Application

    13.18. GCC Countries

        13.18.1. Pricing Analysis

        13.18.2. Market Share Analysis, 2022

            13.18.2.1. By Type

            13.18.2.2. By Application

    13.19. South Africa

        13.19.1. Pricing Analysis

        13.19.2. Market Share Analysis, 2022

            13.19.2.1. By Type

            13.19.2.2. By Application

    13.20. Israel

        13.20.1. Pricing Analysis

        13.20.2. Market Share Analysis, 2022

            13.20.2.1. By Type

            13.20.2.2. By Application

14. Market Structure Analysis

    14.1. Competition Dashboard

    14.2. Competition Benchmarking

    14.3. Market Share Analysis of Top Players

        14.3.1. By Regional

        14.3.2. By Type

        14.3.3. By Application

15. Competition Analysis

    15.1. Competition Deep Dive

        15.1.1. ABB Ltd.

            15.1.1.1. Overview

            15.1.1.2. Product Portfolio

            15.1.1.3. Profitability by Market Segments

            15.1.1.4. Sales Footprint

            15.1.1.5. Strategy Overview

                15.1.1.5.1. Marketing Strategy

                15.1.1.5.2. Product Strategy

                15.1.1.5.3. Channel Strategy

        15.1.2. Bharti Airtel Ltd

            15.1.2.1. Overview

            15.1.2.2. Product Portfolio

            15.1.2.3. Profitability by Market Segments

            15.1.2.4. Sales Footprint

            15.1.2.5. Strategy Overview

                15.1.2.5.1. Marketing Strategy

                15.1.2.5.2. Product Strategy

                15.1.2.5.3. Channel Strategy

        15.1.3. Corning, Inc

            15.1.3.1. Overview

            15.1.3.2. Product Portfolio

            15.1.3.3. Profitability by Market Segments

            15.1.3.4. Sales Footprint

            15.1.3.5. Strategy Overview

                15.1.3.5.1. Marketing Strategy

                15.1.3.5.2. Product Strategy

                15.1.3.5.3. Channel Strategy

        15.1.4. Ciena Corporation

            15.1.4.1. Overview

            15.1.4.2. Product Portfolio

            15.1.4.3. Profitability by Market Segments

            15.1.4.4. Sales Footprint

            15.1.4.5. Strategy Overview

                15.1.4.5.1. Marketing Strategy

                15.1.4.5.2. Product Strategy

                15.1.4.5.3. Channel Strategy

        15.1.5. Amphenol Corporation

            15.1.5.1. Overview

            15.1.5.2. Product Portfolio

            15.1.5.3. Profitability by Market Segments

            15.1.5.4. Sales Footprint

            15.1.5.5. Strategy Overview

                15.1.5.5.1. Marketing Strategy

                15.1.5.5.2. Product Strategy

                15.1.5.5.3. Channel Strategy

        15.1.6. Chunghwa Telecom Co., Ltd.

            15.1.6.1. Overview

            15.1.6.2. Product Portfolio

            15.1.6.3. Profitability by Market Segments

            15.1.6.4. Sales Footprint

            15.1.6.5. Strategy Overview

                15.1.6.5.1. Marketing Strategy

                15.1.6.5.2. Product Strategy

                15.1.6.5.3. Channel Strategy

        15.1.7. Belden, Inc

            15.1.7.1. Overview

            15.1.7.2. Product Portfolio

            15.1.7.3. Profitability by Market Segments

            15.1.7.4. Sales Footprint

            15.1.7.5. Strategy Overview

                15.1.7.5.1. Marketing Strategy

                15.1.7.5.2. Product Strategy

                15.1.7.5.3. Channel Strategy

        15.1.8. China Unicom Global Limited

            15.1.8.1. Overview

            15.1.8.2. Product Portfolio

            15.1.8.3. Profitability by Market Segments

            15.1.8.4. Sales Footprint

            15.1.8.5. Strategy Overview

                15.1.8.5.1. Marketing Strategy

                15.1.8.5.2. Product Strategy

                15.1.8.5.3. Channel Strategy

        15.1.9. AFL

            15.1.9.1. Overview

            15.1.9.2. Product Portfolio

            15.1.9.3. Profitability by Market Segments

            15.1.9.4. Sales Footprint

            15.1.9.5. Strategy Overview

                15.1.9.5.1. Marketing Strategy

                15.1.9.5.2. Product Strategy

                15.1.9.5.3. Channel Strategy

        15.1.10. Dialog Axiata PLC

            15.1.10.1. Overview

            15.1.10.2. Product Portfolio

            15.1.10.3. Profitability by Market Segments

            15.1.10.4. Sales Footprint

            15.1.10.5. Strategy Overview

                15.1.10.5.1. Marketing Strategy

                15.1.10.5.2. Product Strategy

                15.1.10.5.3. Channel Strategy

16. Assumptions & Acronyms Used

17. Research Methodology

Research Methodology Framework for Market Research Excellence

At Persistence Market Research, we implement a comprehensive, validated, and multi-dimensional approachto market analysis that delivers actionable insights across complex market landscapes. Our methodology combines the analytical rigor of leading consulting firms with innovative research techniques, ensuring robust market assessments that guide strategic decision-making with confidence.

Core Research Philosophy

Our methodology is built on four foundational pillars:

Research Philosophy Image

At Persistence Market Research, our methodology is designed to transcend conventional market studies by combining analytical rigor, multi-source validation, and future-focused insights.

We integrate advanced research frameworks, robust data collection strategies, cutting-edge analytics, and innovative technologies to deliver a 360-degree view of complex markets.

We integrate advanced research frameworks, robust data collection strategies, cutting-edge analytics, and innovative technologies to deliver a 360-degree view of complex markets.

Each stage spanning from strategic scoping and hypothesis-building to competitive intelligence, quality validation, and actionable recommendations is engineered to provide clients with unmatched clarity, precision, and confidence in decision-making.

By embedding innovation and technology at the core, our approach ensures that insights are not only comprehensive but also predictive, empowering businesses to seize opportunities, mitigate risks, and achieve sustainable growth

Research Philosophy Image

Capturing Key Information and Events

During this phase, key research objectives focus on essential information and data points for assessing the market, including:

Research Philosophy Image

TAM-SAM-SOM Framework Implementation

We employ both top-down and bottom-up approaches to ensure accurate market sizing.

Top-Down Market SizingBottom-Up Market Sizing
Universe Definition: Total global/regional market identificationUnit Economics: Average transaction values, purchase frequencies, customer lifecycle
Segmentation Filters: Geographic, demographic, and behavioral constraintsCustomer Segmentation: Detailed buyer persona development and sizing
Market Share Analysis: Competitive landscape assessment and share allocationPenetration Analysis: Market penetration rates by segment and geography
Growth Rate Application: Historical trends and forward-looking growth assumptionsScaling Methodology: Extrapolation techniques with confidence intervals

Validation & Cross-Verification

  • Triangulation: Comparing top-down and bottom-up results for consistency
  • Sensitivity Analysis: Testing key assumptions and parameter variations
  • Peer Benchmarking: Comparison with analogous markets and industry benchmarks
  • Expert Review: External validation through industry specialist consultation

Research Philosophy Image

Forecasting & Projection Modeling

Our proprietary forecasting models incorporate multiple variables and scenarios.

Forecasting Components

  • Historical Trend Analysis: 10-year historical growth patterns and cyclical variations
  • Driver-Based Modeling: Economic indicators, demographic shifts, technology adoption
  • Scenario Planning: Base case, optimistic, and conservative projections
  • Monte Carlo Simulations: Probability-weighted outcomes and risk assessments

Model Validation

  • Back-Testing: Historical accuracy assessment over 3–5-year periods
  • Cross-Validation: Multiple modeling approaches for result comparison
  • External Benchmarking: Comparison with established market forecasts
  • Continuous Calibration: Quarterly model updates based on new data

Comprehensive Data Collection Strategy

Our secondary research phase establishes a robust knowledge base utilizing diverse, credible sources.

Secondary Data Sourcess

  • Industry Publications & Reports
  • Government & Regulatory Data
  • Financial Intelligence (filings & reports)
  • Academic Research & Digital Intelligence

Quality Assurance Protocol

  • Source credibility assessment and publication date validation
  • Data consistency checks across multiple sources
  • Bias identification and neutralization techniques
  • Information gap tracking for primary research prioritization

Research Philosophy Image

Primary Research Excellence

Our primary research methodology employs best-in-class techniques to capture unique market insights.

Quantitative Research Methods

  • Large-Scale Surveys: Statistically representative samples with 95% confidence intervals
  • Survey Methodology: Multi-channel deployment (online, telephone, in-person)
  • Question Architecture and Response Optimization

Qualitative Research Methods

  • Executive Interviews
  • Focus Groups
  • Expert Consultations

Quality Assurance & Validation Framework

Multi-Stage Validation Process

  • Source Verification and Consistency Testing
  • Outlier Detection and Bias Assessment
  • Peer Review Process and External Validation
  • Sensitivity Analysis and Confidence Intervals

Research Philosophy Image

Methodology Validation & Credibility

Our research methodology has been extensively validated through:

  • Academic Partnerships: Collaborations with top-tier business schools and research institutions
  • Client Success Stories: Documented case studies demonstrating research impact and ROI
  • Continuous Benchmarking: Performance comparison with leading global research firms

This comprehensive methodology framework positions Persistence Market Research at the forefront of market intelligence, combining the analytical sophistication of top-tier consulting firms with innovative research techniques. Our approach ensures that every market assessment delivers precise, actionable, and strategically valuable insights that drive business success in competitive market environments.

Ready to unlock your market potential? Contact our research experts to discuss how our validated methodology can transform your strategic decision-making with data-driven market intelligence.

Copyright © 2026 Persistence Market Research. All Rights Reserved

Connect With Us -