


- Automation & Robotics
- Deflectometer Market
Deflectometer Market Size, Share, and Growth Forecast 2026 - 2033
Deflectometer Market by Equipment Type (Falling Weight Deflectometer (FWD), Rolling Wheel Deflectometer (RWD), Static Deflectometer, Others), Application (Road Construction, Railway Construction, Bridges, Others), and Regional Analysis, 2026 - 2033
Deflectometer Market Size and Trends Analysis
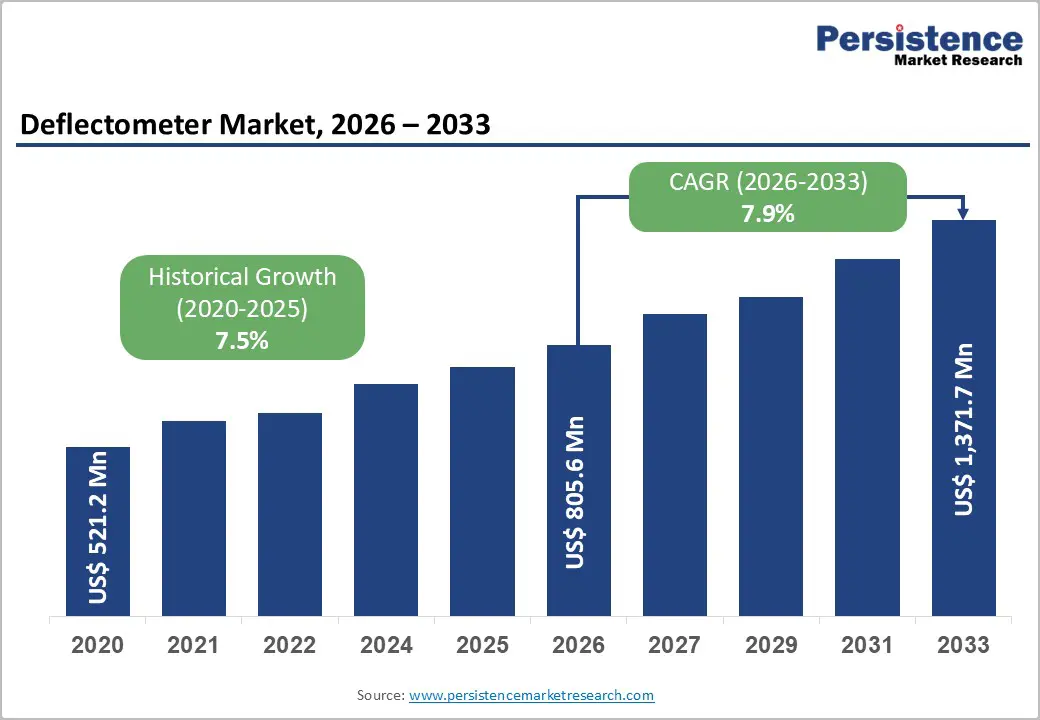
The global deflectometer market size is expected to be valued at US$805.6 million in 2026 and projected to reach US$1,371.7 million by 2033, growing at a CAGR of 7.9% during the forecast period of 2026-2033, driven by sustained global infrastructure investments, with governments prioritizing pavement durability assessment to enhance road safety and extend asset lifecycles.
As substantial funding is allocated toward road rehabilitation and renewal programs, deflectometers play a critical role in enabling accurate structural evaluations, helping authorities optimize maintenance planning and improve the long-term performance of transportation networks.
Key Industry Highlights:
- Dominant Region: North America is expected to dominate the market with a 40% share in 2026, driven by high demand for reliable pavement evaluation and infrastructure maintenance.
- Fastest-growing Region: Asia Pacific, driven by infrastructure expansion, urbanization, and high demand for pavement evaluation using FWDs and RWDs.
- Leading Equipment Type: Falling Weight Deflectometer (FWD) is expected to dominate with a 44% market share, driven by its reliability in assessing pavement structural integrity.
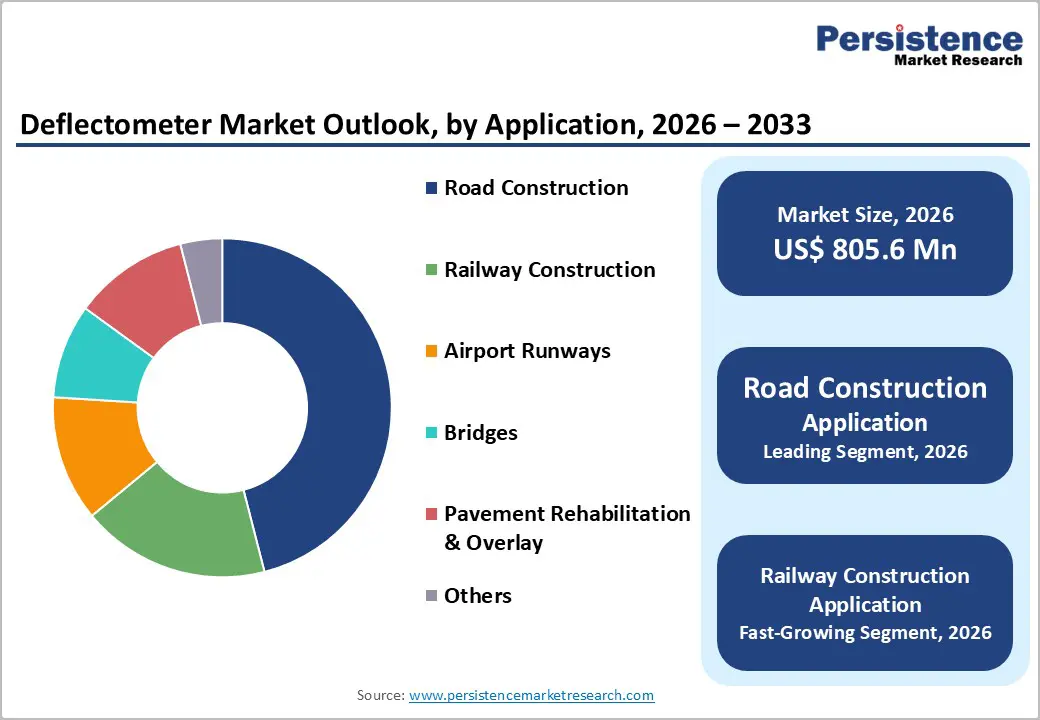
- Dominant Application: Road construction, accounting for over 46% of the total share, driven by the need for precise measurement of pavement stiffness and structural capacity, enabling authorities to plan maintenance and rehabilitation programs more efficiently and ensure long-term roadway performance.
| Key Insights | Details |
|---|---|
|
Deflectometer Market Size (2026E) |
US$805.6 Mn |
|
Market Value Forecast (2033F) |
US$1,371.7 Mn |
|
Projected Growth CAGR (2026-2033) |
7.9% |
|
Historical Market Growth (2020-2025) |
7.5% |
Market Factors - Growth, Barriers, and Opportunity Analysis
Growth Analysis - Global Infrastructure Modernization Initiatives
Government-led infrastructure development is pushing demand for pavement evaluation technologies such as deflectometers, as aging road networks and new transport corridors require upgraded, resilient surfaces. McKinsey estimates that about US$106 trillion in global infrastructure investment will be needed by 2040 to meet requirements for new and modernized assets, including roads, bridges, and highways, highlighting the scale of public spending and renewal efforts worldwide. Many national programmes link large capital outlays with quality assurance needs; for example, Australia’s five-year major public infrastructure pipeline reached around US$242 billion, with transport accounting for the largest share, as governments aim to upgrade and expand networks. These broad government programs create sustained requirements for structural assessment tools that help planners and engineers prioritize maintenance and validate construction quality.
In major economies, fiscal policy has led to significant infrastructure budgets that fund road and pavement improvements, driving demand for structural evaluation equipment. India’s federal infrastructure budget was raised to a record INR 12.2 trillion (~US$133 billion) for fiscal 2026-27, reflecting an 11.4% year-on-year increase, as authorities seek to boost connectivity and economic activity. In Germany, a special fund for infrastructure and climate neutrality is earmarked €500 billion (US$590 billion) for modernization through 2026 and beyond, including transport infrastructure investments that directly benefit pavement assessment and monitoring solutions.
Emphasis on Non-Destructive Testing (NDT) Standards
Standards for non-destructive testing (NDT), such as those developed by ISO and ASTM and adopted or referenced by government regulatory frameworks, play a critical role in shaping demand for deflectometer systems by reinforcing quality assurance and safety compliance across industries. NDT standards ensure that materials, infrastructure, and components are tested without damage while meeting legal and performance criteria; this drives broader adoption of inspection technologies as companies align with these criteria. For example, the global NDT market was valued at around US$10.15 billion in 2023 and continues to expand rapidly, with segments such as ultrasonic testing accounting for over 30% of the NDT market, a reflection of widespread standardized inspection requirements in sectors like aerospace and oil & gas that intersect with deflectometer use for surface and structural evaluation.
In the transportation and infrastructure sectors, compliance with formal inspection guidelines influences equipment uptake, as deflectometers help assess pavement and material integrity alongside traditional NDT tools. Government agencies mandate periodic inspection cycles that reference established NDT protocols, increasing investment in allied measurement technologies. With the global NDT market projected to nearly double, by some estimates, by the end of this decade as safety and quality compliance tighten, standardized testing norms underpin sustained capital flows into inspection and monitoring platforms that work in concert with deflectometers to deliver comprehensive structural assessments.
Barriers Analysis - Maintenance and Calibration Requirements
Deflectometers require precise calibration and regular maintenance to ensure accurate measurement of pavement and structural performance. Calibration involves adjusting the sensors and load-measuring components to align with standardized reference values, which prevents deviations that could lead to incorrect assessments of surface deflection or material integrity. Over time, mechanical wear, environmental exposure, and repeated use can reduce equipment sensitivity, making maintenance essential.
Maintenance activities include cleaning sensor surfaces, checking electronic components, replacing worn parts, and performing software updates. Neglecting these tasks can result in inaccurate data, increased downtime, and higher long-term costs. For organizations with multiple deflectometers, coordinating periodic calibration schedules and maintenance routines adds logistical complexity and requires trained personnel.
Integration Challenges with Existing Systems
Deflectometers generate large volumes of data that must often be integrated into existing infrastructure management systems, posing significant challenges. Many legacy systems in the transportation and construction sectors are not designed to handle high-frequency measurement data or the complex formats produced by modern deflectometers. This mismatch can lead to data incompatibility, requiring additional software development or middleware to translate, process, and store the information effectively.
Integrating deflectometer outputs with Geographic Information Systems (GIS), asset management platforms, or predictive maintenance tools may also require specialized technical expertise. Organizations need to ensure that data flows smoothly between devices and software while maintaining accuracy, security, and compliance with reporting standards. These integration challenges can increase implementation timelines and costs, making it harder for agencies or contractors to fully leverage deflectometer capabilities.
Opportunity Analysis - Adoption of Rolling Wheel Deflectometer (RWD) Technology
The roll-over deflection testing capability of Rolling Wheel Deflectometer systems presents a compelling growth opportunity within the broader deflectometer market. Government research from the Federal Highway Administration highlights that RWD units can collect continuous pavement deflection profiles at normal highway speeds of up to about 104km/h and cover roughly 161–321 km (100–200 mi) of roadway per day without traffic control or lane closures, making network-level structural evaluation far more efficient than traditional methods. This enhanced surveying capability supports pavement management systems by yielding large datasets quickly, enabling agencies to prioritize maintenance and rehabilitation planning across extensive highway networks.
From a market standpoint, Rolling Wheel Deflectometers (RWDs) constitute an important segment of the global deflectometer industry and are expected to experience strong growth over the coming decade, driven by rising infrastructure investments worldwide. Within the broader market, RWDs form part of the advanced non-destructive testing (NDT) landscape, gaining momentum as transportation agencies increasingly prioritize continuous, high-speed data collection for performance monitoring and asset management. Their ability to deliver high throughput, minimize traffic disruption, and generate network-level structural insights positions RWD technology as a compelling strategic opportunity for manufacturers and infrastructure authorities seeking scalable and efficient deflection testing solutions.
Integration with Pavement Management Systems
Deeper integration of deflection data into comprehensive pavement management systems (PMS). Government highway research and transportation agencies, such as the U.S. Federal Highway Administration, emphasize the systematic collection and use of pavement condition data to support network-level maintenance and prioritization planning through PMS programs. Deflectometric measurements, such as those from Falling Weight Deflectometers (FWDs) and Traffic Speed Deflectometers (TSDs), generate quantitative structural response data that transportation authorities use to evaluate stiffness and remaining life of pavement segments across large road networks. With data standardized and fed into GIS-based PMS platforms, this structural information can be cross-referenced with surface condition metrics and historical performance trends, enabling more informed budgeting and work-scheduling decisions. For example, TSD systems can test approximately 300–500 lane km per day at traffic speeds, offering high-coverage deflection profiles suitable for network-level PMS integration.
By linking deflectometer outputs directly to PMS software dashboards, infrastructure owners can improve predictive maintenance planning and reduce pavement lifecycle costs. Deflection and stiffness measurements help rank pavement sections by structural urgency, allowing agencies to sequence rehabilitation works efficiently rather than relying solely on visual surface distress assessments. Government research also supports the development of interoperable data standards and analytical tools that make deflectometer outputs more actionable within PMS environments.
Category-wise Analysis
Equipment Type Insights
Falling weight deflectometer (FWD) is anticipated to dominate and be the fastest growing, holding 44% share in 2026, driven by its reliability in assessing pavement structural integrity. These devices simulate vehicle loads and measure pavement deflections, providing critical data for maintenance planning and lifecycle management. Government agencies and road authorities increasingly prefer FWDs due to their accuracy, standardization, and ability to generate actionable insights for network-level pavement management systems. The Pennsylvania Department of Transportation (PennDOT) has been performing Falling Weight Deflectometer (FWD) testing since the 1980s, using equipment manufactured by Dynatest. PennDOT’s FWD units, such as the Dynatest Model 8000FWD, are used to collect structural performance data on highway pavements and support maintenance and rehabilitation decision-making across the state’s road network.
Application Insights
Road construction is expected to lead the market, with an over 46% share in 2026, driven by increasing investments in highway development and urban road networks. Deflectometers provide accurate measurements of pavement stiffness and structural capacity, helping authorities plan maintenance and rehabilitation efficiently. The technology enables assessment of load-bearing capacity, reducing premature failures and optimizing lifecycle costs. Governments and transportation agencies prefer deflectometer testing for both new construction and periodic evaluations of existing roads. The Thailand Department of Highways (DOH) has deployed the Dynatest Model 8000 Falling Weight Deflectometer to conduct structural evaluations of major highway pavements. The DOH uses the Dynatest system to measure pavement deflections and back-calculate layer moduli and thicknesses, helping engineers assess load-carrying capacity and prioritize maintenance or strengthening works on road sections.
Railway construction is likely to be the fastest-growing application, powered by the rapid expansion and modernization of rail networks worldwide. Deflectometers help assess trackbed and subgrade stiffness, ensuring safe load distribution and preventing premature track failures. High-speed and heavy freight rail systems require precise structural evaluation, making deflectometer testing critical for maintenance planning and track rehabilitation. Government and private railway authorities increasingly adopt these devices to optimize lifecycle costs and improve service reliability. Railway construction is based on research and pilot testing by Transportation Technology Center, Inc. (TTCI) in the U.S., where a portable Falling Weight Deflectometer (FWD) was deployed to assess track substructure conditions, including ballast and subgrade stiffness. TTCI’s FWD apparatus measured deflection signatures and shear wave speeds, helping engineers identify weak track support areas for maintenance planning before problems escalate.
Regional Insights
North America Deflectometer Market Trends
North America is projected to lead, accounting for 40% share in 2026, fueled by high demand for reliable pavement evaluation and infrastructure maintenance. Federal and state transportation agencies extensively use deflectometers, such as Falling Weight Deflectometers (FWDs) and Rolling Wheel Deflectometers (RWDs), to measure pavement deflection and assess structural integrity. These tools provide critical data for planning maintenance, rehabilitation, and overlay projects, helping agencies optimize budgets and extend pavement life. The region’s established road and highway networks, coupled with aging infrastructure, increase the necessity for continuous structural assessment and monitoring.
Investment in advanced testing technologies also drives market growth, as agencies integrate deflectometer outputs with digital pavement management systems for network-level decision-making. High-speed and automated testing solutions allow transportation authorities to cover larger sections of road more efficiently, improving inspection frequency and accuracy. Airports, bridges, and railway networks are also increasingly employing deflectometer technologies to ensure safety and compliance with stringent engineering standards. By 2026, deflectometers are expected to remain central to infrastructure evaluation in North America, supporting both new construction and ongoing maintenance projects.
Europe Deflectometer Market Trends
Europe is witnessing a steady growth propelled by the region’s focus on sustainable infrastructure and strict regulatory standards for road and airport pavements. Governments and transportation authorities across countries such as Germany, France, and the U.K. increasingly rely on Falling Weight Deflectometers (FWDs) and Rolling Wheel Deflectometers (RWDs) to evaluate pavement structural integrity, monitor layer stiffness, and plan maintenance activities. These tools provide quantitative insights that help optimize repair schedules, reduce lifecycle costs, and enhance the durability of highways, urban roads, and airport runways. Aging road networks and high traffic volumes in Europe further drive demand for frequent and precise deflection testing.
Technological advancements also shape market trends, with European agencies integrating deflectometer outputs into pavement management systems (PMS) for data-driven decision-making. Portable and automated testing equipment enables faster surveys, covering larger sections of road and rail networks efficiently. Deflectometers are increasingly employed in rehabilitation projects, overlay assessments, and new construction to ensure compliance with European engineering standards and environmental guidelines. Collaboration with technology providers and universities promotes research on innovative testing methods, improving data accuracy and operational efficiency.
Asia Pacific Deflectometer Market Trends
Asia Pacific is likely to be the fastest-growing market in 2026, driven by extensive infrastructure development, urbanization, and expanding transportation networks in countries such as China, India, Japan, and Australia. Governments and private agencies are investing heavily in highways, railways, and airport projects, creating strong demand for pavement evaluation and structural assessment tools. Falling Weight Deflectometers (FWDs) and Rolling Wheel Deflectometers (RWDs) are widely adopted to measure pavement deflection, assess subgrade stiffness, and guide maintenance and rehabilitation planning. High traffic volumes, increasing freight transportation, and ambitious high-speed rail projects further drive the need for accurate structural monitoring.
Portable, high-speed deflectometers enable efficient data collection across large road and railway networks, reducing inspection time and improving accuracy. Integration of deflection data with digital pavement management systems allows engineers to make informed decisions on repair prioritization, budget allocation, and lifecycle optimization. Asia Pacific’s focus on modern, durable, and safe infrastructure supports ongoing adoption of deflectometer technologies for new construction as well as rehabilitation of existing networks.

Competitive Landscape
The global deflectometer market is highly consolidated, with key players such as Dynatest and ZORN controlling approximately 60% of the market through proprietary sensor technologies and specialized equipment offerings. These companies maintain their leadership by continually investing in advanced features, including Rolling Wheel Deflectometer (RWD) systems with integrated GNSS capabilities, allowing precise, high-speed deflection measurements and georeferenced data for network-level pavement assessments.
Differentiation also comes from high-resolution data acquisition, with some systems offering 20-bit resolution, enabling more accurate analysis of pavement stiffness, subgrade strength, and structural performance. To expand accessibility, particularly in emerging markets, manufacturers are introducing rental and leasing models, allowing smaller agencies or contractors to utilize state-of-the-art deflectometers without high upfront costs. This combination of proprietary technology, continuous innovation, and flexible business models ensures that these specialist companies retain market dominance while addressing the diverse infrastructure evaluation needs of global road, railway, and airport projects.
Key Industry Developments:
- In April 2025, ICC-IMS launched the Fast-Falling Weight Deflectometer (FastFWD), offering advanced pavement testing services with rapid, repeatable, and objective evaluations.
- In February 2025, Greenwood Engineering held a webinar focused on the latest Traffic Speed Deflectometer (TSD) applications for road and runway management.
Companies Covered in Deflectometer Market
- Illinois Tool Works Inc.
- Dynatest
- PaveTesting Limited
- Humboldt Mfg. Co.
- Controls Group
- Aimil Ltd.
- Olson Instruments
- EPSILON Technology Corp.
- Abatech
- Greenwood Engineering
- ZORN Instruments
- HMP GmbH & Co. KG
- KUAB
- Cooper Research Technology
- Pavement Recycling Systems
Frequently Asked Questions
The global deflectometer market is expected to reach US$805.6 million in 2026.
Growing investment in highways, airports, railways, and urban roads globally drives the need for accurate pavement structural assessment.
The deflectometer market growth is poised to CAGR 7.9% in 2026 to 2033.
Modern deflectometers with high-resolution data acquisition, GNSS connectivity, and integration with Pavement Management Systems (PMS) offer opportunities for predictive maintenance, network-level decision-making, and remote data analysis.
Leading key players are Illinois Tool Works Inc., Dynatest, PaveTesting Limited, Humboldt Mfg. Co., Controls Group, Aimil Ltd., Olson Instruments, and EPSILON Technology Corp.


