


- Executive Summary
- Global Industrial Plugs and Sockets Market Snapshot, 2025 and 2032
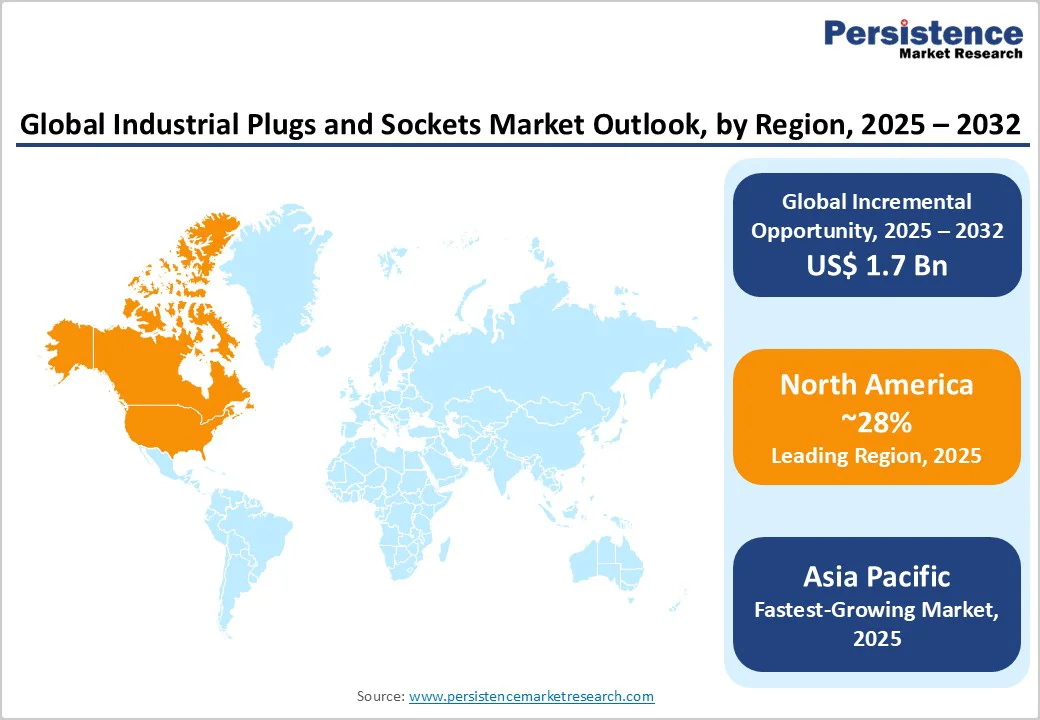
- Market Opportunity Assessment, 2025 – 2032, US$ Bn
- Key Market Trends
- Future Market Projections
- Premium Market Insights
- Industry Vertical Developments and Key Market Events
- PMR Analysis and Recommendations
- Market Overview
- Market Scope and Definition
- Market Dynamics
- Drivers
- Restraints
- Opportunity
- Key Trends
- Macro-economic Factors
- Global Sectoral Outlook
- Global GDP Growth Outlook
- COVID-19 Impact Analysis
- Forecast Factors – Relevance and Impact
- Value Added Insights
- Tool Adoption Analysis
- Regulatory Landscape
- Value Chain Analysis
- PESTLE Analysis
- Porter’s Five Force Analysis
- Price Analysis, 2024A
- Key Highlights
- Key Factors Impacting Deployment Costs
- Pricing Analysis, By Degree of Protection
- Global Industrial Plugs and Sockets Market Outlook
- Key Highlights
- Market Volume (Units) Projections
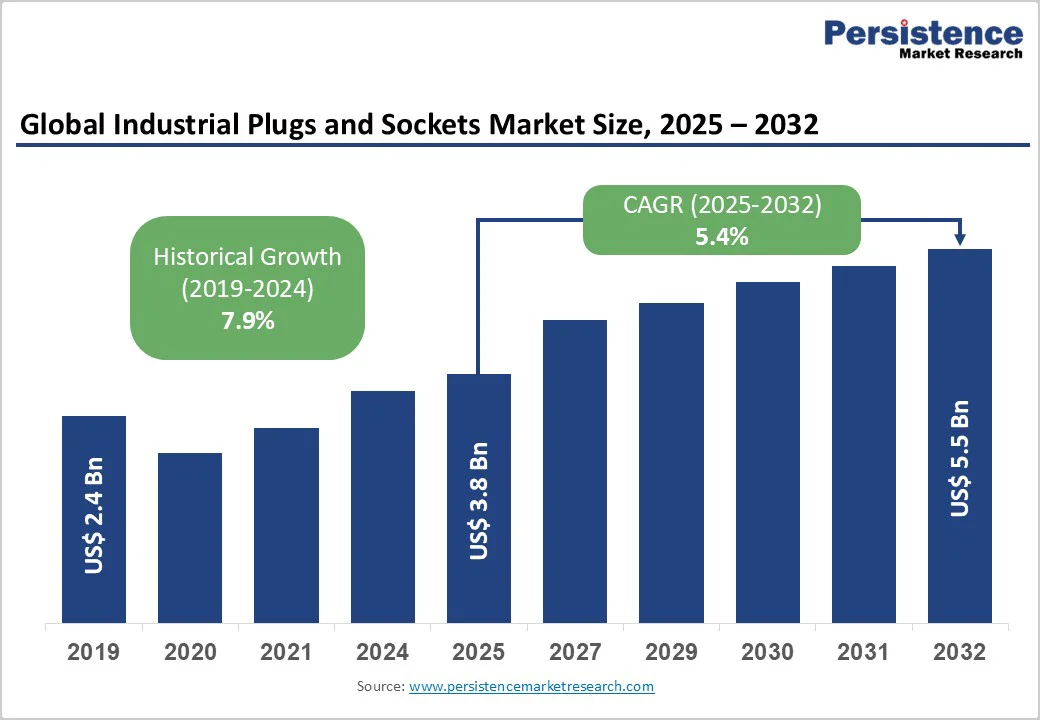
- Market Size (US$ Bn) and Y-o-Y Growth
- Absolute $ Opportunity
- Market Size (US$ Bn) and Volume (Units) Analysis and Forecast
- Historical Market Size (US$ Bn) Analysis, 2019-2024
- Current Market Size (US$ Bn) Analysis and Forecast, 2025 – 2032
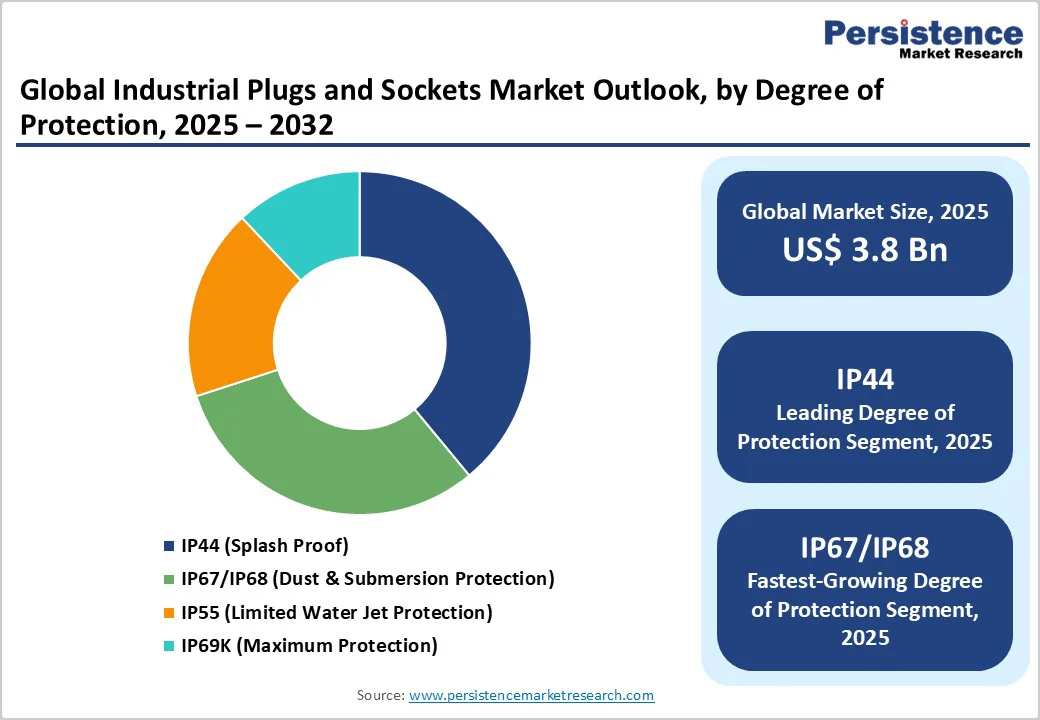
- Global Industrial Plugs and Sockets Market Outlook: Degree of Protection
- Introduction / Key Findings
- Historical Market Size (US$ Bn) and Volume (Units) Analysis, By Degree of Protection, 2019 – 2024
- Current Market Size (US$ Bn) and Volume (Units) Analysis and Forecast, By Degree of Protection, 2025 – 2032
- IP44 (Splash Proof)
- IP55 (Limited Water Jet Protection)
- IP67/IP68 (Complete Dust & Submersion Protection)
- IP69K (Maximum Protection)
- Market Attractiveness Analysis: Degree of Protection
- Global Industrial Plugs and Sockets Market Outlook: Industry Vertical
- Introduction / Key Findings
- Historical Market Size (US$ Bn) Analysis, By Industry Vertical, 2019 – 2024
- Current Market Size (US$ Bn) Analysis and Forecast, By Industry Vertical, 2025 – 2032
- Manufacturing & Automotive
- Oil & Gas
- Construction & Infrastructure
- Food & Beverage
- Energy & Power Generation
- Marine & Offshore
- Transportation & Rail
- Robotics & Automation
- Market Attractiveness Analysis: Industry Vertical
- Global Industrial Plugs and Sockets Market Outlook: Amperage
- Introduction / Key Findings
- Historical Market Size (US$ Bn) Analysis, By Amperage, 2019 – 2024
- Current Market Size (US$ Bn) Analysis and Forecast, By Amperage, 2025 – 2032
- 16A (Low Current)
- 32A (Medium Current)
- 63A (High Current)
- 125A+ (Ultra-High Current)
- Up to 800A (Specialized Ultra-High Current)
- Market Attractiveness Analysis: Amperage
- Key Highlights
- Global Industrial Plugs and Sockets Market Outlook: Region
- Key Highlights
- Historical Market Size (US$ Bn) and Volume (Units) Analysis, By Region, 2019 – 2024
- Current Market Size (US$ Bn) and Volume (Units) Analysis and Forecast, By Region, 2025 – 2032
- North America
- Europe
- East Asia
- South Asia and Oceania
- Latin America
- Middle East & Africa
- Market Attractiveness Analysis: Region
- North America Industrial Plugs and Sockets Market Outlook
- Key Highlights
- Historical Market Size (US$ Bn) Analysis, By Market, 2019 – 2024
- By Country
- By Degree of Protection
- By Industry Vertical
- By Amperage
- Current Market Size (US$ Bn) Analysis and Forecast, By Country, 2025 – 2032
- U.S.
- Canada
- Current Market Size (US$ Bn) and Volume (Units) Analysis and Forecast, By Degree of Protection, 2025 – 2032
- IP44 (Splash Proof)
- IP55 (Limited Water Jet Protection)
- IP67/IP68 (Complete Dust & Submersion Protection)
- IP69K (Maximum Protection)
- Current Market Size (US$ Bn) Analysis and Forecast, By Industry Vertical, 2025 – 2032
- Manufacturing & Automotive
- Oil & Gas
- Construction & Infrastructure
- Food & Beverage
- Energy & Power Generation
- Marine & Offshore
- Transportation & Rail
- Robotics & Automation
- Current Market Size (US$ Bn) Analysis and Forecast, By Amperage, 2025-2032
- 16A (Low Current)
- 32A (Medium Current)
- 63A (High Current)
- 125A+ (Ultra-High Current)
- Up to 800A (Specialized Ultra-High Current)
- Market Attractiveness Analysis
- Europe Industrial Plugs and Sockets Market Outlook
- Key Highlights
- Historical Market Size (US$ Bn) Analysis, By Market, 2019 – 2024
- By Country
- By Degree of Protection
- By Industry Vertical
- Amperage
- Current Market Size (US$ Bn) Analysis and Forecast, By Country, 2025 – 2032
- Germany
- France
- U.K.
- Italy
- Spain
- Russia
- Türkiye
- Rest of Europe
- Current Market Size (US$ Bn) and Volume (Units) Analysis and Forecast, By Degree of Protection, 2025 – 2032
- IP44 (Splash Proof)
- IP55 (Limited Water Jet Protection)
- IP67/IP68 (Complete Dust & Submersion Protection)
- IP69K (Maximum Protection)
- Current Market Size (US$ Bn) Analysis and Forecast, By Industry Vertical, 2025 – 2032
- Manufacturing & Automotive
- Oil & Gas
- Construction & Infrastructure
- Food & Beverage
- Energy & Power Generation
- Marine & Offshore
- Transportation & Rail
- Robotics & Automation
- Current Market Size (US$ Bn) Analysis and Forecast, By Amperage, 2025-2032
- 16A (Low Current)
- 32A (Medium Current)
- 63A (High Current)
- 125A+ (Ultra-High Current)
- Up to 800A (Specialized Ultra-High Current)
- Market Attractiveness Analysis
- East Asia Industrial Plugs and Sockets Market Outlook
- Key Highlights
- Historical Market Size (US$ Bn) Analysis, By Market, 2019 – 2024
- By Country
- By Degree of Protection
- By Industry Vertical
- By Amperage
- Current Market Size (US$ Bn) Analysis and Forecast, By Country, 2025 – 2032
- China
- Japan
- South Korea
- Current Market Size (US$ Bn) and Volume (Units) Analysis and Forecast, By Degree of Protection, 2025 – 2032
- IP44 (Splash Proof)
- IP55 (Limited Water Jet Protection)
- IP67/IP68 (Complete Dust & Submersion Protection)
- IP69K (Maximum Protection)
- Current Market Size (US$ Bn) Analysis and Forecast, By Industry Vertical, 2025 – 2032
- Manufacturing & Automotive
- Oil & Gas
- Construction & Infrastructure
- Food & Beverage
- Energy & Power Generation
- Marine & Offshore
- Transportation & Rail
- Robotics & Automation
- Current Market Size (US$ Bn) Analysis and Forecast, By Amperage, 2025-2032
- 16A (Low Current)
- 32A (Medium Current)
- 63A (High Current)
- 125A+ (Ultra-High Current)
- Up to 800A (Specialized Ultra-High Current)
- Market Attractiveness Analysis
- South Asia & Oceania Industrial Plugs and Sockets Market Outlook
- Key Highlights
- Historical Market Size (US$ Bn) Analysis, By Market, 2019 – 2024
- By Country
- By Degree of Protection
- By Industry Vertical
- By Amperage
- Current Market Size (US$ Bn) Analysis and Forecast, By Country, 2025 – 2032
- India
- Southeast Asia
- ANZ
- Rest of South Asia & Oceania
- Current Market Size (US$ Bn) and Volume (Units) Analysis and Forecast, By Degree of Protection, 2025 – 2032
- IP44 (Splash Proof)
- IP55 (Limited Water Jet Protection)
- IP67/IP68 (Complete Dust & Submersion Protection)
- IP69K (Maximum Protection)
- Current Market Size (US$ Bn) Analysis and Forecast, By Industry Vertical, 2025 – 2032
- Manufacturing & Automotive
- Oil & Gas
- Construction & Infrastructure
- Food & Beverage
- Energy & Power Generation
- Marine & Offshore
- Transportation & Rail
- Robotics & Automation
- Current Market Size (US$ Bn) Analysis and Forecast, By Amperage, 2025-2032
- 16A (Low Current)
- 32A (Medium Current)
- 63A (High Current)
- 125A+ (Ultra-High Current)
- Up to 800A (Specialized Ultra-High Current)
- Market Attractiveness Analysis
- Latin America Industrial Plugs and Sockets Market Outlook
- Key Highlights
- Historical Market Size (US$ Bn) Analysis, By Market, 2019 – 2024
- By Country
- By Degree of Protection
- By Industry Vertical
- By Amperage
- Current Market Size (US$ Bn) Analysis and Forecast, By Country, 2025 – 2032
- Brazil
- Mexico
- Rest of Latin America
- Current Market Size (US$ Bn) and Volume (Units) Analysis and Forecast, By Degree of Protection, 2025 – 2032
- IP44 (Splash Proof)
- IP55 (Limited Water Jet Protection)
- IP67/IP68 (Complete Dust & Submersion Protection)
- IP69K (Maximum Protection)
- Current Market Size (US$ Bn) Analysis and Forecast, By Industry Vertical, 2025 – 2032
- Manufacturing & Automotive
- Oil & Gas
- Construction & Infrastructure
- Food & Beverage
- Energy & Power Generation
- Marine & Offshore
- Transportation & Rail
- Robotics & Automation
- Current Market Size (US$ Bn) Analysis and Forecast, By Amperage, 2025-2032
- 16A (Low Current)
- 32A (Medium Current)
- 63A (High Current)
- 125A+ (Ultra-High Current)
- Up to 800A (Specialized Ultra-High Current)
- Market Attractiveness Analysis
- Middle East & Africa Industrial Plugs and Sockets Market Outlook
- Key Highlights
- Historical Market Size (US$ Bn) Analysis, By Market, 2019 – 2024
- By Country
- By Degree of Protection
- By Industry Vertical
- By Amperage
- Current Market Size (US$ Bn) Analysis and Forecast, By Country, 2025 – 2032
- GCC Countries
- Egypt
- South Africa
- Northern Africa
- Rest of Middle East & Africa
- Current Market Size (US$ Bn) and Volume (Units) Analysis and Forecast, By Degree of Protection, 2025 – 2032
- IP44 (Splash Proof)
- IP55 (Limited Water Jet Protection)
- IP67/IP68 (Complete Dust & Submersion Protection)
- IP69K (Maximum Protection)
- Current Market Size (US$ Bn) Analysis and Forecast, By Industry Vertical, 2025 – 2032
- Manufacturing & Automotive
- Oil & Gas
- Construction & Infrastructure
- Food & Beverage
- Energy & Power Generation
- Marine & Offshore
- Transportation & Rail
- Robotics & Automation
- Current Market Size (US$ Bn) Analysis and Forecast, By Amperage, 2025-2032
- 16A (Low Current)
- 32A (Medium Current)
- 63A (High Current)
- 125A+ (Ultra-High Current)
- Up to 800A (Specialized Ultra-High Current)
- Market Attractiveness Analysis
- Competition Landscape
- Market Share Analysis, 2024
- Market Structure
- Competition Intensity Mapping By Market
- Competition Dashboard
- Company Profiles (Details – Overview, Financials, Strategy, Recent Developments)
- Legrand SA
- Overview
- Segments and Deployments
- Key Financials
- Market Developments
- Market Strategy
- Schneider Electric SE
- ABB Ltd
- Eaton Corporation plc
- Siemens AG
- Hubbell Incorporated
- Phoenix Contact GmbH & Co. KG
- Mennekes Elektrotechnik GmbH & Co. KG
- Wieland Electric GmbH
- MARECHAL ELECTRIC S.A.S.
- Amphenol Corporation
- Emerson Electric Co.
- Bals Elektrotechnik GmbH & Co. KG
- Leviton Manufacturing Company, Inc.
- Palazzoli Group
- Cavotec Group AB
- Lewden Ltd.
- IDE Electric, SL
- KEDU Electric Company Limited
- Scame Group
- C&S Electric
- R. STAHL AG
- F. Walther Electric Corporation
- R&S International Holding AG
- Sunrise Plug Electric Co., Ltd.
- Legrand SA
- Appendix
- Research Methodology
- Research Assumptions
- Acronyms and Abbreviations

Loading page data
Please wait a moment


