

- Executive Summary
- Global Fruit Pulp Market Snapshot, 2026 and 2033
- Market Opportunity Assessment, 2026 - 2033, US$ Mn
- Key Market Trends
- Future Market Projections
- Premium Market Insights
- Industry Developments and Key Market Events
- PMR Analysis and Recommendations
- Market Overview
- Market Scope and Definition
- Market Dynamics
- Drivers
- Restraints
- Opportunity
- Key Trends
- Macro-economic Factors
- Global Sectoral Outlook
- Global GDP Growth Outlook
- COVID-19 Impact Analysis
- Forecast Factors - Relevance and Impact
- Value Added Insights
- Tool Adoption Analysis
- Regulatory Landscape
- Value Chain Analysis
- PESTLE Analysis
- Porter’s Five Force Analysis
- Price Analysis, 2025A
- Key Highlights
- Key Factors Impacting Deployment Costs
- Pricing Analysis, By Distribution
- Global Fruit Pulp Market Outlook
- Key Highlights
- Market Volume (Units) Projections
- Market Size (US$ Mn) and Y-o-Y Growth
- Absolute $ Opportunity
- Market Size (US$ Mn) and Volume (Units) Analysis and Forecast
- Historical Market Size (US$ Mn) Analysis, 2020-2025
- Market Size (US$ Mn) Analysis and Forecast, 2026 - 2033
- Global Fruit Pulp Market Outlook: Fruit Type
- Introduction / Key Findings
- Historical Market Size (US$ Mn) and Volume (Units) Analysis, By Fruit Type, 2020 - 2025
- Market Size (US$ Mn) and Volume (Units) Analysis and Forecast, By Fruit Type, 2026 - 2033
- Mango
- Apple
- Guava
- Banana
- Pineapple
- Strawberry
- Papaya
- Tomato
- Others
- Market Attractiveness Analysis: Fruit Type
- Global Fruit Pulp Market Outlook: Distribution
- Introduction / Key Findings
- Historical Market Size (US$ Mn) Analysis, By Distribution, 2020 - 2025
- Market Size (US$ Mn) Analysis and Forecast, By Distribution, 2026 - 2033
- E-Commerce
- Convenience Stores
- Supermarkets/Hypermarkets
- Specialty Stores
- Others
- Market Attractiveness Analysis: Distribution
- Global Fruit Pulp Market Outlook: Application
- Introduction / Key Findings
- Historical Market Size (US$ Mn) Analysis, By Application, 2020 - 2025
- Market Size (US$ Mn) Analysis and Forecast, By Application, 2026 - 2033
- Food
- Beverages
- Market Attractiveness Analysis: Application
- Key Highlights
- Global Fruit Pulp Market Outlook: Region
- Key Highlights
- Historical Market Size (US$ Mn) and Volume (Units) Analysis, By Region, 2020 - 2025
- Market Size (US$ Mn) and Volume (Units) Analysis and Forecast, By Region, 2026 - 2033
- North America
- Europe
- East Asia
- South Asia and Oceania
- Latin America
- Middle East & Africa
- Market Attractiveness Analysis: Region
- North America Fruit Pulp Market Outlook
- Key Highlights
- Historical Market Size (US$ Mn) Analysis, By Market, 2020 - 2025
- By Country
- By Fruit Type
- By Distribution
- By Application
- Market Size (US$ Mn) Analysis and Forecast, By Country, 2026 - 2033
- U.S.
- Canada
- Market Size (US$ Mn) and Volume (Units) Analysis and Forecast, By Fruit Type, 2026 - 2033
- Mango
- Apple
- Guava
- Banana
- Pineapple
- Strawberry
- Papaya
- Tomato
- Others
- Market Size (US$ Mn) Analysis and Forecast, By Distribution, 2026 - 2033
- E-Commerce
- Convenience Stores
- Supermarkets/Hypermarkets
- Specialty Stores
- Others
- Market Size (US$ Mn) Analysis and Forecast, By Application, 2026 - 2033
- Food
- Beverages
- Market Attractiveness Analysis
- Europe Fruit Pulp Market Outlook
- Key Highlights
- Historical Market Size (US$ Mn) Analysis, By Market, 2020 - 2025
- By Country
- By Fruit Type
- By Distribution
- By Application
- Market Size (US$ Mn) Analysis and Forecast, By Country, 2026 - 2033
- Germany
- France
- U.K.
- Italy
- Spain
- Russia
- Türkiye
- Rest of Europe
- Market Size (US$ Mn) and Volume (Units) Analysis and Forecast, By Fruit Type, 2026 - 2033
- Mango
- Apple
- Guava
- Banana
- Pineapple
- Strawberry
- Papaya
- Tomato
- Others
- Market Size (US$ Mn) Analysis and Forecast, By Distribution, 2026 - 2033
- E-Commerce
- Convenience Stores
- Supermarkets/Hypermarkets
- Specialty Stores
- Others
- Market Size (US$ Mn) Analysis and Forecast, By Application, 2026 - 2033
- Food
- Beverages
- Market Attractiveness Analysis
- East Asia Fruit Pulp Market Outlook
- Key Highlights
- Historical Market Size (US$ Mn) Analysis, By Market, 2020 - 2025
- By Country
- By Fruit Type
- By Distribution
- By Application
- Market Size (US$ Mn) Analysis and Forecast, By Country, 2026 - 2033
- China
- Japan
- South Korea
- Market Size (US$ Mn) and Volume (Units) Analysis and Forecast, By Fruit Type, 2026 - 2033
- Mango
- Apple
- Guava
- Banana
- Pineapple
- Strawberry
- Papaya
- Tomato
- Others
- Market Size (US$ Mn) Analysis and Forecast, By Distribution, 2026 - 2033
- E-Commerce
- Convenience Stores
- Supermarkets/Hypermarkets
- Specialty Stores
- Others
- Market Size (US$ Mn) Analysis and Forecast, By Application, 2026 - 2033
- Food
- Beverages
- Market Attractiveness Analysis
- South Asia & Oceania Fruit Pulp Market Outlook
- Key Highlights
- Historical Market Size (US$ Mn) Analysis, By Market, 2020 - 2025
- By Country
- By Fruit Type
- By Distribution
- By Application
- Market Size (US$ Mn) Analysis and Forecast, By Country, 2026 - 2033
- India
- Southeast Asia
- ANZ
- Rest of South Asia & Oceania
- Market Size (US$ Mn) and Volume (Units) Analysis and Forecast, By Fruit Type, 2026 - 2033
- Mango
- Apple
- Guava
- Banana
- Pineapple
- Strawberry
- Papaya
- Tomato
- Others
- Market Size (US$ Mn) Analysis and Forecast, By Distribution, 2026 - 2033
- E-Commerce
- Convenience Stores
- Supermarkets/Hypermarkets
- Specialty Stores
- Others
- Market Size (US$ Mn) Analysis and Forecast, By Application, 2026 - 2033
- Food
- Beverages
- Market Attractiveness Analysis
- Latin America Fruit Pulp Market Outlook
- Key Highlights
- Historical Market Size (US$ Mn) Analysis, By Market, 2020 - 2025
- By Country
- By Fruit Type
- By Distribution
- By Application
- Market Size (US$ Mn) Analysis and Forecast, By Country, 2026 - 2033
- Brazil
- Mexico
- Rest of Latin America
- Market Size (US$ Mn) and Volume (Units) Analysis and Forecast, By Fruit Type, 2026 - 2033
- Mango
- Apple
- Guava
- Banana
- Pineapple
- Strawberry
- Papaya
- Tomato
- Others
- Market Size (US$ Mn) Analysis and Forecast, By Distribution, 2026 - 2033
- E-Commerce
- Convenience Stores
- Supermarkets/Hypermarkets
- Specialty Stores
- Others
- Market Size (US$ Mn) Analysis and Forecast, By Application, 2026 - 2033
- Food
- Beverages
- Market Attractiveness Analysis
- Middle East & Africa Fruit Pulp Market Outlook
- Key Highlights
- Historical Market Size (US$ Mn) Analysis, By Market, 2020 - 2025
- By Country
- By Fruit Type
- By Distribution
- By Application
- By Application
- Market Size (US$ Mn) Analysis and Forecast, By Country, 2026 - 2033
- GCC Countries
- Egypt
- South Africa
- Northern Africa
- Rest of Middle East & Africa
- Market Size (US$ Mn) and Volume (Units) Analysis and Forecast, By Fruit Type, 2026 - 2033
- Mango
- Apple
- Guava
- Banana
- Pineapple
- Strawberry
- Papaya
- Tomato
- Others
- Market Size (US$ Mn) Analysis and Forecast, By Distribution, 2026 - 2033
- E-Commerce
- Convenience Stores
- Supermarkets/Hypermarkets
- Specialty Stores
- Others
- Market Size (US$ Mn) Analysis and Forecast, By Application, 2026 - 2033
- Food
- Beverages
- Market Attractiveness Analysis
- Competition Landscape
- Market Share Analysis, 2025
- Market Structure
- Competition Intensity Mapping By Market
- Competition Dashboard
- Company Profiles (Details - Overview, Financials, Strategy, Recent Developments)
- Iprona AG
- Overview
- Segments and Deployments
- Key Financials
- Market Developments
- Market Strategy
- Agrana Group
- Paradise Juice Private Limited
- Keventer Group
- Doehler Group
- Tropicana
- Shimla Hills
- Conagra Brands Inc.
- Trop Juice
- Pursuit Industries Private Limited
- Tropifruit
- Iprona AG
- Appendix
- Research Methodology
- Research Assumptions
- Acronyms and Abbreviations


- Food Ingredients & Additives
- Fruit Pulp Market
Fruit Pulp Market Size, Share, and Growth Forecast 2026 - 2033
Fruit Pulp Market by Fruit Type (Mango, Apple, Guava, Banana, Pineapple, Strawberry, Papaya, Tomato, Others), Distribution Channel, Application, and Regional Analysis, 2026 - 2033
Fruit Pulp Market Size and Trend Analysis
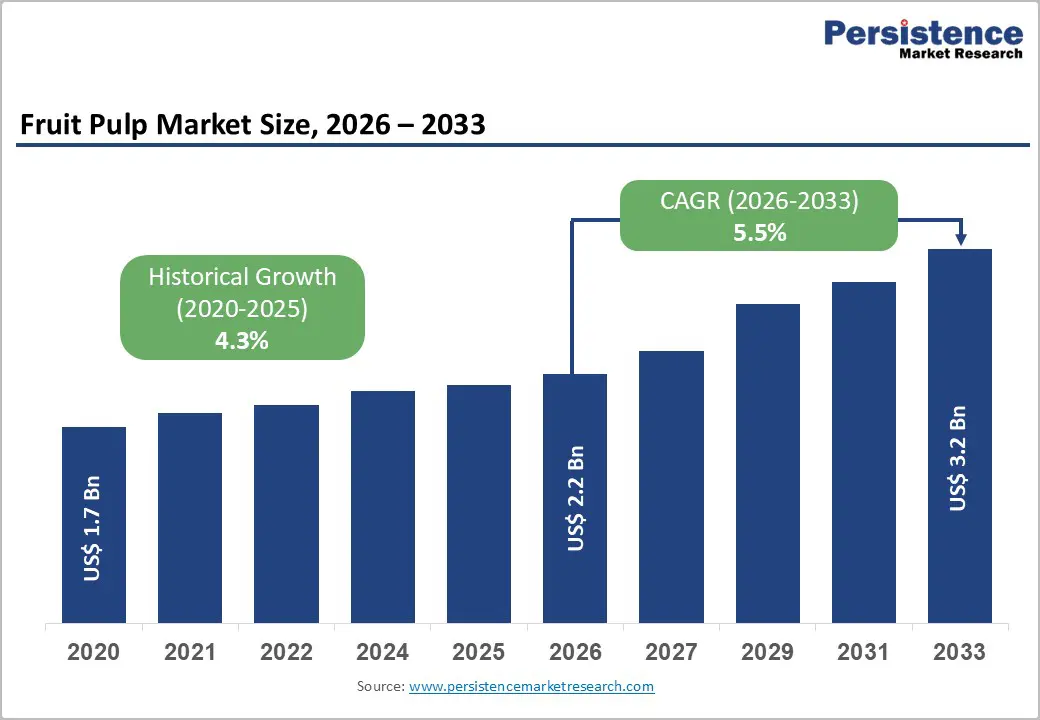
The global fruit pulp market size is expected to be valued at US$ 2.2 billion in 2026 and projected to reach US$ 3.2 billion by 2033, growing at a CAGR of 5.5% between 2026 and 2033. Fruit pulp is a crushed, strained, and blended food product. It is a highly versatile ingredient used across food and beverage applications, such as smoothies, sauces, jams, and desserts. Fruit pulp preserves the natural flavor, color, and nutritional value of fruits, offering a convenient, ready-to-use form that caters to the growing consumer demand for wholesome, minimally processed food and beverage options. The fruit pulp market growth is driven by the growing demand for natural ingredients and exotic fruit flavors, rising health consciousness, and innovation in food and beverage applications.
As health and wellness trends gain momentum worldwide, fruit pulp has become a favored ingredient across a wide range of applications, particularly in beverages, desserts, and packaged foods. The expansion of the beverage industry, especially in the ready-to-drink and smoothie segments, continues to drive demand for high-quality fruit pulp over artificial concentrates. Further, the growing shift toward organic and sustainably sourced pulp is prompting manufacturers to invest in advanced processing technologies and transparent supply chains. These factors are expected to shape a dynamic and innovation-driven market outlook over the forecast period.
Key Industry Highlights:
- The food segment is anticipated to remain a top contributor, accounting for a 47.6% share in the application category.
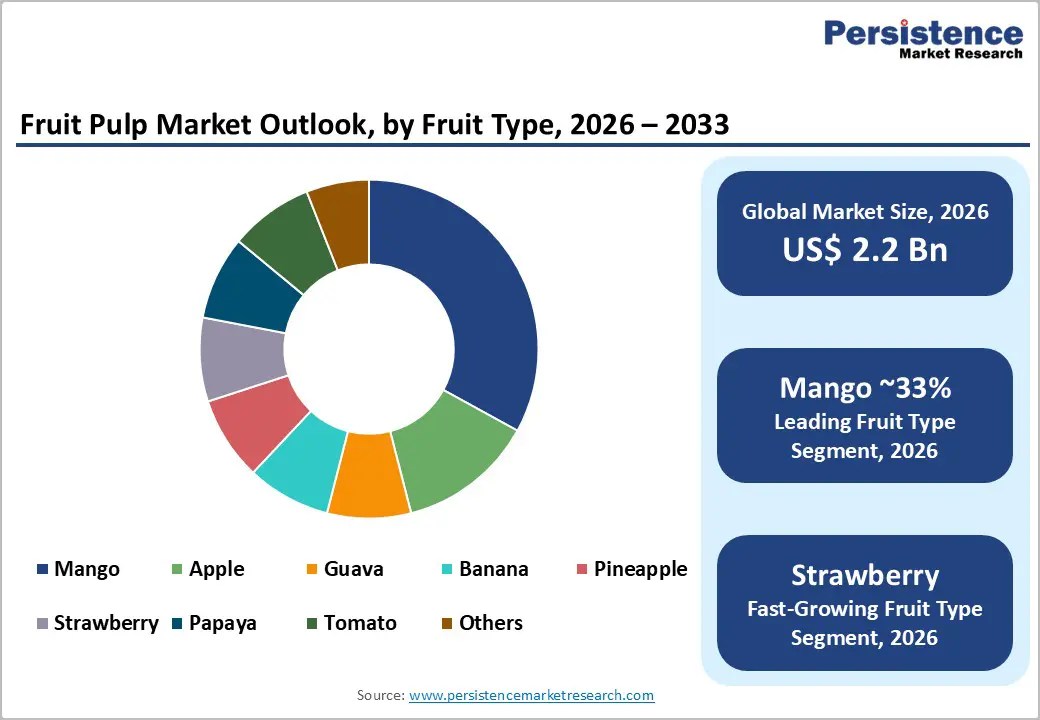
- Mango pulp is anticipated to dominate, accounting for a market share of 33%, owing to its extensive use in juices, dairy products, and desserts.
- Rising consumer preference for natural, minimally processed foods is increasing the demand for fruit pulp as a clean-label ingredient.
- With a surge in the consumption of ready-to-drink beverages, fruit pulp has emerged as a core ingredient in the beverage industry.
- A growing preference for organic fruit pulps is prompting companies to develop or adopt advanced processing technologies, implement transparent sourcing policies, and obtain eco-certifications.
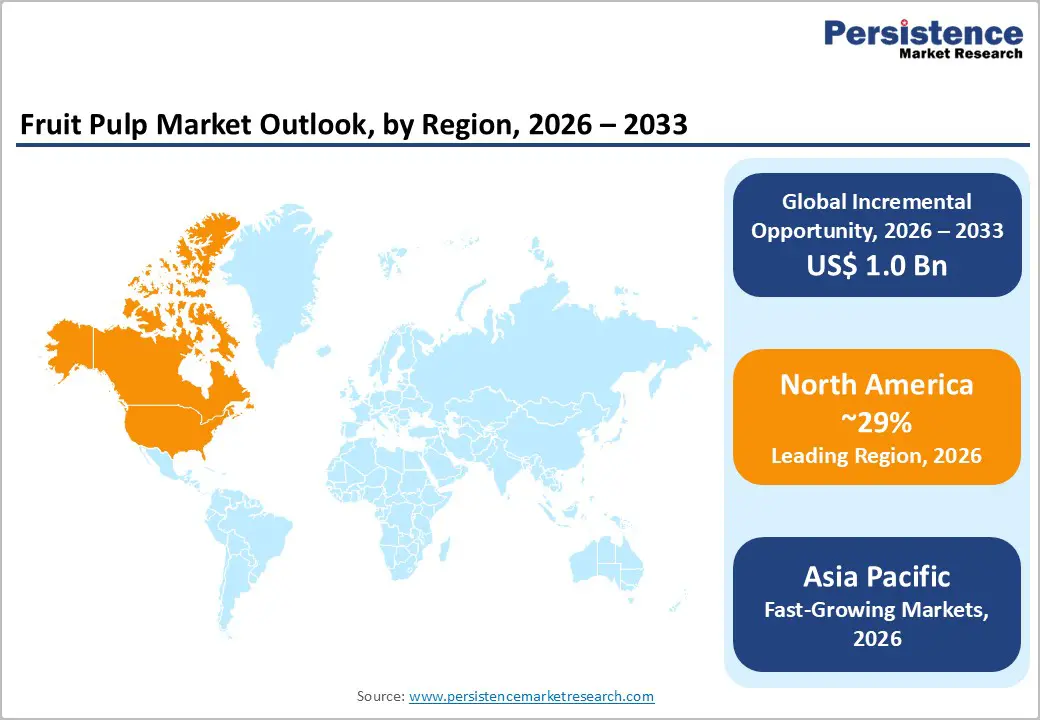
- North America is projected to hold 26.1% of the market share during the forecast period, owing to consumer interest in plant-based diets and natural food alternatives.
- Asia Pacific is the fastest-growing market due to cost-effective production and fruit availability.
- The market is expanding across e-commerce, supermarkets/hypermarkets, and specialty stores, with increasing emphasis on cold-chain infrastructure and shelf-life solutions.
| Key Insights | Details |
|---|---|
|
Fruit Pulp Market Size (2026E) |
US$ 2.2 billion |
|
Market Value Forecast (2033F) |
US$ 3.2 billion |
|
Projected Growth CAGR (2026–2033) |
5.5% |
|
Historical Market Growth (2020–2025) |
4.3% |
Market Dynamics
Drivers - Shift Toward Natural, Clean-Label Fruit Ingredients
A crucial driver for the fruit pulp market is the global shift toward natural, clean-label ingredients as consumers reassess their intake of artificial flavors, colors, and high-sugar concentrates. The Food and Agriculture Organization (FAO) notes that global production of tropical fruits has grown steadily over the last decade, driven by rising demand in both producing and importing regions, and by their status as one of the most valuable fruit groups in world trade. Fruit pulp, which retains the original flavor, color, and much of the fruit's fiber, fits neatly into this trend, allowing manufacturers to formulate juices, smoothies, yogurts, desserts, and baby foods with recognizable fruit content rather than synthetic additives. As consumers increasingly associate fruit-based products with wellness and authenticity, pulp-based formulations gain preference over reconstituted juices and artificial flavor systems, stimulating incremental demand in both developed and emerging markets.
Diversification of Processed Food and Beverage Applications
The diversification of processed food and beverage portfolios is another powerful growth engine for fruit pulp. Global fruit production surpassed 900 million metric tons in recent years, with bananas alone accounting for around 139 million metric tons, providing a broad raw-material base for value-added processing into pulps, purees, and concentrates. Food and beverage manufacturers are leveraging this supply to launch an expanding range of fruit pulp-based products, from shelf-stable nectars and ambient juices to premium ice creams, bakery fillings, fruit bars, and nutraceutical beverages. As urban consumers seek convenient yet nutritious options, fruit pulp offers a versatile way to deliver flavor, texture, and perceived health benefits in on-the-go formats. Combined with rising investments in cold chain and aseptic processing, this diversification supports robust growth in industrial pulp usage across multiple end-use sectors.
Restraints - Perishability, Supply Volatility, and Cold-Chain Dependence
One key restraint for the fruit pulp market is the inherent perishability and seasonality of many fruits. FAO and trade-focused analyses highlight that exports of major tropical fruits such as mango and pineapple fell by about 5% in 2022, partly due to adverse weather in leading producer countries and higher input and transport costs. These supply disruptions can lead to raw-material shortages, volatile prices, and margin pressure for processors that depend on steady pulp output. Maintaining quality also requires reliable cold-chain or aseptic infrastructure, which can be capital-intensive and less available in low-income producing regions, constraining year-round availability and raising operating costs.
Opportunities - Growth in Organic and Sustainable Products to Broaden Market Horizon
The increasing demand for organic and sustainably sourced food products presents a major opportunity for innovation in the fruit pulp market. As consumers become more environmentally conscious and demand greater transparency in food sourcing and production, brands that offer certified organic or ethically harvested pulp are gaining a veritable competitive edge. This opens doors for producers to invest in cleaner processing technologies, biodegradable packaging, and to collaborate with local farmers through fair-trade partnerships. By aligning with eco-conscious consumer values, companies can command premium pricing and build long-term brand loyalty for their products. Additionally, regulatory support for organic labeling and sustainability reporting in many regions further drives the growth of the fruit pulp market.
Category-wise Analysis
Fruit Type Insights
Based on fruit type, the fruit pulp market has been segmented into mango, apple, guava, banana, pineapple, strawberry, papaya, tomato, and others. Mango pulp dominates this category, accounting for 33% market share during the forecast period, driven by its extensive use in juices, dairy products, and desserts. Moreover, its massive popularity and strong demand in both domestic and export markets, especially in South Asia and the Middle East, make it a high-value segment.
Strawberry and apple pulp follow closely, having wide applications in ice creams, bakery fillings, smoothies, and baby food. One key driving factor for this segment is the year-round availability of strawberries and apples in temperate regions, which contributes to the steady production of these pulps.
Application Insights
By application, this market has been bifurcated into food and beverages. The food segment is anticipated to lead with a 47% share in 2026, driven by its versatility and functional appeal across a broad range of culinary applications. Fruit pulp is widely used in the production of a variety of foods, including jams, jellies, bakery fillings, and frozen desserts. Its ability to impart natural sweetness and real fruit flavor makes it a highly preferred ingredient among food companies aiming to meet clean-label and health-conscious consumer expectations.
On the other hand, the beverage segment is the fastest-growing over the forecast period, fueled by consumers’ shift toward natural, functional, and clean-label drinks. Another contributing factor is the rise in the demand for on-the-go beverages and premium juice blends, particularly in urban markets. Additionally, innovations in cold-pressed and artisanal drinks are also generating new opportunities for pulp-based formulations.
Regional Insights
North America Fruit Pulp Market Trends and Insights
North America is projected to lead the fruit pulp market during the forecast period, accounting for approximately 29% of the total market share. This leadership is supported by a highly developed food and beverage industry, strong distribution networks, and advanced cold-chain infrastructure that ensures product quality and shelf stability. The region has a well-established processing ecosystem, enabling large-scale utilization of fruit pulp in juices, smoothies, dairy products, desserts, and bakery applications. Additionally, the presence of major food manufacturers and ingredient suppliers accelerates product innovation and market penetration.
A key trend shaping the regional market is the increasing consumer preference for natural, clean-label, and minimally processed ingredients. Health-conscious consumers are actively seeking products free from artificial additives, which has significantly boosted demand for fruit pulp as a natural flavoring and nutritional component. Furthermore, the growing popularity of organic and sustainably sourced food products is encouraging manufacturers to adopt certified organic pulp sourcing practices. Rising demand for functional beverages and plant-based formulations is also contributing to sustained growth across North America.
Europe Fruit Pulp Market Trends and Insights
In Europe, demand for fruit pulp is underpinned by strong traditions in juice, nectars, jams, bakery products, and dairy desserts, as well as by region-wide efforts to promote fruit and vegetable consumption. Many European Union (EU) member states encourage higher fruit intake as part of noncommunicable disease prevention strategies, and manufacturers respond with a wide range of fruit-pulp-based foods and drinks tailored to local tastes in Germany, the U.K., France, and Spain. European consumers often favor premium quality, traceability, and clear origin labeling, which supports demand for both locally sourced and imported pulps, particularly from tropical fruits such as mango, pineapple, and passion fruit.
At the same time, the region faces challenges similar to those in North America in balancing sugar-reduction goals with consumer expectations for sweetness and indulgence. This environment accelerates innovation in low-sugar, high-fruit-content beverages, yogurts, and bakery items that leverage pulp’s fiber and natural flavor to reduce reliance on added sugars. Harmonized EU rules on food labeling and health claims, along with retailer-led sustainability initiatives, encourage producers and importers to focus on responsibly sourced, minimally processed fruit pulps that can meet both regulatory and consumer expectations across key European markets.
Asia Pacific Fruit Pulp Market Trends and Insights
Asia Pacific is emerging as the fastest-growing region in the fruit pulp market, driven by favorable climatic conditions and abundant availability of tropical fruits. The region’s warm climate supports large-scale cultivation of fruits such as mango, guava, banana, and papaya, making it a global hub for fruit pulp production. Countries like India, Thailand, and the Philippines play a crucial role as major producers and exporters, benefiting from cost-effective production and strong agricultural output. This supply advantage positions the region as a key contributor to both domestic consumption and international trade.
Rapid urbanization and changing dietary habits are further accelerating demand for fruit pulp across the Asia Pacific. Consumers are increasingly shifting toward packaged, convenient, and health-oriented food and beverage products, where fruit pulp is widely used as a natural ingredient. In addition, rising disposable incomes and growing awareness of nutrition are encouraging higher consumption of fruit-based products. Government initiatives supporting food processing industries, along with investments in infrastructure and export promotion, are strengthening the region’s growth outlook and expanding its global market presence.
Competitive Landscape
The global fruit pulp market is characterized by intense competition among key players striving to innovate and capture consumer interest. For instance, The Coca-Cola Company has launched several innovative products since 2022, including fruit pulp-infused beverages aimed at health-conscious consumers. Their focus on reducing added sugars while enhancing flavor profiles demonstrates a commitment to meeting evolving consumer preferences.
Nestlé introduced new fruit pulp-based snacks that cater to the growing demand for nutritious, on-the-go options. These innovations reflect a broader market trend toward healthier, more natural ingredients, positioning these companies favorably for future growth.
Key Developments:
- In April 2025, Koa partnered with Altinmarka to debut “Cacaonly”, a chocolate and ready-to-drink beverage line made using upcycled cocoa fruit pulp instead of added sugar. The launch highlights growing interest in sustainable, fruit-based sweeteners sourced from smallholder farms in Ghana.
- In June 2024, SHJUMP introduced a next-gen fruit pulp separator designed to efficiently process difficult fruits such as apricots and prunes. The equipment enhanced yield, maintained fruit quality, and offered adjustable settings to suit various pulp textures and applications.
Companies Covered in Fruit Pulp Market
- Iprona AG
- Agrana Group
- Paradise Juice Private Limited
- Harvesttime
- Keventer Group
- Doehler Group
- Tropicana
- Shimlahills
- Conagra Brands Inc
- Trop Juice
- Pursuit
- Tropifruit
- Others
Frequently Asked Questions
The global fruit pulp market is expected to reach around US$ 2.2 billion in 2026.
Key drivers include demand for clean-label ingredients, rising health awareness, expanding processed food applications, and increased tropical fruit production supporting pulp processing.
North America leads the fruit pulp market with around 29% share in 2026, driven by advanced processing, infrastructure, and strong demand.
The increasing demand for organic and sustainably sourced food products presents a major opportunity for innovation.
The key players in the global fruit pulp market include Iprona AG, Agrana Group, and Doehler Group.


