


- Power Generation, Transmission, & Distribution
- Fossil Fuels Market
Fossil Fuels Market Size, Growth, Share, Trends and Forecast, 2025 - 2032
Fossil Fuels Market by Source (Crude Oil, Natural Gas, Coal), Derivative (Gasoline, Diesel, Jet Fuel, Fuel Oil, LPG, LNG, CNG, Methanol, Others) End-user (Transportation, Electricity Generation, Residential Heating, Feedstock, Industrial Power Generation), and Regional Analysis for 2025 - 2032
Fossil Fuels Market Share and Trends Analysis
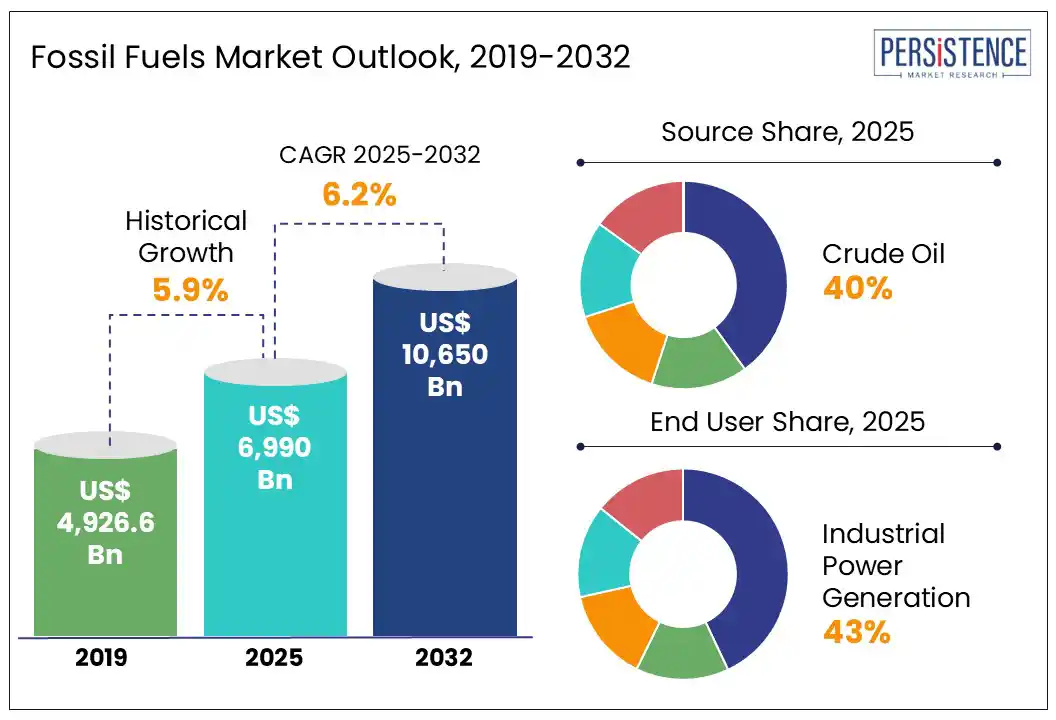
The global fossil fuels market size is likely to be valued at US$ 6,990 Bn in 2025 and is estimated to reach US$ 10,650 Bn in 2032, at a CAGR of 6.2% during the forecast period 2025 - 2032.
The fossil fuels market growth is driven by rising energy demand due to population growth and urbanization, especially in emerging countries.
Fossil fuels refer to non-renewable energy sources such as coal, coal products, natural gas, derived gas, crude oil, petroleum products, and non-renewable wastes. Fossil fuels are created over millions of years as buried remains of plants and animals are subjected to varying heat, pressure, and time, with the type formed depending on the specific conditions and materials involved. Fossil fuels can also be produced by industrial processes from other fossil fuels. Crude oil can be transformed into motor gasoline in the oil refinery. Fossil fuels have historically satisfied most of the human energy requirements. Fossil fuels are carbon-based and their combustion releases carbon dioxide into the Earth's atmosphere.
Key Industry Highlights
- Market growth is driven by rising energy demand due to population growth and urbanization, especially in emerging countries.
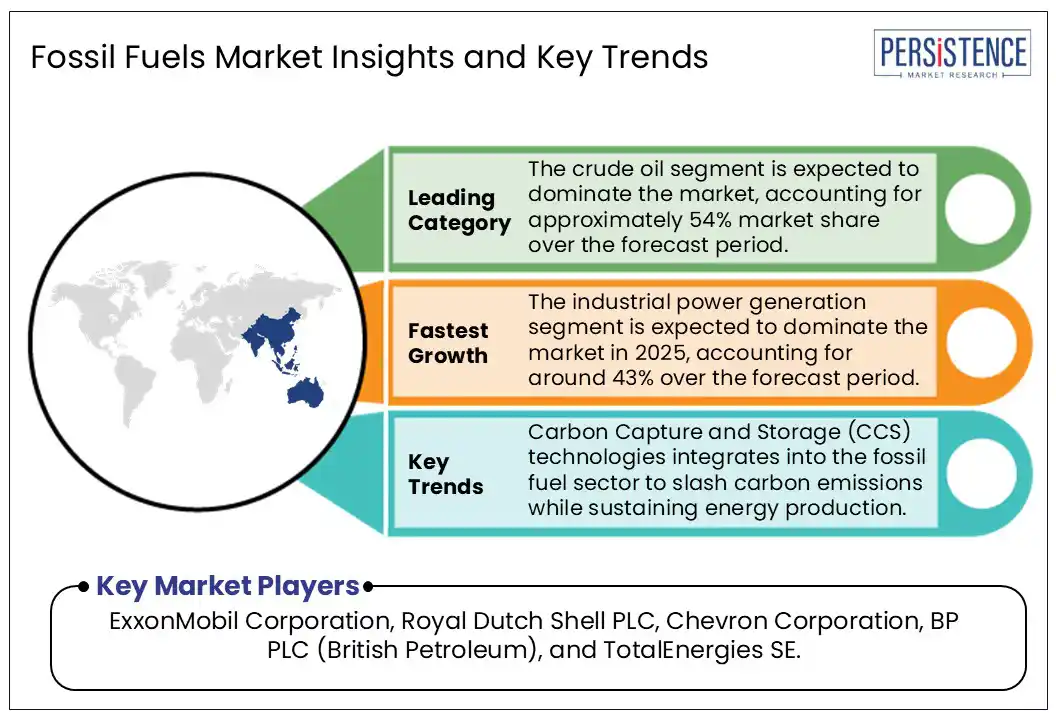
- The crude oil segment is expected to dominate the market, accounting for approximately 54% market share over the forecast period.
- The industrial segment is expected to dominate the market in 2025, accounting for around 43% over the forecast period.
- Asia Pacific is estimated to dominate the market in 2025, accounting for a market share of approximately 42% over the forecast period.
- Carbon Capture and Storage (CCS) technologies are increasingly integrated into the fossil fuel sector, offering a strategic avenue for reducing carbon emissions while sustaining energy production.
|
Global Market Attribute |
Key Insights |
|
Fossil Fuels Market Size (2025E) |
US$ 6,990 Bn |
|
Market Value Forecast (2032F) |
US$ 10,650 Bn |
|
Projected Growth (CAGR 2025 to 2032) |
6.2% |
|
Historical Market Growth (CAGR 2019 to 2024) |
5.9% |
Market Dynamics
Driver - Increasing energy demand and the expanding transport sector
According to the International Energy Agency World Energy Outlook 2022, fossil fuels accounted for approximately 84% of global primary energy consumption. Oil was the largest contributor at 33%, followed by coal at 27%. Renewable energy adoption remained slow and capital-intensive, especially in the emerging markets that lack domestic energy reserves, making it difficult to install solar, wind, geothermal, and hydro projects. Though renewable energy sources are becoming popular, they only account for a small fraction of global energy consumption. The cost of producing renewable energy remains relatively high compared to fossil fuels, and some nations possess larger reserves of fossil fuels than others.
Global energy demand grew at a faster pace in 2024, driven by the rise in global electricity consumption. An increased supply of renewables and natural gas covered most of the energy needs. Emerging and developing economies accounted for over 80% of the increase in global energy demand in 2024. This acceleration was led by the power sector, with electricity consumption reaching 1,100 TWh, driven by record-high global temperatures. which boosted the demand for industrial electrification, data center expansion, EV charging demand, and increased use of air conditioners in hot climates.
Restraints - Increasing greenhouse emissions by fossil fuels
There is growing political and social pressure to phase out fossil fuels to combat climate change. The declining cost along with increasing competitiveness of renewable energy technologies, such as solar and wind power, is another trigger. The combustion of fossil fuels is a leading contributor to greenhouse gas emissions, driving global warming and climate change. According to the Intergovernmental Panel on Climate Change (IPCC), global CO? emissions must decline by 45% by 2030 and reach net-zero by mid-century to limit warming to 1.5°C above pre-industrial levels. This calls for a dramatic reduction in global fossil fuel consumption in the coming decades and increasing use of sustainable energy sources, particularly solar and wind power, which can significantly reduce CO emissions.
According to the International Renewable Energy Agency (IRENA, 2023), the cost of utility-scale solar photovoltaics and wind power has fallen steadily over the past decade. This cost competitiveness and growing investments in R&D efforts in renewable energy are leading to the deployment of scalable clean energy technologies. Public awareness of climate change, environmental degradation, and air pollution is driving governments, businesses, and civil society organizations to set ambitious climate targets. The EU aims to reduce greenhouse gas emissions by at least 55% by 2030. To survive in long term, the fossil fuel industry must invest in low-carbon technologies, aligning with global climate objectives.
Opportunities - Innovations in Carbon Capture and Storage (CCS)
Carbon Capture and Storage (CCS) involves capturing CO? emissions from various sources, such as fossil fuel power plants and industrial processes, and storing them underground, to prevent their release into the atmosphere and mitigate climate change. This technology is particularly valuable as it enables significant emission reductions without hindering economic development. According to the IEA, CCS could contribute up to 14-19% of the cumulative CO emissions reductions needed to limit global warming to 2°C by 2050. Although wide-scale deployment remains limited, recent advancements have demonstrated its feasibility. The Petra Nova project in Texas, the world’s largest post-combustion carbon capture facility, captures approximately 1.6 million tons of CO per year.
High implementation and operational costs of CCS can be barriers for many companies. Public concerns over underground storage safety can also hinder progress. R&D efforts will help in tackling these issues. Despite these hurdles, global investment and project pipelines are accelerating; approximately 628 CCUS projects were under development in 2024 aiming to capture 430?Mt CO? annually by 2030. Countries including Norway, the U.K., and the U.S. are initiating large-scale flagship projects. In June 2025, Norway launched a flagship CCS project, to curb climate change and find a viable economic model.
Category Wise Analysis
Source Insights
By source, the crude oil segment is expected to dominate the market, accounting for approximately 54% market share over the forecast period. Crude oil, a naturally-occurring, unrefined liquid petroleum found in underground reservoirs, is refined into gasoline, diesel, and petrochemicals. About 48% of the global crude oil reserves are located in the Middle East and others in North America, Africa, Central & South America, Asia & Oceania, and Europe. Geopolitical tensions, such as recent escalations between the U.S. and Iran, have amplified concerns over potential disruptions in the Strait of Hormuz. Analysts warn that any significant disruption could lead to oil prices surging above US$ 100 per barrel. Global oil demand is expected to rise by about 1 million bpd in 2025, a significant slowdown compared to previous years. This slump is attributed to rapid deployment of EVs and changes in transportation and industrial energy usage.
The natural gas segment is expected to experience the fastest growth over the forecast period, as it is a cleaner fuel compared to coal and oil. Growing demand for power generation and residential heating, specifically in colder regions, is driving its adoption. Growth is further supported by industrial applications and the expanding liquefied natural gas (LNG) market. Natural gas, a fossil fuel formed deep underground, primarily consists of methane (CH?). Geopolitical tensions, such as the halt of Russian piped gas transit via Ukraine, have fueled price volatility. The deployment of low-emission gases is expected to more than double by 2027, supported by favorable policies in Europe and North America. Emerging producers in countries including Brazil, China, and India are also scaling up their natural gas output to meet decarbonization goals.
End-use Insights
By end-use, the industrial power generation is expected to dominate the market in 2025 and is poised to reach 43% of the market share over the forecast period. The industrial sector remains one of the largest consumers of energy, relying on both fossil fuels and renewable sources for process heating, electricity generation, and as raw materials. While most facilities purchase electricity from utilities or independent producers, many also generate electricity onsite using natural gas and coal. According to the Annual Energy Outlook 2023, in 2022, the U.S. manufacturing accounted for 76% of total industrial energy consumption, followed by mining (12%), construction (7%), and agriculture (4%).
The transportation segment is anticipated to be the fastest-growing within this market. According to a Stanford University study, the transportation sector is a major consumer of fossil fuels, accounting for over 90% of the sector’s energy use globally, primarily from oil. It is responsible for nearly two-thirds of global oil consumption. Within transportation, trucks and buses rely on fossil fuels for 96% of their energy, mainly diesel (81%), followed by gasoline (11%) and natural gas (3%). Aviation and shipping are nearly 100% dependent on fossil fuels, using jet kerosene and marine fuels like heavy fuel oil (HFO), marine gas oil (MGO), and marine diesel oil (MDO. This dependency is changing with the Decarbonizing Transport initiative, which is promoting carbon-neutral mobility to help stop climate change.
Regional Insights
Asia Pacific Fossil Fuels Market Trends
Asia Pacific is estimated to dominate the market, accounting for a market share of approximately 42% over the forecast period, driven by coal production and use, especially in China and India. Natural gas and LNG are rapidly growing as transition fuels, with Asia Pacific accounting for about 80% of global LNG imports. The future of the energy sector in Asia Pacific is dependent on gradual phase-down of coal, the expansion of LNG infrastructure, a stronger shift toward renewable energy sources. Global fossil fuel consumption and greenhouse gas emissions reached a record high, despite renewables generating more energy than before. Fossil fuel use grew by 1.5% compared to 2022. India’s coal consumption surpassed that of Europe and North America combined for the first time.
China remains the world’s largest coal consumer, still relying on coal for more than half its electricity generation. In 2024, China maintained its position as the world's largest oil importer, but began reducing imports of lower-grade Indonesian coal in favor of higher-calorific coal from Mongolia, South Africa, and Kazakhstan. It also tops the crude oil production reaching a record 5.3 million barrels per day (bpd), the fifth-highest globally. Despite this, the country's oil demand has plateaued due to a significant shift toward EVs, which now constitute nearly half of all vehicle sales.
North America Fossil Fuels Market Trends
North America is likely to witness the fastest growth over the forecast period, driven by production trends, policy changes, and global demand dynamics. Natural gas demand has recovered, especially in power generation, while LNG exports from North America are surging. Despite the Inflation Reduction Act’s incentives for clean energy, policy moves under the Trump administration since taking office in 2025 have favored fossil fuel expansion. Investments in oil & gas are declining due to the rising costs and regulatory uncertainties, with capital expenditures expected to decline by 4% in 2025. High natural gas prices are also encouraging some regions to return to coal, suggesting a short-term increase in coal demand.
The U.S. fossil fuel market remains strong with record-high crude oil and natural gas production projected for the year. Fossil fuels still supply over 80% of the nation’s energy, led by natural gas while coal demand is declining. A surge in LNG exports and deregulation under the current administration have bolstered the industry, alongside increased financing from global banks. In January 2025, the U.S. Department of Energy announced the reactivation of LNG permit processing, effectively reversing the previous moratorium implemented in early 2024, thereby boosting domestic production and expanding the U.S. role in global energy markets.
Europe Fossil Fuels Market Trends
The fossil fuel market in Europe is experiencing a significant decline. Ember, a clean energy think tank, recently reported that fossil fuel generation fell by 14.8 TWh compared to April 2023, reaching 46 TWh, leading to a record-low level of power sector CO? emissions for the month. In 2024, fossil fuels accounted for just 28% of the EU's electricity generation, down from 39% in 2022. Renewable energy sources, particularly wind and solar, have seen substantial growth, with their combined share reaching 30% in the first half of 2024. This trend is supported by the EU's REPowerEU plan to reduce reliance on Russian fossil fuels and accelerate the transition to renewable energy. Countries including Denmark and Germany led in wind power, and Spain in solar adoption.
In Europe, Kosovo and Macedonia have experienced the highest growth in fossil fuel consumption owing to economic development, industrialization, and energy infrastructure expansion. This contrasts with the broader European shift toward reducing fossil fuel reliance. Countries including Germany, France, and Poland have seen declines in fossil fuel consumption, with Poland's coal use dropping by 17% in 2024.
Competitive Landscape
The global fossil fuels market is highly competitive with global and domestic players offering a wide range of products and competing for a higher market share. Companies are investing in R&D and adopting growth strategies such as product innovations, strategic partnerships, and acquisitions.
Key Industry Developments
- In June 2025, the Shell-led consortium-including Petronas, PetroChina, Mitsubishi, and Kogas-produced its first LNG at the LNG Canada terminal in Kitimat, British Columbia.
- In January 2025, Engine No. 1, the hedge fund known for pressuring ExxonMobil on climate action, announced a surprising partnership with Chevron to develop new fossil fuel power plants in the U.S.
Companies Covered in Fossil Fuels Market
- ExxonMobil Corporation
- Royal Dutch Shell PLC
- Chevron Corporation
- BP PLC (British Petroleum)
- TotalEnergies SE
- Saudi Arabian Oil Company (Aramco)
- Gazprom
- ConocoPhillips
- China National Petroleum Corporation (CNPC)
- Rosneft
Frequently Asked Questions
The global market is projected to be valued at US$ 6,990 bn in 2025.
Rising global energy demand, fueled by rapid urbanization, industrialization, and transportation needs in emerging markets.
The market is poised to witness a CAGR of 6.2% from 2025 to 2032.
Carbon Capture and Storage (CCS) technology is increasingly integrated into the fossil fuel sector, offering a strategic avenue for reducing carbon emissions while sustaining energy production.
Major players in the global fossil fuels market include ExxonMobil Corporation, Royal Dutch Shell PLC, Chevron Corporation, BP PLC (British Petroleum), and TotalEnergies SE.


