Disc Cutter Market

Market Study on Disc Cutters: East Asia and North America to Remain Prime Markets

Disc Cutter Market by Cutting Capacity (Up to 100 Kg/Hr, 101 to 200 Kg/Hr, 201 to 300 Kg/Hr and Above 300 Kg/Hr)

- Table of Content -

1. Executive Summary

    1.1. Global Disc Cutter Market Outlook

    1.2. Demand Side Trends

    1.3. Supply Side Trends

    1.4. Technology Roadmap

    1.5. Analysis and Recommendations

2. Market Overview

    2.1. Market Coverage / Taxonomy

    2.2. Market Definition / Scope / Limitations

3. Key Market Trends

    3.1. Key Trends Impacting the Market

    3.2. Product Innovation / Development Trends

4. Key Success Factors

    4.1. Product Adoption / Usage Analysis

    4.2. Product USPs / Features

    4.3. Strategic Promotional Strategies

5. Global Disc Cutter Market Demand Analysis 2018–2022 and Forecast, 2023–2033

    5.1. Historical Market Volume (Units) Analysis, 2018–2022

    5.2. Current and Future Market Volume (Units) Projections, 2023–2033

    5.3. Y-o-Y Growth Trend Analysis

6. Global Disc Cutter Market - Pricing Analysis

    6.1. Regional Pricing Analysis

    6.2. Global Average Pricing Analysis Benchmark

7. Global Disc Cutter Market Demand (in Value or Size in US$ Mn) Analysis 2018–2022 and Forecast, 2023–2033

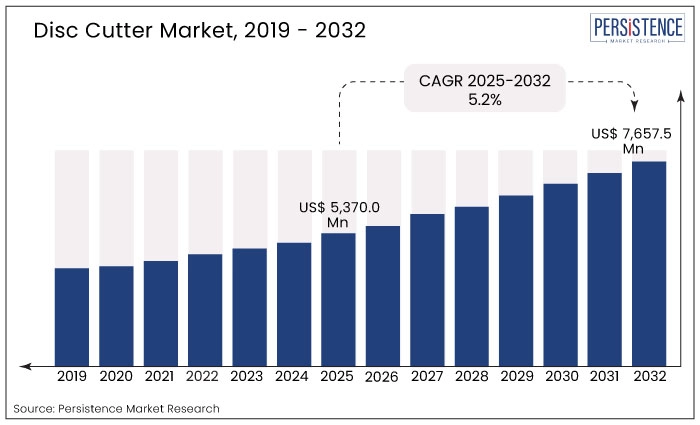
    7.1. Historical Market Value (US$ Mn) Analysis, 2018–2022

    7.2. Current and Future Market Value (US$ Mn) Projections, 2023–2033

        7.2.1. Y-o-Y Growth Trend Analysis

        7.2.2. Absolute $ Opportunity Analysis

8. Market Background

    8.1. Macro-Economic Factors

        8.1.1. Global GDP Overview

        8.1.2. Industry-Value-Added Overview

        8.1.3. Food and Beverages Industry Value Added Overview

        8.1.4. Global Population Outlook

        8.1.5. Global Urbanization Outlook

        8.1.6. Global Pork Production Overview

        8.1.7. Global Meat Production Overview

        8.1.8. Global Beef Meat Production Outlook

        8.1.9. Parent Market Analysis

    8.2. Forecast Factors - Relevance & Impact

        8.2.1. GDP Growth

        8.2.2. Urban Population Growth Outlook

        8.2.3. Increasing Production capacities

        8.2.4. Key Technology Development

        8.2.5. Meat Consumption Outlook

        8.2.6. New product Launches

    8.3. Value Chain

        8.3.1. Raw Material Suppliers

        8.3.2. Product Manufacturers

        8.3.3. List of Dealer/ Distributors

    8.4. COVID-19 Crisis – Impact Assessment

        8.4.1. Current Statistics

        8.4.2. Short-Mid-Long Term Outlook

        8.4.3. Likely Rebound

    8.5. Market Dynamics

        8.5.1. Drivers

        8.5.2. Restraints

        8.5.3. Opportunity Analysis

9. Global Disc Cutter Market Analysis 2018–2022 and Forecast 2023–2033, By Cutting Capacity

    9.1. Introduction / Key Findings

    9.2. Historical Market Size (US$ Mn) and Volume Analysis By Cutting Capacity, 2018–2022

    9.3. Current and Future Market Size (US$ Mn) and Volume Analysis and Forecast By Cutting Capacity, 2023–2033

        9.3.1. Upto 100 Kg/Hr

        9.3.2. 101 - 200 Kg/Hr

        9.3.3. 201-300 Kg/Hr

        9.3.4. Above 300 Kg/Hr

    9.4. Market Attractiveness Analysis By Cutting Capacity

10. Global Disc Cutter Market Analysis 2018–2022 and Forecast 2023–2033, By Product Type of Meat

    10.1. Introduction / Key Findings

    10.2. Historical Market Size (US$ Mn) and Volume Analysis By Product Type of Meat, 2018–2022

    10.3. Current and Future Market Size (US$ Mn) and Volume Analysis and Forecast By Product Type of Meat, 2023–2033

        10.3.1. Chicken

        10.3.2. Beef

        10.3.3. Pork

        10.3.4. Turkey

        10.3.5. Others

    10.4. Market Attractiveness Analysis By Product Type of Meat

11. Global Disc Cutter Market Analysis 2018–2022 and Forecast 2023–2033, By Operation Type

    11.1. Introduction / Key Findings

    11.2. Historical Market Size (US$ Mn) and Volume Analysis By Operation Type, 2018–2022

    11.3. Current and Future Market Size (US$ Mn) and Volume Analysis and Forecast By Operation Type, 2023–2033

        11.3.1. Semi-Automatic

        11.3.2. Automatic

    11.4. Market Attractiveness Analysis By Operation Type

12. Global Disc Cutter Market Analysis 2018–2022 and Forecast 2023–2033, by Cutter Diameter

    12.1. Introduction / Key Findings

    12.2. Historical Market Size (US$ Mn) and Volume Analysis By Cutter Diameter, 2018–2022

    12.3. Current and Future Market Size (US$ Mn) and Volume Analysis and Forecast By Cutter Diameter, 2023–2033

        12.3.1. Below 8 Inch

        12.3.2. 8 Inch and Above

    12.4. Market Attractiveness Analysis By Cutter Diameter

13. Global Disc Cutter Market Analysis 2018–2022 and Forecast 2023–2033, By Product Type

    13.1. Introduction / Key Findings

    13.2. Historical Market Size (US$ Mn) and Volume Analysis By Product Type, 2018–2022

    13.3. Current and Future Market Size (US$ Mn) and Volume Analysis and Forecast By Product Type 2023–2033

        13.3.1. Standalone Unit

        13.3.2. Disc Shaped Component

    13.4. Market Attractiveness Analysis By Product Type

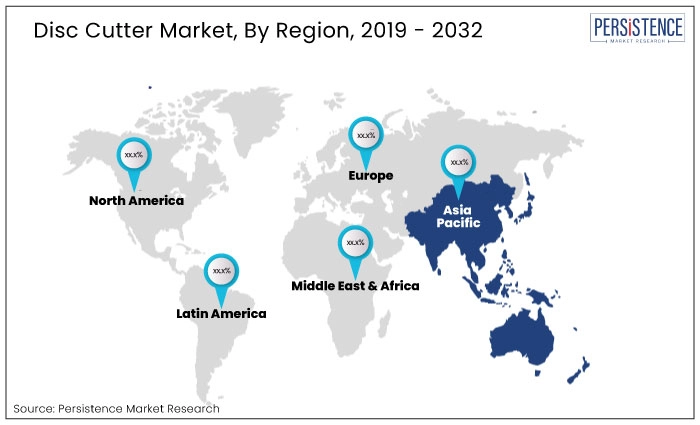
14. Global Disc Cutter Market Analysis 2018–2022 and Forecast 2023–2033, by Region

    14.1. Introduction

    14.2. Historical Market Size (US$ Mn) and Volume Analysis By Region, 2018–2022

    14.3. Current Market Size (US$ Mn) and Volume Analysis and Forecast By Region, 2023–2033

        14.3.1. North America

        14.3.2. Latin America

        14.3.3. Europe

        14.3.4. East Asia

        14.3.5. South Asia and Pacific

        14.3.6. Middle East and Africa

    14.4. Market Attractiveness Analysis By Region

15. North America Market Analysis 2018–2022 and Forecast 2023–2033

    15.1. Introduction

    15.2. Pricing Analysis

    15.3. Historical Market Size (US$ Mn) and Volume Trend Analysis By Market Taxonomy, 2018–2022

    15.4. Market Size (US$ Mn) and Volume Forecast By Market Taxonomy, 2023–2033

        15.4.1. By Country

            15.4.1.1. U.S.

            15.4.1.2. Canada

        15.4.2. By Cutting Capacity

        15.4.3. By Type of Meat

        15.4.4. Operation Type

        15.4.5. By Region

        15.4.6. By Product Type

    15.5. Market Attractiveness Analysis

        15.5.1. By Country

        15.5.2. By Cutting Capacity

        15.5.3. By Type of Meat

        15.5.4. Operation Type

        15.5.5. By Cutter Diameter

        15.5.6. By Product Type

16. Latin America Market Analysis 2018–2022 and Forecast 2023–2033

    16.1. Introduction

    16.2. Pricing Analysis

    16.3. Historical Market Size (US$ Mn) and Volume Trend Analysis By Market Taxonomy, 2018–2022

    16.4. Market Size (US$ Mn) and Volume Forecast By Market Taxonomy, 2023–2033

        16.4.1. By Country

            16.4.1.1. Brazil

            16.4.1.2. Mexico

            16.4.1.3. Rest of Latin America

        16.4.2. By Cutting Capacity

        16.4.3. By Type of Meat

        16.4.4. Operation Type

        16.4.5. By Cutter Diameter

        16.4.6. By Product Type

    16.5. Market Attractiveness Analysis

        16.5.1. By Country

        16.5.2. By Cutting Capacity

        16.5.3. By Type of Meat

        16.5.4. Operation Type

        16.5.5. By Cutter Diameter

        16.5.6. By Product Type

17. Europe Market Analysis 2018–2022 and Forecast 2023–2033

    17.1. Introduction

    17.2. Pricing Analysis

    17.3. Historical Market Size (US$ Mn) and Volume Trend Analysis By Market Taxonomy, 2018–2022

    17.4. Market Size (US$ Mn) and Volume Forecast By Market Taxonomy, 2023–2033

        17.4.1. By Country

            17.4.1.1. Germany

            17.4.1.2. Italy

            17.4.1.3. France

            17.4.1.4. U.K.

            17.4.1.5. Spain

            17.4.1.6. BENELUX

            17.4.1.7. Russia

            17.4.1.8. Rest of Europe

        17.4.2. By Cutting Capacity

        17.4.3. By Type of Meat

        17.4.4. Operation Type

        17.4.5. By Cutter Diameter

        17.4.6. By Product Type

    17.5. Market Attractiveness Analysis

        17.5.1. By Country

        17.5.2. By Cutting Capacity

        17.5.3. By Type of Meat

        17.5.4. Operation Type

        17.5.5. By Cutter Diameter

        17.5.6. By Product Type

18. East Asia Market Analysis 2018–2022 and Forecast 2023–2033

    18.1. Introduction

    18.2. Pricing Analysis

    18.3. Historical Market Size (US$ Mn) and Volume Trend Analysis By Market Taxonomy, 2018–2022

    18.4. Market Size (US$ Mn) and Volume Forecast By Market Taxonomy, 2023–2033

        18.4.1. By Country

            18.4.1.1. China

            18.4.1.2. Japan

            18.4.1.3. South Korea

        18.4.2. By Cutting Capacity

        18.4.3. By Type of Meat

        18.4.4. Operation Type

        18.4.5. By Cutter Diameter

        18.4.6. By Product Type

    18.5. Market Attractiveness Analysis

        18.5.1. By Country

        18.5.2. By Cutting Capacity

        18.5.3. By Type of Meat

        18.5.4. Operation Type

        18.5.5. By Cutter Diameter

        18.5.6. By Product Type

19. South Asia and Pacific Market Analysis 2018–2022 and Forecast 2023–2033

    19.1. Introduction

    19.2. Pricing Analysis

    19.3. Historical Market Size (US$ Mn) and Volume Trend Analysis By Market Taxonomy, 2018–2022

    19.4. Market Size (US$ Mn) and Volume Forecast By Market Taxonomy, 2023–2033

        19.4.1. By Country

            19.4.1.1. India

            19.4.1.2. ASEAN

            19.4.1.3. Oceania

            19.4.1.4. Rest of South Asia & Pacific

        19.4.2. By Cutting Capacity

        19.4.3. By Type of Meat

        19.4.4. Operation Type

        19.4.5. By Cutter Diameter

        19.4.6. By Product Type

    19.5. Market Attractiveness Analysis

        19.5.1. By Country

        19.5.2. By Cutting Capacity

        19.5.3. By Type of Meat

        19.5.4. Operation Type

        19.5.5. By Cutter Diameter

        19.5.6. By Product Type

20. Middle East and Africa Market Analysis 2018–2022 and Forecast 2023–2033

    20.1. Introduction

    20.2. Pricing Analysis

    20.3. Historical Market Size (US$ Mn) and Volume Trend Analysis By Market Taxonomy, 2018–2022

    20.4. Market Size (US$ Mn) and Volume Forecast By Market Taxonomy, 2023–2033

        20.4.1. By Country

            20.4.1.1. GCC Countries

            20.4.1.2. Türkiye

            20.4.1.3. Northern Africa

            20.4.1.4. South Africa

            20.4.1.5. Rest of Middle East and Africa

        20.4.2. By Cutting Capacity

        20.4.3. By Type of Meat

        20.4.4. Operation Type

        20.4.5. By Cutter Diameter

        20.4.6. By Product Type

    20.5. Market Attractiveness Analysis

        20.5.1. By Country

        20.5.2. By Cutting Capacity

        20.5.3. By Type of Meat

        20.5.4. Operation Type

        20.5.5. By Cutter Diameter

        20.5.6. By Product Type

21. Country Wise Market Analysis 2022-2032

    21.1. Introduction

        21.1.1. Market Value Proportion Analysis, By Key Countries

        21.1.2. Global Vs. Country Growth Comparison

    21.2. U.S. Market Analysis

        21.2.1. By Cutting Capacity

        21.2.2. By Type of Meat

        21.2.3. Operation Type

        21.2.4. By Cutter Diameter

        21.2.5. By Product Type

    21.3. Canada Market Analysis

        21.3.1. By Cutting Capacity

        21.3.2. By Type of Meat

        21.3.3. Operation Type

        21.3.4. By Cutter Diameter

        21.3.5. By Product Type

    21.4. Mexico Market Analysis

        21.4.1. By Cutting Capacity

        21.4.2. By Type of Meat

        21.4.3. Operation Type

        21.4.4. By Cutter Diameter

        21.4.5. By Product Type

    21.5. Brazil Market Analysis

        21.5.1. By Cutting Capacity

        21.5.2. By Type of Meat

        21.5.3. Operation Type

        21.5.4. By Cutter Diameter

        21.5.5. By Product Type

    21.6. Germany Market Analysis

        21.6.1. By Cutting Capacity

        21.6.2. By Type of Meat

        21.6.3. Operation Type

        21.6.4. By Cutter Diameter

        21.6.5. By Product Type

    21.7. Italy Market Analysis

        21.7.1. By Cutting Capacity

        21.7.2. By Type of Meat

        21.7.3. Operation Type

        21.7.4. By Cutter Diameter

        21.7.5. By Product Type

    21.8. France Market Analysis

        21.8.1. By Cutting Capacity

        21.8.2. By Type of Meat

        21.8.3. Operation Type

        21.8.4. By Cutter Diameter

        21.8.5. By Product Type

    21.9. U.K. Market Analysis

        21.9.1. By Cutting Capacity

        21.9.2. By Type of Meat

        21.9.3. Operation Type

        21.9.4. By Cutter Diameter

        21.9.5. By Product Type

    21.10. Spain Market Analysis

        21.10.1. By Cutting Capacity

        21.10.2. By Type of Meat

        21.10.3. Operation Type

        21.10.4. By Cutter Diameter

        21.10.5. By Product Type

    21.11. BENELUX Market Analysis

        21.11.1. By Cutting Capacity

        21.11.2. By Type of Meat

        21.11.3. Operation Type

        21.11.4. By Cutter Diameter

        21.11.5. By Product Type

    21.12. Russia Market Analysis

        21.12.1. By Cutting Capacity

        21.12.2. By Type of Meat

        21.12.3. Operation Type

        21.12.4. By Cutter Diameter

        21.12.5. By Product Type

    21.13. China Market Analysis

        21.13.1. By Cutting Capacity

        21.13.2. By Type of Meat

        21.13.3. Operation Type

        21.13.4. By Cutter Diameter

        21.13.5. By Product Type

    21.14. Japan Market Analysis

        21.14.1. By Cutting Capacity

        21.14.2. By Type of Meat

        21.14.3. Operation Type

        21.14.4. By Cutter Diameter

        21.14.5. By Product Type

    21.15. S. Korea Market Analysis

        21.15.1. By Cutting Capacity

        21.15.2. By Type of Meat

        21.15.3. Operation Type

        21.15.4. By Cutter Diameter

        21.15.5. By Product Type

    21.16. India Market Analysis

        21.16.1. By Cutting Capacity

        21.16.2. By Type of Meat

        21.16.3. Operation Type

        21.16.4. By Cutter Diameter

        21.16.5. By Product Type

    21.17. ASEAN Market Analysis

        21.17.1. By Cutting Capacity

        21.17.2. By Type of Meat

        21.17.3. Operation Type

        21.17.4. By Cutter Diameter

        21.17.5. By Product Type

    21.18. Australia and New Zealand Market Analysis

        21.18.1. By Cutting Capacity

        21.18.2. By Type of Meat

        21.18.3. Operation Type

        21.18.4. By Cutter Diameter

        21.18.5. By Product Type

    21.19. GCC Countries Market Analysis

        21.19.1. By Cutting Capacity

        21.19.2. By Type of Meat

        21.19.3. Operation Type

        21.19.4. By Cutter Diameter

        21.19.5. By Product Type

    21.20. Türkiye Market Analysis

        21.20.1. By Cutting Capacity

        21.20.2. By Type of Meat

        21.20.3. Operation Type

        21.20.4. By Cutter Diameter

        21.20.5. By Product Type

    21.21. Northern Africa Market Analysis

        21.21.1. By Cutting Capacity

        21.21.2. By Type of Meat

        21.21.3. Operation Type

        21.21.4. By Cutter Diameter

        21.21.5. By Product Type

    21.22. South Africa Market Analysis

        21.22.1. By Cutting Capacity

        21.22.2. By Type of Meat

        21.22.3. Operation Type

        21.22.4. By Cutter Diameter

        21.22.5. By Product Type

22. Market Structure Analysis

    22.1. Market Analysis by Tier of Companies Market Share Analysis of Top Players

    22.2. Market Presence Analysis

23. Competition Analysis

    23.1. Competition Dashboard

    23.2. Competition Benchmarking

    23.3. Competition Deep Dive

        23.3.1. Marel

            23.3.1.1. Overview

            23.3.1.2. Product Portfolio

            23.3.1.3. Profitability by Market Segments (Product/Channel/Region)

            23.3.1.4. Sales Footprint

            23.3.1.5. Strategy Overview

        23.3.2. Frontmatec Group

            23.3.2.1. Overview

            23.3.2.2. Product Portfolio

            23.3.2.3. Profitability by Market Segments (Product/Channel/Region)

            23.3.2.4. Sales Footprint

            23.3.2.5. Strategy Overview

        23.3.3. Poultry Processing Equipment Worldwide Ltd.

            23.3.3.1. Overview

            23.3.3.2. Product Portfolio

            23.3.3.3. Profitability by Market Segments (Product/Channel/Region)

            23.3.3.4. Sales Footprint

            23.3.3.5. Strategy Overview

        23.3.4. Maragatham Enterprises

            23.3.4.1. Overview

            23.3.4.2. Product Portfolio

            23.3.4.3. Profitability by Market Segments (Product/Channel/Region)

            23.3.4.4. Sales Footprint

            23.3.4.5. Strategy Overview

        23.3.5. Longer Machinery

            23.3.5.1. Overview

            23.3.5.2. Product Portfolio

            23.3.5.3. Profitability by Market Segments (Product/Channel/Region)

            23.3.5.4. Sales Footprint

            23.3.5.5. Strategy Overview

        23.3.6. Henan Joyshine machinery

            23.3.6.1. Overview

            23.3.6.2. Product Portfolio

            23.3.6.3. Profitability by Market Segments (Product/Channel/Region)

            23.3.6.4. Sales Footprint

            23.3.6.5. Strategy Overview

        23.3.7. Hebei QIQIANG Metal products Co. Ltd

            23.3.7.1. Overview

            23.3.7.2. Product Portfolio

            23.3.7.3. Profitability by Market Segments (Product/Channel/Region)

            23.3.7.4. Sales Footprint

            23.3.7.5. Strategy Overview

        23.3.8. Guardian

            23.3.8.1. Overview

            23.3.8.2. Product Portfolio

            23.3.8.3. Profitability by Market Segments (Product/Channel/Region)

            23.3.8.4. Sales Footprint

            23.3.8.5. Strategy Overview

        23.3.9. Jiazou Newest machinery Co. Ltd

            23.3.9.1. Overview

            23.3.9.2. Product Portfolio

            23.3.9.3. Profitability by Market Segments (Product/Channel/Region)

            23.3.9.4. Sales Footprint

            23.3.9.5. Strategy Overview

        23.3.10. Green City Company

            23.3.10.1. Overview

            23.3.10.2. Product Portfolio

            23.3.10.3. Profitability by Market Segments (Product/Channel/Region)

            23.3.10.4. Sales Footprint

            23.3.10.5. Strategy Overview

24. Assumptions and Acronyms Used

25. Research Methodology

Sample Report

FREE Report Sample is Available

In-depth report coverage is now just a few seconds away

Download PDF Get FREE Report Sample

- List Of Table -

Table 01: Global Disc Cutter Market Value (US$ Mn) and Volume (Units) Historical Data 2017–2021 and Forecast 2023–2033 By Cutting Capacity

Table 02: Global Disc Cutter Market Value (US$ Mn) and Volume (Units) Historical Data 2017–2021 and Forecast 2023–2033 By Type of Meat

Table 03: Global Disc Cutter Volume (Units) and Value (US$ Mn) By Operation Type, 2018 – 2022 and Forecast 2023-2033

Table 04: Global Disc Cutter Volume (Units) and Value (US$ Mn) By Cutter Diameter, 2018 – 2022 and Forecast 2023-2033

Table 05: Global Disc Cutter Volume (Units) and Value (US$ Mn) By Product Type, 2018 – 2022 and Forecast 2023-2033

Table 06: Global Disc Cutter Market Value (US$ Mn) and Volume (Units) Historical Data 2017 - 2021 and Forecast 22-32 by Region

Table 07: North America Disc Cutter Volume (Units) and Value (US$ Mn) Historical Data 2017-2021 and Forecast 2023-2033 by Country

Table 08: North America Disc Cutter Volume (Units) and Value (US$ Mn) By Operation Type, 2018 – 2022 and Forecast 2023-2033

Table 09: North America Disc Cutter Market Value (US$ Mn) and Volume (Units) Historical Data 2017–2021 and Forecast 2023–2033 By Cutting Capacity

Table 10: North America Disc Cutter Market Value (US$ Mn) and Volume (Units) Historical Data 2017–2021 and Forecast 2023–2033 By Type of Meat

Table 11: North America Disc Cutter Volume (Units) and Value (US$ Mn) By Cutter Diameter, 2018 – 2022 and Forecast 2023-2033

Table 12: North America Disc Cutter Volume (Units) and Value (US$ Mn) By Product Type, 2018 – 2022 and Forecast 2023-2033

Table 13: Latin America Disc Cutter Volume (Units) and Value (US$ Mn) Historical Data 2017-2021 and Forecast 2023-2033 by Country

Table 14: Latin America Disc Cutter Volume (Units) and Value (US$ Mn) By Operation Type, 2018 – 2022 and Forecast 2023-2033

Table 15: Latin America Disc Cutter Market Value (US$ Mn) and Volume (Units) Historical Data 2017–2021 and Forecast 2023–2033 By Cutting Capacity

Table 16: Latin America Disc Cutter Market Value (US$ Mn) and Volume (Units) Historical Data 2017–2021 and Forecast 2023–2033 By Type of Meat

Table 17: Latin America Disc Cutter Volume (Units) and Value (US$ Mn) By Cutter Diameter, 2018 – 2022 and Forecast 2023-2033

Table 18: Latin America Disc Cutter Volume (Units) and Value (US$ Mn) By Product Type, 2018 – 2022 and Forecast 2023-2033

Table 19: Europe Disc Cutter Volume (Units) and Value (US$ Mn) Historical Data 2017-2021 and Forecast 2023-2033 by Country

Table 20: Europe Disc Cutter Volume (Units) and Value (US$ Mn) By Operation Type, 2018 – 2022 and Forecast 2023-2033

Table 21: Europe Disc Cutter Market Value (US$ Mn) and Volume (Units) Historical Data 2017–2021 and Forecast 2023–2033 By Cutting Capacity

Table 22: Europe Disc Cutter Market Value (US$ Mn) and Volume (Units) Historical Data 2017–2021 and Forecast 2023–2033 By Type of Meat

Table 23: Europe Disc Cutter Volume (Units) and Value (US$ Mn) By Cutter Diameter, 2018 – 2022 and Forecast 2023-2033

Table 24: Europe Disc Cutter Volume (Units) and Value (US$ Mn) By Product Type, 2018 – 2022 and Forecast 2023-2033

Table 25: East Asia Disc Cutter Volume (Units) and Value (US$ Mn) Historical Data 2017-2021 and Forecast 2023-2033 by Country

Table 26: East Asia Disc Cutter Volume (Units) and Value (US$ Mn) By Operation Type, 2018 – 2022 and Forecast 2023-2033

Table 27: East Asia Disc Cutter Market Value (US$ Mn) and Volume (Units) Historical Data 2017–2021 and Forecast 2023–2033 By Cutting Capacity

Table 28: East Asia Disc Cutter Market Value (US$ Mn) and Volume (Units) Historical Data 2017–2021 and Forecast 2023–2033 By Type of Meat

Table 29: East Asia Disc Cutter Volume (Units) and Value (US$ Mn) By Cutter Diameter, 2018 – 2022 and Forecast 2023-2033

Table 30: East Asia Disc Cutter Volume (Units) and Value (US$ Mn) By Product Type, 2018 – 2022 and Forecast 2023-2033

Table 31: South Asia Pacific Disc Cutter Volume (Units) and Value (US$ Mn) Historical Data 2017-2021 and Forecast 2023-2033 by Country

Table 32: South Asia & Pacific Disc Cutter Volume (Units) and Value (US$ Mn) By Operation Type, 2018 – 2022 and Forecast 2023-2033

Table 33: South Asia & Pacific Disc Cutter Market Value (US$ Mn) and Volume (Units) Historical Data 2017–2021 and Forecast 2023–2033 By Cutting Capacity

Table 34: South Asia & Pacific Disc Cutter Market Value (US$ Mn) and Volume (Units) Historical Data 2017–2021 and Forecast 2023–2033 By Type of Meat

Table 35: South Asia & Pacific Disc Cutter Volume (Units) and Value (US$ Mn) By Cutter Diameter, 2018 – 2022 and Forecast 2023-2033

Table 36: South Asia & Pacific Disc Cutter Volume (Units) and Value (US$ Mn) By Product Type, 2018 – 2022 and Forecast 2023-2033

Table 37: Middle East and Africa Disc Cutter Volume (Units) and Value (US$ Mn) Historical Data 2017-2021 and Forecast 2023-2033 by Country

Table 38: South Asia & Pacific Disc Cutter Volume (Units) and Value (US$ Mn) By Operation Type, 2018 – 2022 and Forecast 2023-2033

Table 39: Middle East & Africa Disc Cutter Market Value (US$ Mn) and Volume (Units) Historical Data 2017–2021 and Forecast 2023–2033 By Cutting Capacity

Table 40: Middle East & Africa Disc Cutter Market Value (US$ Mn) and Volume (Units) Historical Data 2017–2021 and Forecast 2023–2033 By Type of Meat

Table 41: Middle East & Africa Disc Cutter Volume (Units) and Value (US$ Mn) By Cutter Diameter, 2018 – 2022 and Forecast 2023-2033

Table 42: Middle East & Africa Disc Cutter Volume (Units) and Value (US$ Mn) By Product Type, 2018 – 2022 and Forecast 2023-2033

Custom Report Cover

Make This Report Your Own

Take Advantage of Intelligence Tailored to your Business Objective

> Get a Customized Version

- List Of Chart -

Figure 01: Global Disc Cutter Market Historical Demand, 2018-2022

Figure 02: Global Disc Cutter Market Demand Forecast, 2023-2033

Figure 03: Global Disc Cutter Market Historical Value (US$ Mn), 2018-2022

Figure 04: Global Disc Cutter Market Value (US$ Mn) Forecast, 2023-2033

Figure 05: Global Disc Cutter Market Absolute $ Opportunity, 2023-2033

Figure 06: Global Disc Cutter Market Share and BPS Analysis by Cutting Capacity – 2023 & 2033

Figure 07: Global Disc Cutter Market Y-o-Y Growth Projections by Cutting Capacity , 2022-2033

Figure 08: Global Disc Cutter Market Attractiveness by Cutting Capacity , 2023-2033

Figure 09: Global Disc Cutter Market Share and BPS Analysis by Type of Meat – 2023 & 2033

Figure 10: Global Disc Cutter Market Y-o-Y Growth Projections by Type of Meat , 2022-2033

Figure 11: Global Disc Cutter Market Attractiveness by Type of Meat , 2023-2033

Figure 12: Global Disc Cutter Share and BPS Analysis By Operation Type– 2023 and 2033

Figure 13: Global Disc Cutter Y-o-Y Growth Projections By Operation Type, 2023-2033

Figure 14: Global Disc Cutter Attractiveness By Operation Type, 2023-2033

Figure 15: Global Disc Cutter Share and BPS Analysis By Cutter Diameter– 2023 and 2033

Figure 16: Global Disc Cutter Y-o-Y Growth Projections By Cutter Diameter, 2023-2033

Figure 17: Global Disc Cutter Attractiveness By Cutter Diameter, 2023-2033

Figure 18: Global Disc Cutter Share and BPS Analysis By Product Type– 2023 and 2033

Figure 19: Global Disc Cutter Y-o-Y Growth Projections By Product Type, 2023-2033

Figure 20: Global Disc Cutter Attractiveness By Product Type, 2023-2033

Figure 21: Global Disc Cutter Market Share and BPS Analysis by Region, 2022 & 2032

Figure 22: Global Disc Cutter Market Y-o-Y Growth Projection by Region, 22-32

Figure 23: Global Disc Cutter Market Attractiveness Analysis by Region

Figure 24: North America Disc Cutter Share and BPS Analysis by Country, 2021 & 2031

Figure 25: North America Disc Cutter Y-o-Y Growth Projection by Country, 2022-2033

Figure 26: North America Disc Cutter Attractiveness Analysis by Country, 2022-2031

Figure 27: North America Disc Cutter Share and BPS Analysis By Operation Type– 2023 and 2033

Figure 28: North America Disc Cutter Y-o-Y Growth Projections By Operation Type, 2023-2033

Figure 29: North America Disc Cutter Attractiveness By Operation Type, 2023-2033

Figure 30: North America Disc Cutter Market Share and BPS Analysis by Cutting Capacity – 2023 & 2033

Figure 31: North America Disc Cutter Market Y-o-Y Growth Projections by Cutting Capacity , 2022-2033

Figure 32: North America Disc Cutter Market Attractiveness by Cutting Capacity , 2023-2033

Figure 33: North America Disc Cutter Market Share and BPS Analysis by Type of Meat – 2023 & 2033

Figure 34: North America Disc Cutter Market Y-o-Y Growth Projections by Type of Meat , 2022-2033

Figure 35: North America Disc Cutter Market Attractiveness by Type of Meat , 2023-2033

Figure 36: North America Disc Cutter Share and BPS Analysis By Cutter Diameter– 2023 and 2033

Figure 37: North America Disc Cutter Y-o-Y Growth Projections By Cutter Diameter, 2023-2033

Figure 38: North America Disc Cutter Attractiveness By Cutter Diameter, 2023-2033

Figure 39: North America Disc Cutter Share and BPS Analysis By Product Type– 2023 and 2033

Figure 40: North America Disc Cutter Y-o-Y Growth Projections By Product Type, 2023-2033

Figure 41: North America Disc Cutter Attractiveness By Product Type, 2023-2033

Figure 42: Latin America Disc Cutter Share and BPS Analysis by Country, 2021 & 2031

Figure 43: Latin America Disc Cutter Y-o-Y Growth Projection by Country, 2022-2033

Figure 44: Latin America Disc Cutter Attractiveness Analysis by Country, 2022-2031

Figure 45: Latin America Disc Cutter Share and BPS Analysis By Operation Type– 2023 and 2033

Figure 46: Latin America Disc Cutter Y-o-Y Growth Projections By Operation Type, 2023-2033

Figure 47: Latin America Disc Cutter Attractiveness By Operation Type, 2023-2033

Figure 48: Latin America Disc Cutter Market Share and BPS Analysis by Cutting Capacity – 2023 & 2033

Figure 49: Latin America Disc Cutter Market Y-o-Y Growth Projections by Cutting Capacity , 2022-2033

Figure 50: Latin America Disc Cutter Market Attractiveness by Cutting Capacity , 2023-2033

Figure 51: Latin America Disc Cutter Market Share and BPS Analysis by Type of Meat – 2023 & 2033

Figure 52: Latin America Disc Cutter Market Y-o-Y Growth Projections by Type of Meat , 2022-2033

Figure 53: Latin America Disc Cutter Market Attractiveness by Type of Meat , 2023-2033

Figure 54: Latin America Disc Cutter Share and BPS Analysis By Cutter Diameter– 2023 and 2033

Figure 55: Latin America Disc Cutter Y-o-Y Growth Projections By Cutter Diameter, 2023-2033

Figure 56: Latin America Disc Cutter Attractiveness By Cutter Diameter, 2023-2033

Figure 57: Latin America Disc Cutter Share and BPS Analysis By Product Type– 2023 and 2033

Figure 58: Latin America Disc Cutter Y-o-Y Growth Projections By Product Type, 2023-2033

Figure 59: Latin America Disc Cutter Attractiveness By Product Type, 2023-2033

Figure 60: Europe Disc Cutter Share and BPS Analysis by Country, 2021 & 2031

Figure 61: Europe Disc Cutter Y-o-Y Growth Projection by Country, 2022-2033

Figure 62: Europe Disc Cutter Attractiveness Analysis by Country, 2022-2031

Figure 63: Europe Disc Cutter Share and BPS Analysis By Operation Type– 2023 and 2033

Figure 64: Europe Disc Cutter Y-o-Y Growth Projections By Operation Type, 2023-2033

Figure 65: Europe Disc Cutter Attractiveness By Operation Type, 2023-2033

Figure 66: Europe Disc Cutter Market Share and BPS Analysis by Cutting Capacity – 2023 & 2033

Figure 67: Europe Disc Cutter Market Y-o-Y Growth Projections by Cutting Capacity , 2022-2033

Figure 68: Europe Disc Cutter Market Attractiveness by Cutting Capacity , 2023-2033

Figure 69: Europe Disc Cutter Market Share and BPS Analysis by Type of Meat – 2023 & 2033

Figure 70: Europe Disc Cutter Market Y-o-Y Growth Projections by Type of Meat , 2022-2033

Figure 71: Europe Disc Cutter Market Attractiveness by Type of Meat , 2023-2033

Figure 72: Europe Disc Cutter Share and BPS Analysis By Cutter Diameter– 2023 and 2033

Figure 73: Europe Disc Cutter Y-o-Y Growth Projections By Cutter Diameter, 2023-2033

Figure 74: Europe Disc Cutter Attractiveness By Cutter Diameter, 2023-2033

Figure 75: Europe Disc Cutter Share and BPS Analysis By Product Type– 2023 and 2033

Figure 76: Europe Disc Cutter Y-o-Y Growth Projections By Product Type, 2023-2033

Figure 77: Europe Disc Cutter Attractiveness By Product Type, 2023-2033

Figure 78: East Asia Disc Cutter Share and BPS Analysis by Country, 2021 & 2031

Figure 79: East Asia Disc Cutter Y-o-Y Growth Projection by Country, 2022-2033

Figure 80: East Asia Disc Cutter Attractiveness Analysis by Country, 2022-2031

Figure 81: East Asia Disc Cutter Share and BPS Analysis By Operation Type– 2023 and 2033

Figure 82: East Asia Disc Cutter Y-o-Y Growth Projections By Operation Type, 2023-2033

Figure 83: East Asia Disc Cutter Attractiveness By Operation Type, 2023-2033

Figure 84: East Asia Disc Cutter Market Share and BPS Analysis by Cutting Capacity – 2023 & 2033

Figure 85: East Asia Disc Cutter Market Y-o-Y Growth Projections by Cutting Capacity , 2022-2033

Figure 86: East Asia Disc Cutter Market Attractiveness by Cutting Capacity , 2023-2033

Figure 87: East Asia Disc Cutter Market Share and BPS Analysis by Type of Meat – 2023 & 2033

Figure 88: East Asia Disc Cutter Market Y-o-Y Growth Projections by Type of Meat , 2022-2033

Figure 89: East Asia Disc Cutter Market Attractiveness by Type of Meat , 2023-2033

Figure 90: East Asia Disc Cutter Share and BPS Analysis By Cutter Diameter– 2023 and 2033

Figure 91: East Asia Disc Cutter Y-o-Y Growth Projections By Cutter Diameter, 2023-2033

Figure 92: East Asia Disc Cutter Attractiveness By Cutter Diameter, 2023-2033

Figure 93: East Asia Disc Cutter Share and BPS Analysis By Product Type– 2023 and 2033

Figure 94: East Asia Disc Cutter Y-o-Y Growth Projections By Product Type, 2023-2033

Figure 95: East Asia Disc Cutter Attractiveness By Product Type, 2023-2033

Figure 96: South Asia Pacific Disc Cutter Share and BPS Analysis by Country, 2021 & 2031

Figure 97: South Asia Pacific Disc Cutter Y-o-Y Growth Projection by Country, 2022-2033

Figure 98: South Asia Pacific Disc Cutter Attractiveness Analysis by Country, 2022-2031

Figure 99: South Asia & Pacific Disc Cutter Share and BPS Analysis By Operation Type– 2023 and 2033

Figure 100: South Asia & Pacific Disc Cutter Y-o-Y Growth Projections By Operation Type, 2023-2033

Figure 101: South Asia & Pacific Disc Cutter Attractiveness By Operation Type, 2023-2033

Figure 102: South Asia & Pacific Disc Cutter Market Share and BPS Analysis by Cutting Capacity – 2023 & 2033

Figure 103: South Asia & Pacific Disc Cutter Market Y-o-Y Growth Projections by Cutting Capacity , 2022-2033

Figure 104: South Asia & Pacific Disc Cutter Market Attractiveness by Cutting Capacity , 2023-2033

Figure 105: South Asia & Pacific Disc Cutter Market Share and BPS Analysis by Type of Meat – 2023 & 2033

Figure 106: South Asia & Pacific Disc Cutter Market Y-o-Y Growth Projections by Type of Meat , 2022-2033

Figure 107: South Asia & Pacific Disc Cutter Market Attractiveness by Type of Meat , 2023-2033

Figure 108: South Asia & Pacific Disc Cutter Share and BPS Analysis By Cutter Diameter– 2023 and 2033

Figure 109: South Asia & Pacific Disc Cutter Y-o-Y Growth Projections By Cutter Diameter, 2023-2033

Figure 110: South Asia & Pacific Disc Cutter Attractiveness By Cutter Diameter, 2023-2033

Figure 111: South Asia & Pacific Disc Cutter Share and BPS Analysis By Product Type– 2023 and 2033

Figure 112: South Asia & Pacific Disc Cutter Y-o-Y Growth Projections By Product Type, 2023-2033

Figure 113: South Asia & Pacific Disc Cutter Attractiveness By Product Type, 2023-2033

Figure 114: Middle East and Africa Disc Cutter Share and BPS Analysis by Country, 2021 & 2031

Figure 115: Middle East and Africa Disc Cutter Y-o-Y Growth Projection by Country, 2022-2033

Figure 116: Middle East and Africa Disc Cutter Attractiveness Analysis by Country, 2022-2031

Figure 117: Middle East & Africa Disc Cutter Share and BPS Analysis By Operation Type– 2023 and 2033

Figure 118: Middle East & Africa Disc Cutter Y-o-Y Growth Projections By Operation Type, 2023-2033

Figure 119: Middle East & Africa Disc Cutter Attractiveness By Operation Type, 2023-2033

Figure 120: South Asia & Pacific Disc Cutter Market Share and BPS Analysis by Cutting Capacity – 2023 & 2033

Figure 121: South Asia & Pacific Disc Cutter Market Y-o-Y Growth Projections by Cutting Capacity , 2022-2033

Figure 122: South Asia & Pacific Disc Cutter Market Attractiveness by Cutting Capacity , 2023-2033

Figure 123: Middle East & Africa Disc Cutter Market Share and BPS Analysis by Type of Meat – 2023 & 2033

Figure 124: Middle East & Africa Disc Cutter Market Y-o-Y Growth Projections by Type of Meat , 2022-2033

Figure 125: Middle East & Africa Disc Cutter Market Attractiveness by Type of Meat , 2023-2033

Figure 126: Middle East & Africa Disc Cutter Share and BPS Analysis By Cutter Diameter– 2023 and 2033

Figure 127: Middle East & Africa Disc Cutter Y-o-Y Growth Projections By Cutter Diameter, 2023-2033

Figure 128: Middle East & Africa Disc Cutter Attractiveness By Cutter Diameter, 2023-2033

Figure 129: Middle East & Africa Disc Cutter Share and BPS Analysis By Product Type– 2023 and 2033

Figure 130: Middle East & Africa Disc Cutter Y-o-Y Growth Projections By Product Type, 2023-2033

Figure 131: Middle East & Africa Disc Cutter Attractiveness By Product Type, 2023-2033

This site uses cookies, including third-party cookies, that help us to provide and improve our services. Privacy Policy
Google translate