


- Executive Summary
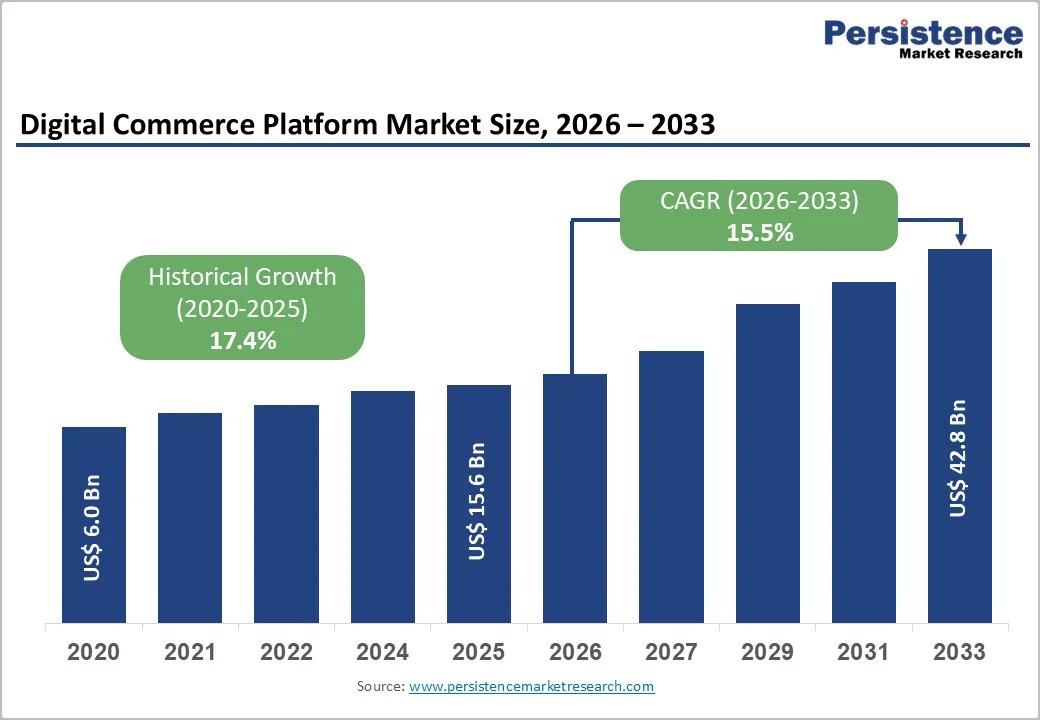
- Global Digital Commerce Platform Market Snapshot 2026 and 2033
- Market Opportunity Assessment, 2026 - 2033, US$ Bn
- Key Market Trends
- Industry Developments and Key Market Events
- Demand Side and Supply Side Analysis
- PMR Analysis and Recommendations
- Market Overview
- Market Scope and Definitions
- Value Chain Analysis
- Macro-Economic Factors
- Global GDP Outlook
- Global Prison Growth Outlook
- Global Crime Rates by Country
- Global Prison Population by Country
- Global Private Prison Market Growth Outlook
- Other Macro-economic Factors
- Forecast Factors - Relevance and Impact
- COVID-19 Impact Assessment
- PESTLE Analysis
- Porter's Five Forces Analysis
- Geopolitical Tensions: Market Impact
- Regulatory and Technology Landscape
- Market Dynamics
- Drivers
- Restraints
- Opportunities
- Trends
- Price Trend Analysis, 2020 - 2033
- Region-wise Price Analysis
- Price by Segments
- Price Impact Factors
- Global Digital Commerce Platform Market Outlook: Historical (2020 - 2025) and Forecast (2026 - 2033)
- Key Highlights
- Global Digital Commerce Platform Market Outlook: Business Model
- Introduction/Key Findings
- Historical Market Size (US$ Bn) Analysis by Business Model, 2020-2025
- Current Market Size (US$ Bn) Forecast, by Business Model, 2026-2033
- B2C
- B2B
- C2C
- D2C
- Market Attractiveness Analysis: Business Model
- Global Digital Commerce Platform Market Outlook: Deployment
- Introduction/Key Findings
- Historical Market Size (US$ Bn) Analysis by Deployment, 2020-2025
- Current Market Size (US$ Bn) Forecast, by Deployment, 2026-2033
- Cloud-based
- On-premise
- Hybrid
- Market Attractiveness Analysis: Deployment
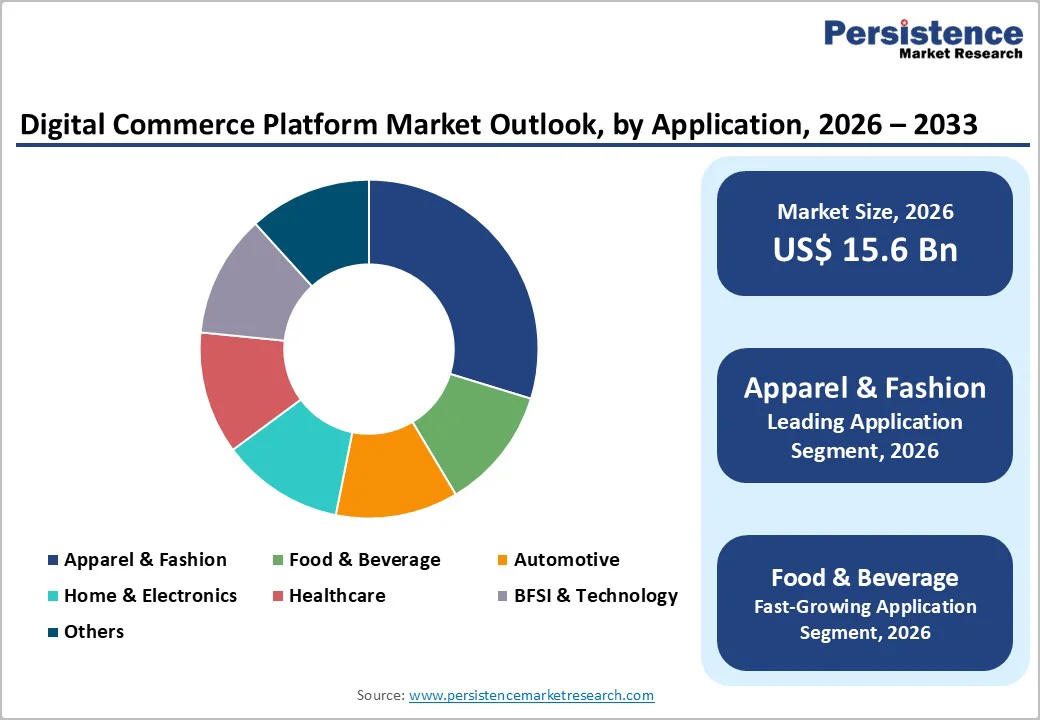
- Global Digital Commerce Platform Market Outlook: Application
- Introduction/Key Findings
- Historical Market Size (US$ Bn) Analysis by Application, 2020-2025
- Current Market Size (US$ Bn) Forecast, by Application, 2026-2033
- Apparel & Fashion
- Food & Beverage
- Automotive
- Home & Electronics
- Healthcare
- BFSI & Technology
- Others
- Market Attractiveness Analysis: Application
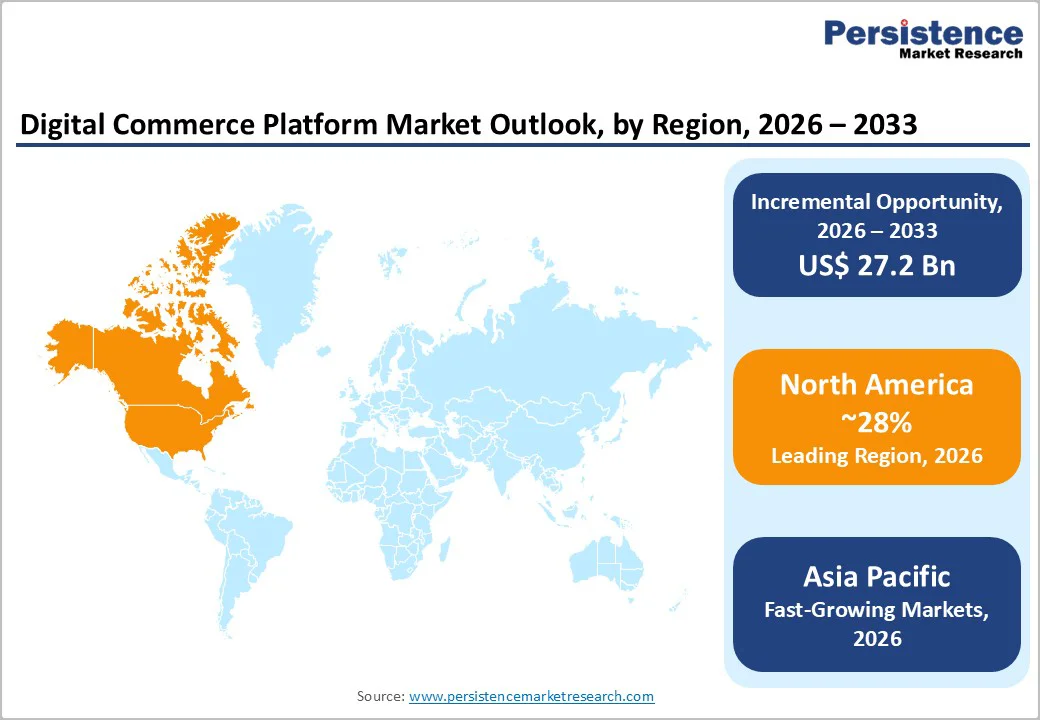
- Global Digital Commerce Platform Market Outlook: Region
- Key Highlights
- Historical Market Size (US$ Bn) Analysis by Region, 2020-2025
- Current Market Size (US$ Bn) Forecast, by Region, 2026-2033
- North America
- Europe
- East Asia
- South Asia & Oceania
- Latin America
- Middle East & Africa
- Market Attractiveness Analysis: Region
- North America Digital Commerce Platform Market Outlook: Historical (2020 - 2025) and Forecast (2026 - 2033)
- Key Highlights
- Pricing Analysis
- North America Market Size (US$ Bn) Forecast, by Country, 2026-2033
- U.S.
- Canada
- North America Market Size (US$ Bn) Forecast, by Business Model, 2026-2033
- B2C
- B2B
- C2C
- D2C
- North America Market Size (US$ Bn) Forecast, by Deployment, 2026-2033
- Cloud-based
- On-premise
- Hybrid
- North America Market Size (US$ Bn) Forecast, by Application, 2026-2033
- Apparel & Fashion
- Food & Beverage
- Automotive
- Home & Electronics
- Healthcare
- BFSI & Technology
- Others
- Europe Digital Commerce Platform Market Outlook: Historical (2020 - 2025) and Forecast (2026 - 2033)
- Key Highlights
- Pricing Analysis
- Europe Market Size (US$ Bn) Forecast, by Country, 2026-2033
- Germany
- Italy
- France
- U.K.
- Spain
- Russia
- Rest of Europe
- Europe Market Size (US$ Bn) Forecast, by Business Model, 2026-2033
- B2C
- B2B
- C2C
- D2C
- Europe Market Size (US$ Bn) Forecast, by Deployment, 2026-2033
- Cloud-based
- On-premise
- Hybrid
- Europe Market Size (US$ Bn) Forecast, by Application, 2026-2033
- Apparel & Fashion
- Food & Beverage
- Automotive
- Home & Electronics
- Healthcare
- BFSI & Technology
- Others
- East Asia Digital Commerce Platform Market Outlook: Historical (2020 - 2025) and Forecast (2026 - 2033)
- Key Highlights
- Pricing Analysis
- East Asia Market Size (US$ Bn) Forecast, by Country, 2026-2033
- China
- Japan
- South Korea
- East Asia Market Size (US$ Bn) Forecast, by Business Model, 2026-2033
- B2C
- B2B
- C2C
- D2C
- East Asia Market Size (US$ Bn) Forecast, by Deployment, 2026-2033
- Cloud-based
- On-premise
- Hybrid
- East Asia Market Size (US$ Bn) Forecast, by Application, 2026-2033
- Apparel & Fashion
- Food & Beverage
- Automotive
- Home & Electronics
- Healthcare
- BFSI & Technology
- Others
- South Asia & Oceania Digital Commerce Platform Market Outlook: Historical (2020 - 2025) and Forecast (2026 - 2033)
- Key Highlights
- Pricing Analysis
- South Asia & Oceania Market Size (US$ Bn) Forecast, by Country, 2026-2033
- India
- Southeast Asia
- ANZ
- Rest of SAO
- South Asia & Oceania Market Size (US$ Bn) Forecast, by Business Model, 2026-2033
- B2C
- B2B
- C2C
- D2C
- South Asia & Oceania Market Size (US$ Bn) Forecast, by Deployment, 2026-2033
- Cloud-based
- On-premise
- Hybrid
- South Asia & Oceania Market Size (US$ Bn) Forecast, by Application, 2026-2033
- Apparel & Fashion
- Food & Beverage
- Automotive
- Home & Electronics
- Healthcare
- BFSI & Technology
- Others
- Latin America Digital Commerce Platform Market Outlook: Historical (2020 - 2025) and Forecast (2026 - 2033)
- Key Highlights
- Pricing Analysis
- Latin America Market Size (US$ Bn) Forecast, by Country, 2026-2033
- Brazil
- Mexico
- Rest of LATAM
- Latin America Market Size (US$ Bn) Forecast, by Business Model, 2026-2033
- B2C
- B2B
- C2C
- D2C
- Latin America Market Size (US$ Bn) Forecast, by Deployment, 2026-2033
- Cloud-based
- On-premise
- Hybrid
- Latin America Market Size (US$ Bn) Forecast, by Application, 2026-2033
- Apparel & Fashion
- Food & Beverage
- Automotive
- Home & Electronics
- Healthcare
- BFSI & Technology
- Others
- Middle East & Africa Digital Commerce Platform Market Outlook: Historical (2020 - 2025) and Forecast (2026 - 2033)
- Key Highlights
- Pricing Analysis
- Middle East & Africa Market Size (US$ Bn) Forecast, by Country, 2026-2033
- GCC Countries
- South Africa
- Northern Africa
- Rest of MEA
- Middle East & Africa Market Size (US$ Bn) Forecast, by Business Model, 2026-2033
- B2C
- B2B
- C2C
- D2C
- Middle East & Africa Market Size (US$ Bn) Forecast, by Deployment, 2026-2033
- Cloud-based
- On-premise
- Hybrid
- Middle East & Africa Market Size (US$ Bn) Forecast, by Application, 2026-2033
- Apparel & Fashion
- Food & Beverage
- Automotive
- Home & Electronics
- Healthcare
- BFSI & Technology
- Others
- Competition Landscape
- Market Share Analysis, 2025
- Market Structure
- Competition Intensity Mapping
- Competition Dashboard
- Company Profiles
- Shopify
- Company Overview
- Product Portfolio/Offerings
- Key Financials
- SWOT Analysis
- Company Strategy and Key Developments
- eBay
- Squarespace
- Bigcommerce
- Amazon
- Adobecommerce
- SAP
- Oracle
- Salesforce
- Woocommerce
- Opencart
- Wix
- Prestashop
- Ecwid
- Weebly
- Shopify
- Appendix
- Research Methodology
- Research Assumptions
- Acronyms and Abbreviations

Loading page data
Please wait a moment


