


- Executive Summary
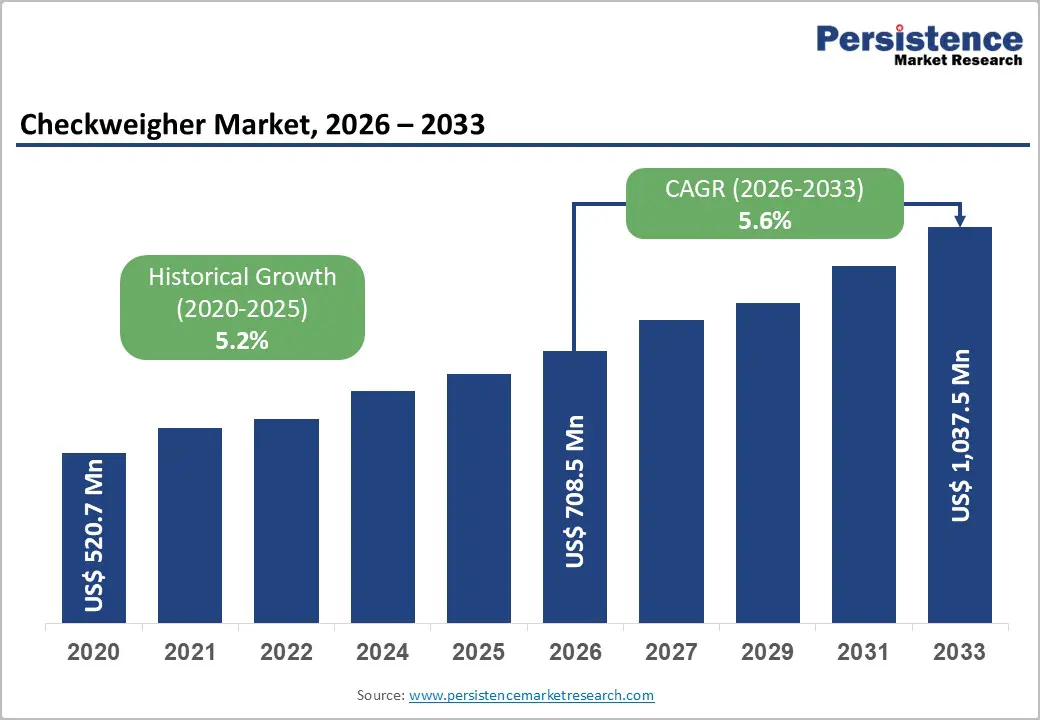
- Global Checkweigher Market Snapshot, 2026 and 2033
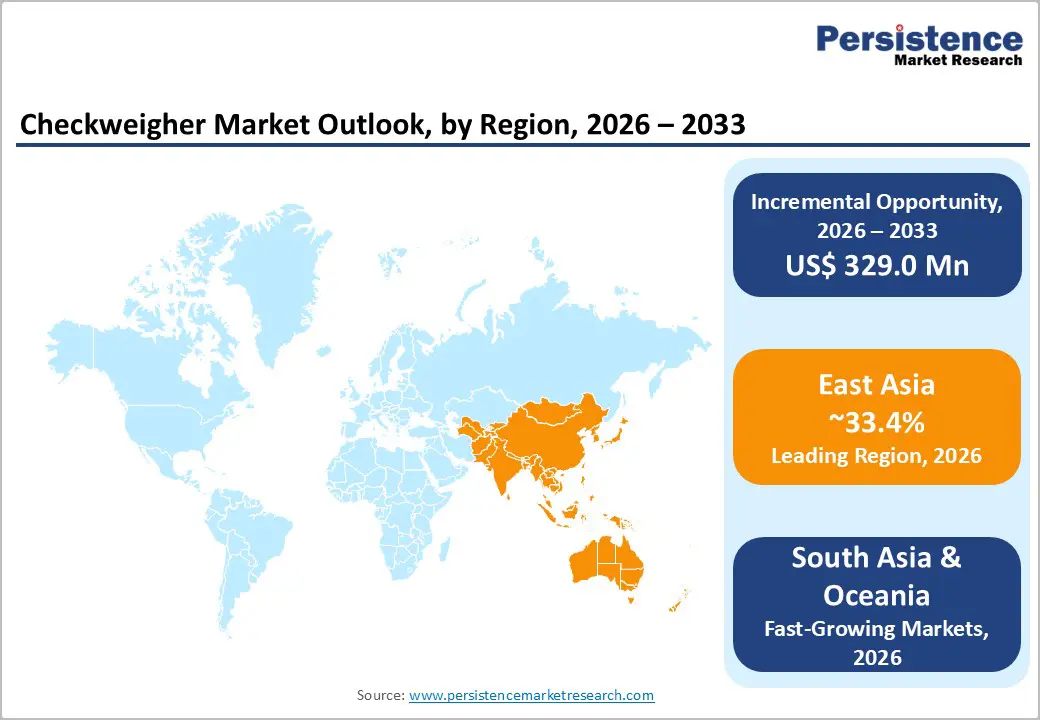
- Market Opportunity Assessment, 2026 - 2033, US$ Mn
- Key Market Trends
- Future Market Projections
- Premium Market Insights
- Industry Developments and Key Market Events
- PMR Analysis and Recommendations
- Market Overview
- Market Scope and Definition
- Market Dynamics
- Drivers
- Restraints
- Opportunity
- Challenges
- Key Trends
- Product Lifecycle Analysis
- Global Parent Market Overview
- Checkweigher Market: Value Chain
- List of Raw Technology Type Supplier
- List of Manufacturers
- List of Distributors
- List of End Use Industry Industries
- Profitability Analysis
- Forecast Factors - Relevance and Impact
- Covid-19 Impact Assessment
- PESTLE Analysis
- Porter Five Force’s Analysis
- Geopolitical Tensions: Market Impact
- Regulatory and Technology Type Landscape
- 3.1. Macro-Economic Factors
- Global Sectorial Outlook
- Global GDP Growth Outlook
- Other Macro-economic Factors
- Price Trend Analysis, 2020 - 2033
- Key Highlights
- Key Factors Impacting Product Prices
- Prices By Product Type /Technology Type/Organization Size
- Regional Prices and Product Preferences
- Global Checkweigher Market Outlook: Historical (2020 - 2025) and Forecast (2026 - 2033)
- Key Highlights
- Market Size and Y-o-Y Growth
- Absolute $ Opportunity
- Market Size (US$ Mn) Analysis and Forecast
- Historical Market Size Analysis, 2020-2025
- Current Market Size Forecast, 2020-2033
- Global Checkweigher Market Outlook: Type
- Introduction / Key Findings
- Historical Market Size (US$ Mn) Analysis By Product Type , 2020 - 2025
- Current Market Size (US$ Mn) and Volume (Unit)Forecast By Product Type , 2026 - 2033
- Standalone Systems
- Combination Systems
- Market Attractiveness Analysis: Product Type
- Global Checkweigher Market Outlook: Technology Type
- Introduction / Key Findings
- Historical Market Size (US$ Mn) Analysis By Technology Type, 2020 - 2025
- Current Market Size (US$ Mn) and Volume (Unit)Forecast By Technology Type, 2026 - 2033
- Strain Gauge
- Electromagnetic Force Restoration
- Market Attractiveness Analysis: Technology Type
- Global Checkweigher Market Outlook Capacity
- Introduction / Key Findings
- Historical Market Size (US$ Mn) Analysis By Capacity, 2020 - 2025
- Current Market Size (US$ Mn) and Volume (Unit)Forecast By Capacity, 2026 - 2033
- Up to 12 kg
- 12 to 60 kg
- Above 60 kg
- Market Attractiveness Analysis: Capacity
- Global Checkweigher Market Outlook End Use Industry
- Introduction / Key Findings
- Historical Market Size (US$ Mn) Analysis By End Use Industry, 2020 - 2025
- Current Market Size (US$ Mn) and Volume (Unit)Forecast By End Use Industry, 2026 - 2033
- Food and Beverages
- Pharmaceutical
- Personal Care
- Logistics and Packaging
- Others.
- Market Attractiveness Analysis: End Use Industry
- Key Highlights
- Global Checkweigher Market Outlook Region
- Key Highlights
- Historical Market Size (US$ Mn) Analysis By Region, 2020 - 2025
- Current Market Size (US$ Mn) and Volume (Unit)Forecast By Region, 2026 - 2033
- North America
- Europe
- East Asia
- South Asia and Oceania
- Latin America
- Middle East & Africa
- Market Attractiveness Analysis: Region
- North America Checkweigher Market Outlook: Historical (2020 - 2025) and Forecast (2026 - 2033)
- Key Highlights
- Pricing Analysis
- Historical Market Size (US$ Mn) Analysis By Market, 2020 - 2025
- By Country
- By Product Type
- By Technology Type
- By Capacity
- By End Use Industry
- Current Market Size (US$ Mn) and Volume (Unit)Forecast By Country, 2026 - 2033
- U.S.
- Canada
- Current Market Size (US$ Mn) and Volume (Unit)Forecast By Product Type , 2026 - 2033
- Standalone Systems
- Combination Systems
- Current Market Size (US$ Mn) and Volume (Unit)Forecast By Technology Type, 2026 - 2033
- Strain Gauge
- Electromagnetic Force Restoration
- Current Market Size (US$ Mn) and Volume (Unit)Forecast By Capacity, 2026 - 2033
- Up to 12 kg
- 12 to 60 kg
- Above 60 kg
- Current Market Size (US$ Mn) and Volume (Unit)Forecast By End Use Industry, 2026 - 2033
- Food and Beverages
- Pharmaceutical
- Personal Care
- Logistics and Packaging
- Others
- Market Attractiveness Analysis
- Europe Checkweigher Market Outlook: Historical (2020 - 2025) and Forecast (2026 - 2033)
- Key Highlights
- Pricing Analysis
- Historical Market Size (US$ Mn) Analysis By Market, 2020 - 2025
- By Country
- By Product Type
- By Technology Type
- By Capacity
- By End Use Industry
- By Current Market Size (US$ Mn) and Volume (Unit)Forecast By Country, 2026 - 2033
- Germany
- Italy
- France
- U.K.
- Spain
- Russia
- Türkiye
- Rest of Europe
- Current Market Size (US$ Mn) and Volume (Unit)Forecast By Product Type , 2026 - 2033
- Standalone Systems
- Combination Systems
- Current Market Size (US$ Mn) and Volume (Unit)Forecast By Technology Type, 2026 - 2033
- Strain Gauge
- Electromagnetic Force Restoration
- Current Market Size (US$ Mn) and Volume (Unit)Forecast By Capacity, 2026 - 2033
- Up to 12 kg
- 12 to 60 kg
- Above 60 kg
- Current Market Size (US$ Mn) and Volume (Unit)Forecast By End Use Industry, 2026 - 2033
- Food and Beverages
- Pharmaceutical
- Personal Care
- Logistics and Packaging
- Others
- Market Attractiveness Analysis
- East Asia Checkweigher Market Outlook: Historical (2020 - 2025) and Forecast (2026 - 2033)
- Key Highlights
- Pricing Analysis
- Historical Market Size (US$ Mn) Analysis By Market, 2020 - 2025
- By Country
- By Product Type
- By Technology Type
- By Capacity
- By End Use Industry
- Current Market Size (US$ Mn) and Volume (Unit)Forecast By Country, 2026 - 2033
- China
- Japan
- South Korea
- Current Market Size (US$ Mn) and Volume (Unit)Forecast By Product Type , 2026 - 2033
- Standalone Systems
- Combination Systems
- Current Market Size (US$ Mn) and Volume (Unit)Forecast By Technology Type, 2026 - 2033
- Strain Gauge
- Electromagnetic Force Restoration
- Current Market Size (US$ Mn) and Volume (Unit)Forecast By Capacity, 2026 - 2033
- Up to 12 kg
- 12 to 60 kg
- Above 60 kg
- Current Market Size (US$ Mn) and Volume (Unit)Forecast By End Use Industry, 2026 - 2033
- Food and Beverages
- Pharmaceutical
- Personal Care
- Logistics and Packaging
- Others
- Market Attractiveness Analysis
- South Asia & Oceania Checkweigher Market Outlook: Historical (2020 - 2025) and Forecast (2026 - 2033)
- Key Highlights
- Pricing Analysis
- Historical Market Size (US$ Mn) Analysis By Market, 2020 - 2025
- By Country
- By Product Type
- By Technology Type
- By Capacity
- By End Use Industry
- Current Market Size (US$ Mn) and Volume (Unit)Forecast By Product Type , 2026 - 2033
- Standalone Systems
- Combination Systems
- Current Market Size (US$ Mn) and Volume (Unit)Forecast By Technology Type, 2026 - 2033
- Strain Gauge
- Electromagnetic Force Restoration
- Current Market Size (US$ Mn) and Volume (Unit)Forecast By Capacity, 2026 - 2033
- Up to 12 kg
- 12 to 60 kg
- Above 60 kg
- Current Market Size (US$ Mn) and Volume (Unit)Forecast By End Use Industry, 2026 - 2033
- Food and Beverages
- Pharmaceutical
- Personal Care
- Logistics and Packaging
- Others
- Market Attractiveness Analysis
- Latin America Checkweigher Market Outlook: Historical (2020 - 2025) and Forecast (2026 - 2033)
- Key Highlights
- Pricing Analysis
- Historical Market Size (US$ Mn) Analysis By Market, 2020 - 2025
- By Country
- By Product Type
- By Technology Type
- By Capacity
- By End Use Industry
- Current Market Size (US$ Mn) and Volume (Unit)Forecast By Country, 2026 - 2033
- Brazil
- Mexico
- Rest of Latin America
- Current Market Size (US$ Mn) and Volume (Unit)Forecast By Product Type , 2026 - 2033
- Standalone Systems
- Combination Systems
- Current Market Size (US$ Mn) and Volume (Unit)Forecast By Technology Type, 2026 - 2033
- Strain Gauge
- Electromagnetic Force Restoration
- Current Market Size (US$ Mn) and Volume (Unit)Forecast By Capacity, 2026 - 2033
- Up to 12 kg
- 12 to 60 kg
- Above 60 kg
- Current Market Size (US$ Mn) and Volume (Unit)Forecast By End Use Industry, 2026 - 2033
- Food and Beverages
- Pharmaceutical
- Personal Care
- Logistics and Packaging
- Others
- Market Attractiveness Analysis
- Middle East & Africa Checkweigher Market Outlook: Historical (2020 - 2025) and Forecast (2026 - 2033)
- Key Highlights
- Pricing Analysis
- Historical Market Size (US$ Mn) Analysis By Market, 2020 - 2025
- By Country
- By Product Type
- By Technology Type
- By Capacity
- By End Use Industry
- Current Market Size (US$ Mn) and Volume (Unit)Forecast By Country, 2026 - 2033
- GCC Countries
- South Africa
- Northern Africa
- Rest of MEA
- Current Market Size (US$ Mn) and Volume (Unit)Forecast By Product Type , 2026 - 2033
- Standalone Systems
- Combination Systems
- Current Market Size (US$ Mn) and Volume (Unit)Forecast By Technology Type, 2026 - 2033
- Strain Gauge
- Electromagnetic Force Restoration
- Current Market Size (US$ Mn) and Volume (Unit)Forecast By Capacity, 2026 - 2033
- Up to 12 kg
- 12 to 60 kg
- Above 60 kg
- Current Market Size (US$ Mn) and Volume (Unit)Forecast By End Use Industry, 2026 - 2033
- Food and Beverages
- Pharmaceutical
- Personal Care
- Logistics and Packaging
- Others
- Market Attractiveness Analysis
- Competition Landscape
- Market Share Analysis, 2025
- Market Structure
- Competition Intensity Mapping By Market
- Competition Dashboard
- Apparent Production Capacity
- Company Profiles (Details - Overview, Financials, Strategy, Recent Developments)
- Mettler Toledo
- Overview
- Segments and Products
- Key Financials
- Market Developments
- Anritsu Infivis
- Multivac
- Bizerba
- Yamato Scale
- WIPOTEC-OCS
- LOMA Systems
- Ishida Co., Ltd
- Cassel Messtechnik GmbH
- Thermo Fishcer Scientific Inc
- Note: List of companies is not exhaustive in Nature . It is subject to further augmentation during course of research
- Mettler Toledo
- Appendix
- Research Methodology
- Research Assumptions
- Acronyms and Abbreviations

Loading page data
Please wait a moment


