


- Home Appliances
- Bounding Table Market
Bounding Table Market Size, Share, and Growth Forecast, 2026-2033
Bounding Table Market by Product (Standard Type, Feature Tier, Performance Level, Customization Options, Integration Capabilities), End-User (Consumer (B2C), Commercial (B2B), Government, Vertical-specific Use Cases), Distribution Channel (Direct Sales, Online Platforms, Retail & Specialty Stores, Value-added Resellers, OEM Partnerships), and Regional Analysis for 2026-2033
Bounding Table Market Share and Trends Analysis
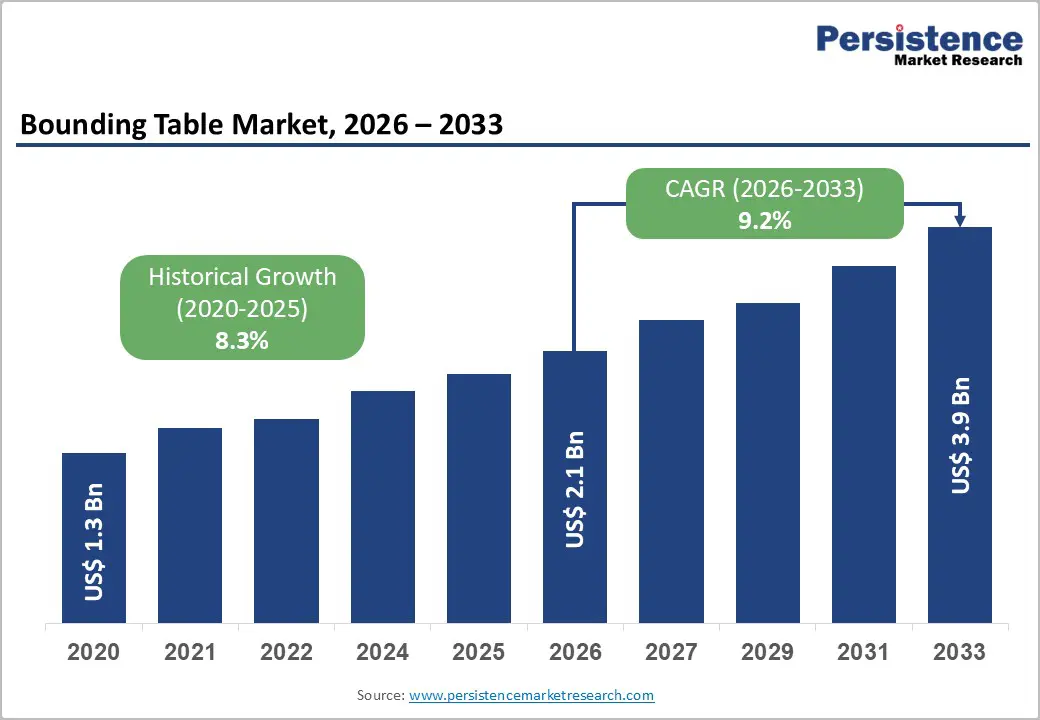
The global bounding table market size is likely to be valued at US$ 2.1 billion in 2026, and is projected to reach US$ 3.9 billion by 2033, growing at a CAGR of 9.2% during the forecast period 2026–2033.
Market growth is supported by increasing commercial infrastructure investments, hybrid workspace expansion, and customization trends across B2B segments. According to global infrastructure outlooks published by multilateral development institutions, commercial building upgrades and retrofit projects continue to attract steady capital allocation, particularly in urban business districts. Hybrid work adoption has encouraged enterprises to redesign collaborative spaces, driving demand for modular and reconfigurable bounding tables.
Technological convergence, including IoT-enabled surfaces, integrated power systems, and modular engineering, continues to improve average selling prices and recurring service revenues through analytics and maintenance contracts. The market outlook remains structurally positive, underpinned by capital expenditure cycles in commercial real estate, workplace digitization strategies, and environmental, social, & governance (ESG)-aligned procurement policies.
Key Industry Highlights
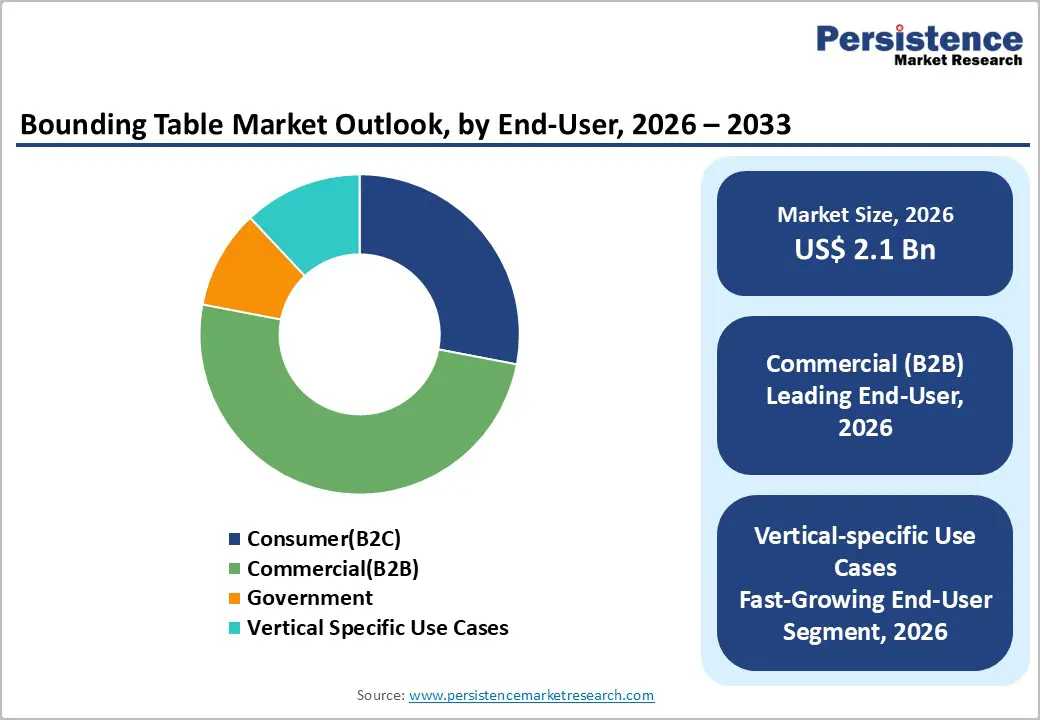
- Dominant End-Users: Commercial (B2B) is projected to lead with over 50% revenue share in 2026, while vertical-specific use cases are expected to be the fastest growing at a CAGR of around 10.4% through 2033, driven by institutional and specialized workspace investments.
- Leading Product Tier: Standard type-based tables are estimated to account for approximately 36% share in 2026, whereas integration-capable tiers are forecast to grow the fastest during 2026–2033, supported by IoT-enabled workspace adoption.
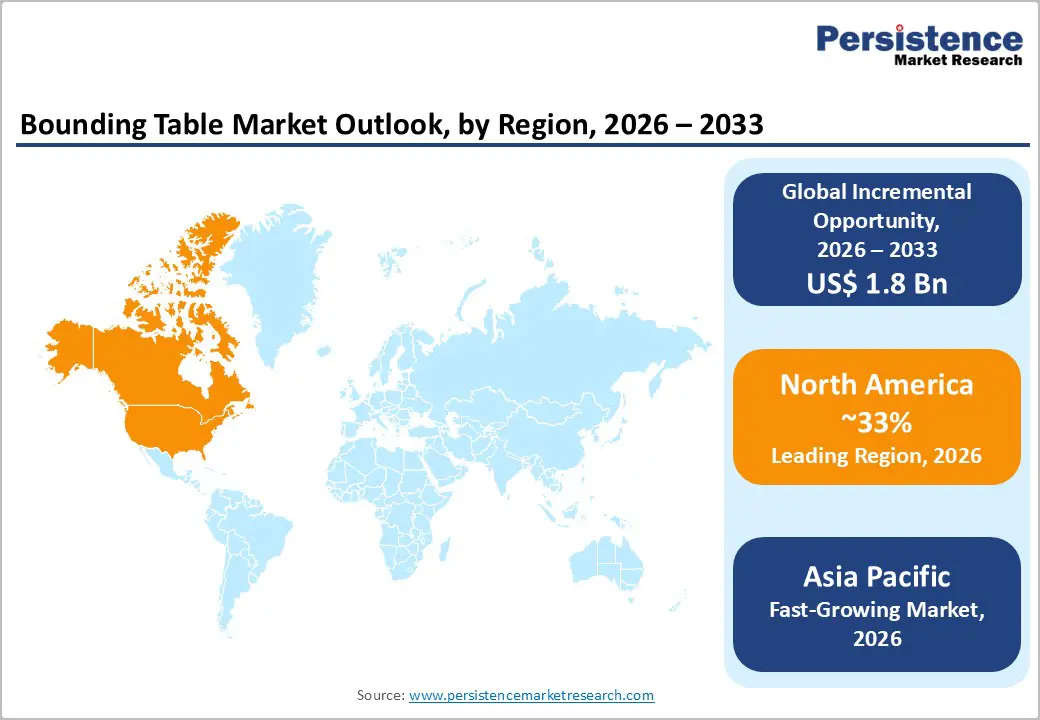
- Regional Leadership: North America is anticipated to hold around 33% market share in 2026, while the Asia Pacific market is projected to register the fastest growth at a CAGR of roughly 10.1% through 2033, fueled by commercial infrastructure expansion.
- Strategic Focus: Smart integration and Asia-focused geographic expansion remain central competitive priorities, contributing to sustained above-market growth rates across leading vendors.
| Key Insights | Details |
|---|---|
| Bounding Table Market Size (2026E) | US$ 2.1 Bn |
| Market Value Forecast (2033F) | US$ 3.9 Bn |
| Projected Growth (CAGR 2026 to 2033) | 9.2% |
| Historical Market Growth (CAGR 2020 to 2025) | 8.3% |
Market Factors – Growth, Barriers, and Opportunity Analysis
Commercial Infrastructure Expansion and Hybrid Workspace Transformation
According to the World Bank and OECD infrastructure investment outlooks (2024–2025 updates), global infrastructure spending is projected to exceed US$ 4 trillion annually by 2030, with commercial real estate modernization being a major component. Hybrid work adoption, reported by the International Labour Organization (ILO) as affecting over 23% of the global workforce in 2024, has accelerated demand for modular and adaptable furniture solutions, including bounding tables. In the U.S., Census Bureau construction spending data (2025) shows continued investment in office renovation and coworking facilities, reinforcing structured procurement demand.
Real estate trends in 2026 show commercial property strategies evolving to prioritize flexibility and experience, as firms reconfigure traditional offices into collaboration-centric environments to attract the workforce back to physical hubs. Enterprises are combining traditional leases with flexible workspace portfolios to improve resilience and employee engagement, reflecting deeper adoption of hybrid-led workspace strategies. This structural shift strengthens recurring demand and supports stable mid-term revenue growth across commercial segments.
Smart Technology Integration and Customization-Driven Value Enhancement
The International Data Corporation (IDC) estimates global IoT spending exceeded US$ 800 billion in 2024, with commercial buildings representing a high-growth vertical. Smart furniture integration, wireless charging, embedded connectivity, and sensor-based occupancy tracking, has enhanced bounding table functionality and increased enterprise adoption. The U.S. Department of Energy (DOE)’s 2025 smart building initiative further emphasizes connected infrastructure for energy optimization, reinforcing demand for integration-capable workspace systems.
Notably, workspace trends show a rapid shift toward intelligent workspaces that embed connectivity and analytics directly into furniture and office environments to support hybrid collaboration and occupancy insights. Industry reporting highlights how these digital workplace features, connected sensors, embedded power modules, and automated systems, are driving technology expectations in modern workspaces and influencing procurement decisions. According to urbanization data from the UN, nearly 56% of the global population currently resides in urban areas, further increase the demand for compact, multifunctional solutions. Vendors offering customizable, tech-enabled products capture higher-margin contracts and improve long-term profitability.
Raw Material Price Volatility and Global Supply Chain Exposure
The International Monetary Fund (IMF) 2025 commodity outlook identifies continued volatility in steel, aluminum, and engineered wood inputs. Between 2023 and 2025, steel prices fluctuated by more than 20% in several global markets, increasing production costs. Since bounding tables rely heavily on metal frames, composite boards, and precision components, this input instability directly heightens manufacturing risk. Cost unpredictability limits the ability of suppliers to maintain stable pricing structures, particularly for long-cycle commercial contracts.
Ongoing global shipping disruptions have compounded this challenge. A United Nations trade agency report noted major volatility in the shipping sector in 2025, driven by geopolitical tensions, new tariffs, and rerouted trade lanes that have dampened containerized trade growth and extended transit times. Freight rate unpredictability has squeezed logistics planning and elevated landed costs for imported components. These supply-chain stresses have contributed to rising transport and raw material costs into early 2026, forcing manufacturers to revise delivery schedules, expand inventory buffers, and absorb margin erosion.
Competitive Pressure from Low-Cost Imports and Margin Compression
Trade data from UN Comtrade indicates rising exports of low-cost furniture products from emerging Asian economies. Price-sensitive segments, especially B2C and entry-level commercial buyers, increasingly opt for commoditized alternatives. These imports typically compete on cost rather than durability or integration capability, eroding market share for domestic and mid-tier manufacturers focused on performance differentiation. As a result, premium and mid-tier manufacturers face increased pricing pressure in standardized product categories.
Global trade trends observed in early 2026 further highlight this competitive tension. Chinese furniture exporters have capitalized on delayed tariff hikes on imported furniture in the U.S., allowing increased shipments of ready-to-assemble and value-oriented products into key Western markets. This has provided short-term relief for import flows but intensified price competition, particularly for lower-tier products where differentiation is limited. Increased exposure to low-cost imports compresses margins and shifts buying behaviour toward price-led decisions, making it more difficult for smaller manufacturers to invest in product innovation and maintain sustainable EBIT levels.
Emerging Market Expansion and Localized Production Advantage
Asia Pacific urban expansion and infrastructure initiatives, such as India’s Smart Cities Mission and ASEAN commercial zone development, create strong addressable demand for modular furniture. Emerging markets currently represent approximately 32–35% of global demand and are projected to approach 40% by 2033, reflecting robust growth momentum. Urbanization continues apace, and governments are increasingly prioritizing modern commercial infrastructure to catalyze investment inflows. For example, India emerged as the leading commercial real estate market in Asia Pacific in 2025, driven by strong leasing sentiment, signaling increased demand for workspace solutions and fixtures.
Institutional investment momentum also supports infrastructure expansion: in 2025 and 2026, India’s real estate sector is projected to attract US$ 5–7 billion annually due to rising urbanization and business demand for premium office and mixed use facilities. High investment interest is matched by growing trade integration in Southeast Asia, where forums such as the ASEAN Tourism Forum 2026 emphasize regional economic integration and resilience, further supporting commercial infrastructure needs over the medium term. Localized manufacturing hubs reduce cost structures and enable faster delivery cycles, allowing vendors to better serve both government and education contracts while capturing recurring demand growth.
Sustainable Product Integration and Digital Channel Expansion
According to the International Energy Agency (IEA), buildings account for nearly 30% of global energy consumption, increasing the importance of sustainable materials and circular design in procurement policies. ESG and sustainability regulations are gaining legislative backing: the European Commission (EC)’s 2025–2030 Ecodesign Working Plan aims to promote recyclable, repairable, and energy efficient products, with furniture among the priority categories under new public procurement criteria. Additionally, Australia’s Environmentally Sustainable Procurement Policy mandates that furniture and equipment contracts above certain thresholds must meet environmental criteria, creating a clear demand signal for recycled and low impact products.
The digital channels continue to reshape market engagement. Global e commerce penetration reached around 22% of total retail sales in 2024 (UNCTAD), and digitization trends are strengthening online purchase behavior. E-commerce platforms and digital configurators allow customers to visualize bounding table customizations in real time, shortening decision cycles and improving conversion rates. Online sales growth is projected to contribute an incremental US$ 500–600 million in revenue by 2033, driven by consumer preference for digital discovery and personalization. This aligns with broader digital investment trends across Asia, where rising digital infrastructure and tech adoption support scalable online retail models.
Category-wise Analysis
Product Insights
The standard type-based product segment is slated to hold an estimated 38% of the bounding table market revenue share in 2026. This leadership reflects continued preference among large enterprises and institutional buyers for wellestablished, standardized furniture models that offer proven reliability and predictable performance. Type based tables remain favored in environments such as multinational offices, government facilities, and large training campuses where uniform specifications simplify procurement and installation logistics. In 2025, several Fortune 500 companies in the U.S. reported multi year framework agreements with office suppliers specifying standardized table configurations to support global office refurbishments, reinforcing this segment’s resilience.
In contrast, the integration capabilities segment is the fastest growing, projected to expand at a CAGR above 10% through 2033. The growth momentum stems from rising demand for smart, connected workspace components that support analytics, power delivery, and adaptive layouts. In 2026, a major technology park in Berlin integrated electrically adjustable bounding tables with embedded USB C and wireless charging systems into its campus redesign, marking one of Europe’s largest smart workplace implementations. These integration ready features are increasingly mandated in corporate RFPs seeking data driven space utilization insights and improved ergonomic support, enabling vendors to differentiate premium offerings and capture higher average selling prices.
End User Insights
The B2B segment is set to dominate in 2026, claiming more than 50% of the bounding table market share. Corporate buyers, including enterprises and shared workspace operators, drive demand through extensive procurement programs and scheduled modernization cycles. The hybrid work paradigm continues to reinforce bulk purchase patterns, as firms redesign collaborative zones and flexible meeting spaces. In early 2026, a leading conworking operator in Singapore completed a rollout of new bounding tables across 30 locations to enhance flexible workspace amenities, illustrating how commercial demand directly translates into high volume orders for manufacturers.
The vertical specific use cases segment is poised to grow the fastest at an approximate CAGR of 10% through 2033. Specialized environments such as design studios, vocational training centers, and modular educational labs require configurable furniture tailored to specific workflows. In 2025, a technical university in Japan introduced modular bounding tables in its engineering and robotics labs to support team based project work, marking a significant institutional purchase that emphasized flexibility and integration with power/data infrastructure. Such vertical deployments demonstrate that customized solutions, with specific performance levels and adaptability, are driving above average growth and higher recurring service revenue opportunities for suppliers.
Regional Insights
North America Bounding Table Market Trends
North America is expected to account for approximately 33% of the bounding table market value in 2026, with the United States clearly leading regional demand. U.S. commercial renovation activity remains a key driver, particularly in premium workspace segments where ergonomic and modular furniture specifications are increasingly prioritized. According to U.S. Census Bureau data (2025), renovation spending in office and institutional sectors remained resilient, underpinning recurring furniture replacement cycles. In 2025, New York City’s planning authority announced a major initiative to retrofit municipal buildings with energy-efficient interiors, including modern workspace infrastructure, expanding procurement opportunities for bounding table manufacturers.
Workplace tech investment is also shifting furniture requirements. In early 2026, the Toronto Regional Real Estate Board reported strong demand for office spaces with integrated workplace technology, signaling growing interest in smart furniture solutions among Canadian enterprises. ESG compliance and connectivity standards are becoming de facto requirements in commercial request for proposals (RFPs). Competitive dynamics show moderate consolidation, with leading suppliers capturing roughly 45% combined share through strategic partnerships and bundled service offerings. Demand remains concentrated among employers adopting hybrid work models and advanced workspace analytics.
Europe Bounding Tables Market Trends
Europe is likely to contribute roughly 25% of global demand in 2026, led by strong procurement activity in Germany, the U.K., France, and Spain. In 2025, the French government expanded public procurement guidelines to prioritize low-emission, recyclable office equipment, reinforcing the shift toward eco design compliance in commercial contracts. This policy change has buoyed demand for bounding tables built with sustainable materials, particularly in government facilities and healthcare institutions. Germany’s emphasis on high performance workspace solutions continues to attract corporate investments in hybrid office setups, supported by regulatory mandates for workplace accessibility.
In the U.K., London’s municipal authority announced in 2026 a series of office modernization grants tied to digital infrastructure enhancements, encouraging companies to adopt connectivity ready furniture that supports hybrid work practices. Circular economy and green building standards under the EU taxonomy are further influencing purchasing decisions, with buyers willing to pay premiums for compliant products. Urbanization and retrofit investments across Spain and Italy are similarly contributing to recurring procurement momentum. Smart furniture and modular systems are gaining prevalence as European enterprises incorporate data collection and space optimization features in office upgrades.
Asia Pacific Bounding Tables Market Trends
Asia Pacific is projected to be the fastest growing regional market for bounding tables between 2026 and 2033, with China, Japan, India, and ASEAN economies driving demand. In 2025, China’s Ministry of Commerce reported a surge in demand for office and commercial furniture tied to industrial park expansions, highlighting bounding table sales as part of interior outfitting contracts. India’s commercial real estate market also sustained momentum; in 2026 the Delhi Development Authority (DDA) announced plans to modernize government office interiors with flexible, modular workstations to support hybrid work policies, opening procurement channels for local and foreign suppliers.
ASEAN countries are likewise investing in urban redevelopment projects; in early 2026, Malaysia’s urban planning agency revealed plans for multiple “innovation districts” aimed at attracting tech investments, which include commercial fit out incentives that favor modern workplace infrastructure. Japan continues to set standards in technology adoption, with corporate offices in Tokyo and Osaka integrating connected work surfaces that support sensor data and power management. These developments, driven by urbanization, hybrid work adaptation, and infrastructure modernization, underline Asia Pacific’s robust market growth trajectory and position it as a key regional hotspot for bounding table demand.
Competitive Landscape
The global bounding table market structure is moderately consolidated, with leading players such as Steelcase, Herman Miller, Haworth, Teknion, and IKEA collectively accounting for over 45–50% of total market revenue in 2026. These established manufacturers leverage long-standing relationships with corporate, government, and institutional buyers, while offering comprehensive product portfolios spanning standardized, integration-capable, and premium modular solutions. They invest significantly in R&D to enhance smart integration features, ergonomic design, sustainability compliance, and digital configurator tools, maintaining leadership across both commercial and specialized segments.
The regional and niche competitors, including Kokuyo, Okamura, and local original equipment manufacturers (OEMs) in Asia Pacific, focus on vertical-specific applications, government contracts, and localized manufacturing advantages. High entry barriers such as design standardization, compliance with workplace regulations, and supply chain complexity limit new entrants. However, digitalization trends, including online configurators and D2C platforms, are enabling software-centric or smaller furniture startups to enter the market by offering customization, integrated workplace analytics, and subscription-based services. Market consolidation is expected to continue gradually as global leaders acquire smaller regional players, expand geographic reach, and collaborate on IoT-enabled and smart furniture solutions.
Key Industry Developments
- In October 2025, McGee & Co. launched its Entertaining Event Sale with around 20% off more than 200 dining furniture and décor items, offering curated pieces such as tables, chairs, linens, and serveware designed to elevate hosting spaces ahead of seasonal gatherings.
- In June 2025, designer Thom Fougere and 1x1 Architecture created large sculptural tables from fossil-rich Tyndall stone for the 2025 G7 Summit in Alberta, highlighting Canada’s geological heritage and craftsmanship through bespoke furniture installed in the leaders’ meeting spaces.
Companies Covered in Bounding Table Market
• Steelcase Inc.
• Herman Miller
• Haworth Inc.
• Okamura Corporation
• HNI Corporation
• Kinnarps AB
• Vitra International
• Teknion Corporation
• Global Furniture Group
• Bene GmbH
• Kimball International
• Godrej Interio
• Inter IKEA Systems
Frequently Asked Questions
The global bounding table market is projected to reach US$ 2.1 billion in 2026.
Growth is driven by hybrid workspace adoption, smart office integration, and modular furniture demand in commercial and government sectors.
The market is poised to witness a CAGR of 9.2% from 2026 to 2033.
Opportunities lie in emerging markets, ESG-compliant materials, and digital sales channels with integrated customization options.
Some of the key players in the market include Steelcase, Herman Miller, Haworth, Teknion, and IKEA.


