


- Agrochemicals
- Biomethane Market
Biomethane Market Size, Share, and Growth Forecast 2026 - 2033
Biomethane Market by Feedstock Type (Organic Household Waste, Animal Manure, Energy Crops, Agricultural Waste, Sewage Sludge, Industrial Food Processing Waste, Others), Production Process (Anaerobic Digestion, Gasification, Pyrolysis), Application (Heat Generation, Electricity Generation, Combined Heat & Power (CHP), Alternative Transport Fuel, Others), End Use (Industrial, Commercial, Residential), and Regional Analysis, 2026 - 2033
Biomethane Market Size and Trend Analysis
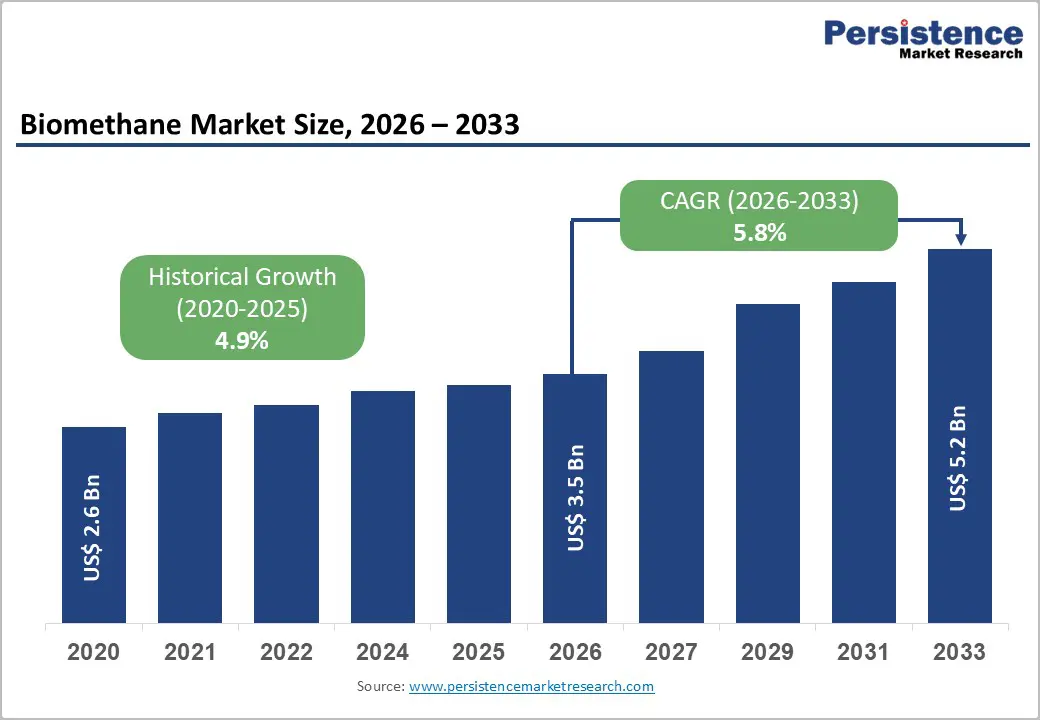
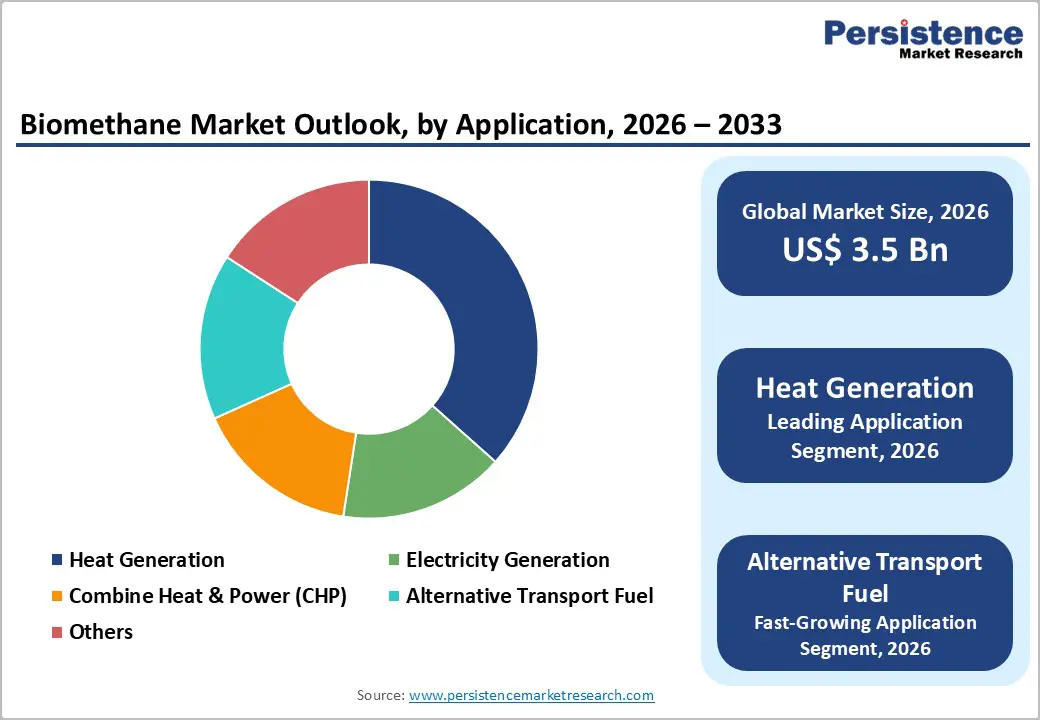
The global biomethane market size is expected to be valued at US$ 3.5 billion in 2026 and projected to reach US$ 5.2 billion by 2033, growing at a CAGR of 5.8% between 2026 and 2033.
This sustained growth is underpinned by escalating policy mandates for renewable natural gas, the rapid expansion of biogas upgrading infrastructure across Europe and North America, and intensifying corporate sustainability commitments driving demand for pipeline-quality biomethane. The European Union’s REPowerEU Plan, which targets 35 billion cubic meters (bcm) of domestically produced biomethane by 2030, and the U.S. Inflation Reduction Act (IRA) incentives for renewable natural gas projects collectively represent transformative demand catalysts that are reshaping investment dynamics across the entire biomethane value chain.
Key Industry Highlights:
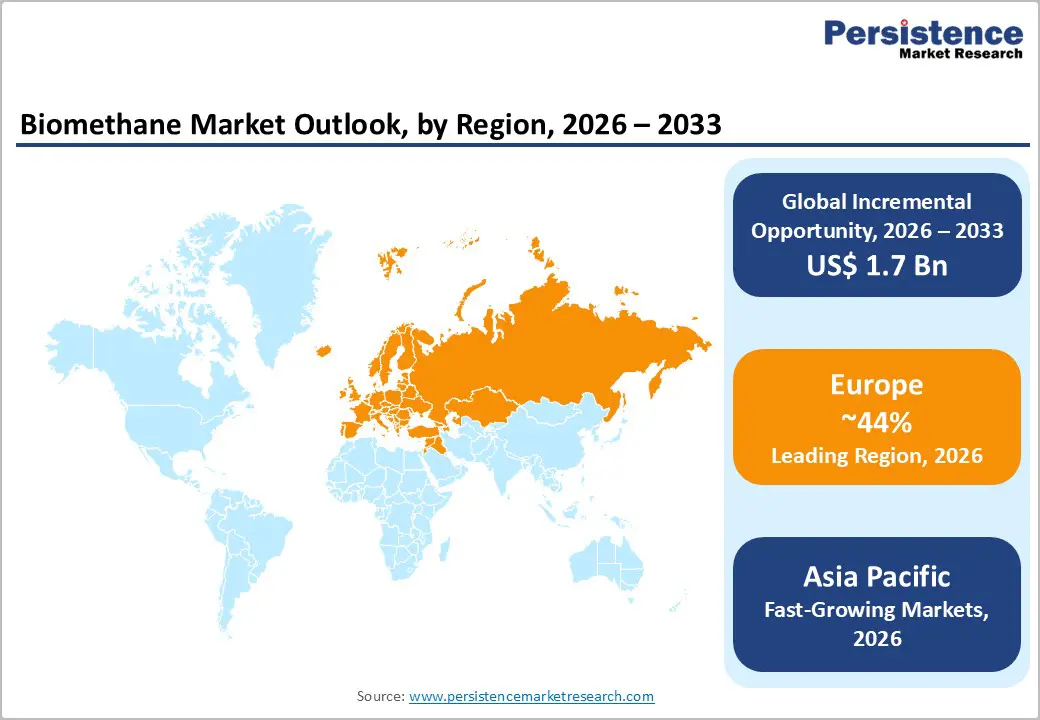
- Leading Region: Europe leads the global biomethane market with an estimated 44% share in 2025, anchored by Germany’s extensive grid injection network, the EU’s REPowerEU 35 bcm target, and advanced regulatory support under RED III.
- Fastest Growing Region: Asia Pacific is the fastest-growing region, driven by China’s 14th Five-Year Plan, India’s SATAT Scheme targeting 5,000 CBG plants, and rapidly expanding agricultural waste valorization programmes across ASEAN economies.
- Dominant Segment: Anaerobic digestion dominates production with approximately 76% market share in 2025, owing to mature technology, regulatory familiarity, and dual revenue streams from biomethane and digestate, with over 1,023 plants operational across Europe alone.
- Fastest Growing Segment: Alternative transport fuel is the fastest-growing application segment, propelled by the accelerating adoption of compressed and liquefied biomethane in heavy-duty road freight, supported by EU Alternative Fuels Infrastructure Regulation (AFIR) mandates for CBM refuelling networks.
- Key Opportunity: Key market opportunity lies in integrated agri-biomethane platforms combining feedstock procurement, AD-based upgrading, grid injection, and digestate commercialization, amplified by circular bioeconomy subsidies and bio-hydrogen co-production pathways targeting clean hydrogen demand exceeding 130 million tonnes/year by 2050.
| Key Insights | Details |
|---|---|
|
Biomethane Market Size (2026E) |
US$ 3.5 Billion |
|
Market Value Forecast (2033F) |
US$ 5.2 Billion |
|
Projected Growth CAGR (2026–2033) |
5.8% |
|
Historical Market Growth (2020–2025) |
4.9% |
Market Dynamics
Drivers - Stringent Renewable Energy Mandates and Decarbonization Policy Frameworks
Government-led decarbonization agendas are proving to be the most powerful accelerant for the biomethane market. The European Union’s Renewable Energy Directive (RED III), enacted in 2023, mandates that renewable gases, including biomethane, account for a significantly larger share of the energy mix by 2030, with member states obligated to set national binding targets. The REPowerEU Plan explicitly earmarks €37 billion for scaling biomethane production to 35 bcm/year by 2030, up from approximately 3.5 bcm in 2023, according to the European Biogas Association (EBA). Similarly, the U.S. Environmental Protection Agency’s (EPA) Renewable Fuel Standard (RFS) assigns D3 Renewable Identification Numbers (RINs) to cellulosic biomethane, providing producers with a financial premium of up to USD 3.00–3.50 per million British thermal units (MMBtu). These regulatory frameworks simultaneously guarantee long-term revenue visibility for producers and reduce investment risk for project financiers, creating a self-reinforcing growth cycle for the market.
Rising Demand for Carbon-Neutral Fuel Alternatives in Hard-to-Abate Sectors
Heavy industries such as steel manufacturing, cement production, and long-haul freight transport face significant challenges in direct electrification, making biomethane one of the most pragmatic near-term decarbonization options. According to the International Energy Agency (IEA), biomethane can displace conventional natural gas on a drop-in basis across existing pipeline and distribution infrastructure, eliminating the need for costly retrofits. The global heavy-duty trucking sector, which consumed approximately 300 million tonnes of diesel equivalent in 2022, is increasingly adopting compressed biomethane (CBM) and liquefied biomethane (LBM) as alternative fuels, with the International Gas Union (IGU) documenting a 38% year-on-year increase in biomethane-fuelled heavy goods vehicles registered in Europe between 2022 and 2023. This demand from transportation and industrial decarbonization pathways substantially broadens the market’s end-user base beyond traditional heating applications, supporting long-run revenue diversification and market resilience.
Restraints - High Capital Expenditure and Operational Complexity of Upgrading Facilities
The commercialization of biomethane remains constrained by the substantial capital expenditure required for biogas upgrading infrastructure. According to the World Biogas Association (WBA), the installed cost of pressure swing adsorption (PSA) or membrane separation upgrading systems for a medium-scale facility (500–1,000 Nm³/hour) typically ranges from €1.5 million to €4.5 million, excluding feedstock logistics and grid injection equipment. Smaller agricultural cooperatives and municipal waste operators, who collectively represent the majority of potential biomethane producers, frequently cannot access project finance at commercially viable terms due to limited balance sheet capacity and off-take contract uncertainty. These structural financing barriers disproportionately suppress production in emerging markets, where regulatory frameworks and gas grid penetration rates remain insufficient to underwrite long-term project viability.
Feedstock Supply Inconsistency and Logistics Challenges
The intermittent and geographically dispersed nature of biomethane feedstocks, including organic household waste, agricultural residues, and animal manure, creates significant supply chain reliability risks. The European Commission’s Joint Research Centre (JRC) has estimated that up to 30% of identified biomethane feedstock potential in the EU remains inaccessible due to inadequate collection infrastructure, land-use competition, and seasonal variability in crop yields. Transportation of wet feedstocks over distances exceeding 50–80 km substantially erodes the net energy and economic yield of anaerobic digestion projects, limiting viable plant locations to areas with high feedstock density. These logistical constraints increase operational costs and reduce plant load factors, negatively impacting the levelized cost of biomethane (LCOB) and undermining project financial models, particularly in rural regions of developing economies.
Opportunities - Expansion of Biomethane-to-Hydrogen (BtH) and Power-to-Gas Pathways
The convergence of the biomethane and green hydrogen agendas is generating a significant new opportunity for market participants. Biomethane can be reformed into bio-hydrogen through steam methane reforming (SMR) with carbon capture, producing a low-carbon hydrogen stream that qualifies under the EU Hydrogen Strategy and the U.S. Department of Energy’s (DOE) Hydrogen Earthshot initiative. According to the Hydrogen Council, demand for clean hydrogen is projected to reach 130 million tonnes per year by 2050, and biomethane-derived hydrogen offers a cost-competitive production pathway given existing gas infrastructure. Companies investing in modular bio-hydrogen production facilities adjacent to existing anaerobic digestion plants are positioning themselves at the intersection of two high-growth decarbonization markets. Furthermore, power-to-gas projects that store surplus renewable electricity as synthetic methane can be co-optimized with biomethane injection infrastructure, creating integrated asset models that enhance grid flexibility and revenue stacking potential.
Unlocking Agricultural Waste Valorization Through Circular Economy Frameworks
Agricultural waste, including animal manure, crop residues, and agro-industrial by-products, represents one of the largest underutilized biomethane feedstock pools globally. The Food and Agriculture Organization (FAO) estimates that livestock manure alone could theoretically yield over 600 bcm of biogas annually at global scale, with a significant fraction upgradeable to biomethane. National circular bioeconomy policies, such as the European Commission’s Bioeconomy Strategy and India’s National Bioenergy Programme (Phase-II), are establishing financial incentives, including capital subsidies of up to 40–60% of project costs, to mobilize this latent feedstock potential. For biomethane producers, integrating digestate management (a nutrient-rich by-product of anaerobic digestion) into fertilizer replacement value chains further improves project economics by generating an additional revenue stream. Companies that build integrated agri-biomethane platforms, combining feedstock procurement, biogas upgrading, grid injection, and digestate commercialization, are best positioned to capture the full economic value embedded in agricultural waste valorization.
Category-wise Analysis
Feedstock Type Insights
Organic household waste is the leading feedstock segment in the global biomethane market, commanding an estimated market share of approximately 32% in 2025, driven by strong municipal policy mandates and the widespread availability of organic fractions of municipal solid waste (OFMSW) in densely populated urban centres. The European Environment Agency (EEA) reports that the EU-27 generated approximately 80 million tonnes of biowaste in 2022, of which only around 50% was subject to separate collection and biological treatment, indicating substantial untapped feedstock potential. Municipalities across Germany, France, Italy, and the Netherlands have implemented mandatory biowaste segregation laws, significantly increasing the volume of feedstock available to urban anaerobic digestion plants. The predictability of feedstock supply from controlled municipal collection systems also reduces operational risk compared to agricultural feedstocks, making organic household waste the preferred input for large-scale, grid-connected biomethane projects. Meanwhile, energy crops represent the fastest-growing feedstock segment, propelled by dedicated cultivation programmes in Central and Eastern Europe.
Production Process Insights
Anaerobic digestion (AD) dominates the biomethane production process landscape with an estimated market share of approximately 76% in 2025, benefiting from decades of technological maturation, established regulatory pathways, and widespread deployment across Europe and North America. The European Biogas Association (EBA) documented ~1,023 biomethane plants operating across Europe in 2023, the vast majority of which utilize wet or dry AD systems to process a range of organic feedstocks. AD technology benefits from a relatively low operating temperature (35–55°C), compatibility with diverse feedstock blends, and the dual value stream of producing both pipeline-quality biomethane and nutrient-rich digestate. Equipment costs for AD-based upgrading systems have declined by approximately 15–20% over the past decade as the supplier ecosystem has matured, further entrenching AD’s dominant position. Gasification represents the fastest-growing production process, with thermochemical conversion attracting growing interest for processing woody biomass and dry lignocellulosic residues that are unsuitable for AD, supported by pilot-to-commercial scale projects by companies such as Waga Energy.
Application Insights
Heat generation represents the leading application segment in the global biomethane market, accounting for an estimated 34% share in 2025, reflecting biomethane’s direct compatibility with existing natural gas distribution grids and residential and industrial heating appliances. Grid injection of biomethane, enabling delivery to end consumers via established gas network infrastructure, remains the most economically efficient distribution mechanism, as documented by the International Gas Union (IGU) in its 2023 Biomethane Report. In Europe, where gas-fired district heating networks serve millions of buildings, biomethane provides a renewable drop-in replacement for fossil natural gas without requiring infrastructure upgrades, significantly lowering the transition cost for utilities and heat suppliers. The UK’s Green Gas Support Scheme (GGSS), launched in 2021, specifically incentivizes biomethane grid injection for heat decarbonization purposes, with tariffs of up to £0.074/kWh available to eligible producers. Alternative transport fuel is the fastest-growing application, driven by accelerating adoption of compressed and liquefied biomethane in heavy-duty road transport.
End-user Insights
The industrial end-use segment leads the global biomethane market with an estimated share of approximately 46% in 2025, underpinned by growing corporate sustainability commitments, high thermal energy intensity in manufacturing processes, and the cost competitiveness of biomethane relative to alternative low-carbon fuels such as green hydrogen for near-term decarbonization. Industries including food & beverage processing, chemicals, pulp & paper, and ceramics have emerged as priority off-takers for biomethane supply contracts, with several large corporations, including Unilever, Nestlé, and BASF, publicly disclosing biomethane procurement as a component of their Scope 1 and Scope 2 emissions reduction strategies. The World Biogas Association (WBA) notes that industrial off-take agreements with durations of 10–15 years are increasingly underpinning project finance structures for large-scale biomethane plants, reducing revenue risk and improving debt serviceability. The commercial end-use sector is the fastest-growing, with hospitality, healthcare, and retail sectors increasingly sourcing certified biomethane for green credentials.
Regional Insights
North America Biomethane Market Trends and Insights
The North American biomethane market is experiencing a significant structural transformation, primarily driven by the United States, which accounts for the majority of regional production capacity. The U.S. Inflation Reduction Act (IRA, 2022) introduced a production tax credit of up to USD 1.00 per kilogram for qualifying clean fuels, alongside enhanced investment tax credits for biogas upgrading infrastructure, catalysing a wave of new project announcements. The U.S. Environmental Protection Agency (EPA) recorded over 2,200 operational landfill gas and biogas projects in 2023, with renewable natural gas (RNG) production exceeding 500 million MMBtu annually, a figure projected to grow substantially as more projects enter commissioning. Kinder Morgan and Archea Energy (acquired by bp) are among the most active developers scaling landfill-gas-to-RNG infrastructure across the U.S.
Canada is emerging as a secondary growth pole, with the Canadian Biogas Association estimating a potential biomethane production capacity of 98 PJ/year from existing organic waste streams. Provincial clean fuel standards in British Columbia and Ontario are providing additional market incentives, establishing a regulatory architecture broadly analogous to the U.S. Renewable Fuel Standard in terms of its price support mechanisms for biomethane producers.
Europe Biomethane Market Trends and Insights
Europe remains the global leader in biomethane production, holding an estimated 44% of global market share in 2025, with Germany, Denmark, France, and the United Kingdom collectively accounting for the majority of installed production capacity. Germany operates the largest biomethane grid injection network in the world, with over 240 upgrading plants connected to the national gas grid according to the German Biogas Association (Fachverband Biogas). The REPowerEU biomethane target of 35 bcm by 2030 has prompted individual member states to accelerate national biomethane action plans, with France targeting 24 TWh of biomethane injection by 2028 under its Programmation Pluriannuelle de l’Énergie (PPE).
Nature Energy Biogas A/S in Denmark and Gasum in Finland exemplify the Nordic model of large-scale, centralized biomethane production integrated with agricultural waste management. The UK’s Green Gas Support Scheme has attracted over 100 new biomethane plant applications since its launch, with Future Biogas Ltd. and E.ON SE among the leading operators expanding capacity. Spain is rapidly emerging as a high-growth market following its National Biogas and Biomethane Roadmap, which targets 10.4 bcm of biomethane production by 2030, reinforcing Europe’s dominant regional position.
Asia Pacific Biomethane Market Trends and Insights
Asia Pacific represents the fastest-growing regional market for biomethane, supported by enormous agricultural waste generation volumes, rising energy security concerns, and expanding national bioenergy policy frameworks across China, India, and Southeast Asia. China has identified biogas as a strategic component of its 14th Five-Year Plan for Renewable Energy (2021–2025), with the National Development and Reform Commission (NDRC) targeting the construction of ~1,000 large-scale biogas projects capable of producing pipeline-quality gas by 2025. The country’s livestock sector, the world’s largest, generates an estimated 3.8 billion tonnes of animal manure annually, representing an immense feedstock base for future biomethane production scale-up.
India is advancing its National Bioenergy Programme (Phase-II), which allocates INR 858 crore in central financial assistance specifically for biogas and compressed biogas (CBG) projects, with the SATAT (Sustainable Alternative Towards Affordable Transportation) Scheme targeting ~5,000 CBG plants across the country. In Japan, the Ministry of Economy, Trade and Industry (METI) has included biomethane in its Green Growth Strategy, supporting R&D investment in advanced gasification technologies. ASEAN nations, particularly Thailand and Vietnam, are integrating biomethane into their nationally determined contributions (NDCs) under the Paris Agreement, positioning Asia Pacific as the most dynamic growth frontier for biomethane investment over the 2026–2033 forecast horizon.
Competitive Landscape
The global biomethane market demonstrates a moderately fragmented structure, characterized by the presence of integrated energy conglomerates alongside specialized renewable gas developers operating at regional and national levels. Competition is shaped by access to feedstock, grid connectivity agreements, upgrading technology capabilities, and long-term offtake contracts with utilities and industrial end users. Market participants are increasingly adopting vertically integrated business models, covering feedstock aggregation, anaerobic digestion plant development, biogas upgrading, grid injection, and renewable gas trading, to enhance margin capture and operational control across the value chain.
Since 2022, consolidation has accelerated as larger energy companies acquire operational biomethane assets and project pipelines to secure renewable gas supply portfolios and meet decarbonization mandates. Strategic partnerships with agricultural cooperatives and municipal waste operators are also expanding. Innovation priorities include high-efficiency membrane and PSA upgrading systems, digital monitoring platforms for plant optimization, and integration with carbon capture solutions to enable negative-emission renewable gas production, strengthening long-term competitiveness.
Key Developments:
- In February 2026: Envitec Biogas launched its first Envithan gas upgrading plant in Lithuania, enhancing biomethane production capacity with advanced biogas purification technology to support renewable gas markets.
- In January 2026: Acorn Bioenergy, part of Qualitas Energy’s UK renewables platform, launched its first biomethane facility to expand renewable gas production and support decarbonization goals across energy and industrial sectors.
- In April 2025: Sojitz Corporation entered India’s biomethane production and sales business by investing in a joint venture with GPS Renewables and Indian Oil Corporation to develop 30 biomethane plants producing 160,000 tons annually.
Companies Covered in Biomethane Market
- Air Liquide
- Engie
- Nature Energy Biogas A/S
- Gasum
- Terega Solutions
- Waga Energy
- TotalEnergies
- Chevron
- Kinder Morgan
- Archea Energy (acquired by bp)
- Envitec Biogas AG
- Future Biogas Ltd.
- E.ON SE
- Verbio Vereinigte Bioenergie AG
- South Hills RNG
- Shell Energy
- bp (via Archea Energy)
- SoCalGas (Southern California Gas Company)
- Renewi
- Ceres Energy
- Acorn Bioenergy
- Sojitz Corporation
Frequently Asked Questions
The global biomethane market is estimated to reach US$ 3.5 billion in 2026, driven by supportive policies and growing renewable natural gas demand.
Growth is driven by renewable energy mandates, carbon-neutral fuel demand, and financial incentives such as RINs, subsidies, and capital grants.
Europe leads the market with around 44% share, supported by strong policy frameworks and large-scale biomethane plant deployments.
The key opportunity lies in biomethane-based low-carbon hydrogen production and integrated circular agri-biomethane platforms.
Major players include Air Liquide, Engie, TotalEnergies, Gasum, Nature Energy, Waga Energy, Envitec, E.ON, Verbio, Chevron, and others.


