


- Executive Summary
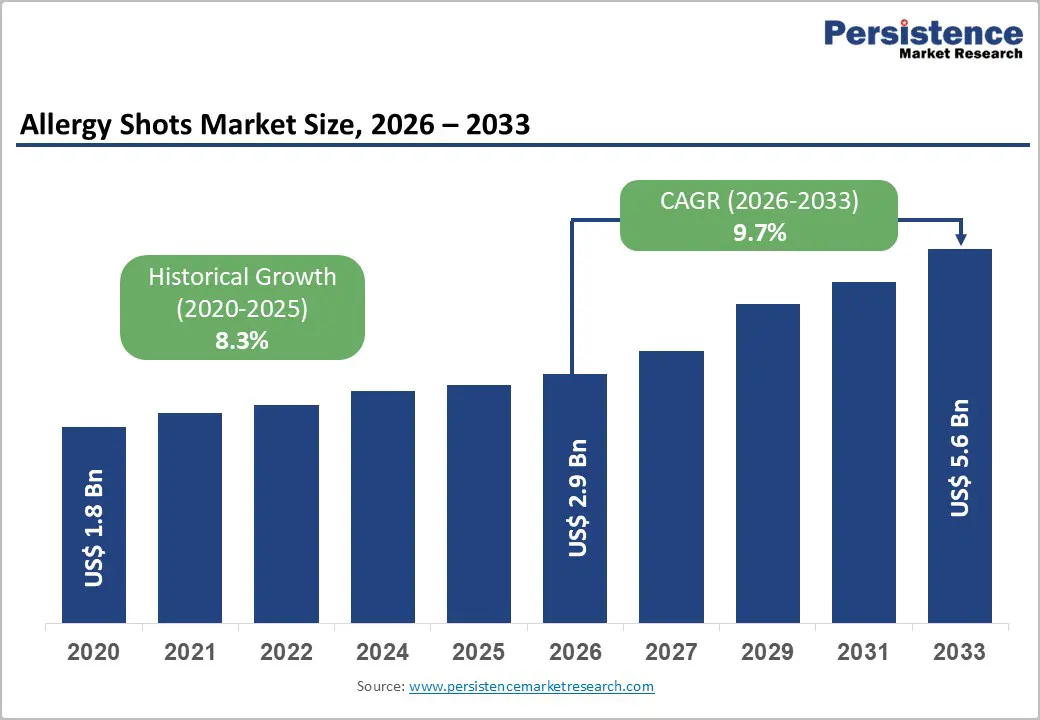
- Global Allergy Shots Market Snapshot 2026 and 2033
- Market Opportunity Assessment, 2026-2033, US$ Bn
- Key Market Trends
- Industry Developments and Key Market Events
- Demand Side and Supply Side Analysis
- PMR Analysis and Recommendations
- Market Overview
- Market Scope and Definitions
- Market Dynamics
- Driver
- Restraint
- Opportunities
- Trends
- Macro-Economic Factors
- Global GDP Outlook
- Global Healthcare Expenditure
- Forecast Factors – Relevance and Impact
- COVID-19 Impact Assessment
- Value Added Insights
- Value Chain analysis
- Key Market Players
- Product Adoption Analysis
- Key Promotional Strategies by key players
- PESTLE Analysis
- Porter's Five Forces Analysis
- Regulatory and Technology Landscape
- Global Allergy Shots Market Outlook: Historical (2020 – 2025) and Forecast (2026 – 2033)
- Key Highlights
- Global Allergy Shots Market Outlook: Product
- Introduction/Key Findings
- Historical Market Size (US$ Bn) Analysis by Product, 2020-2025
- Current Market Size (US$ Bn) Forecast, by Product, 2026-2033
- SLIT Tablets
- Odactra
- Grastek
- Ragwitek
- Oralair
- Actair
- Others
- Oral
- Palforzia
- Others
- Injections
- Others
- High-Temperature NiMH Batteries
- SLIT Tablets
- Market Attractiveness Analysis: Product
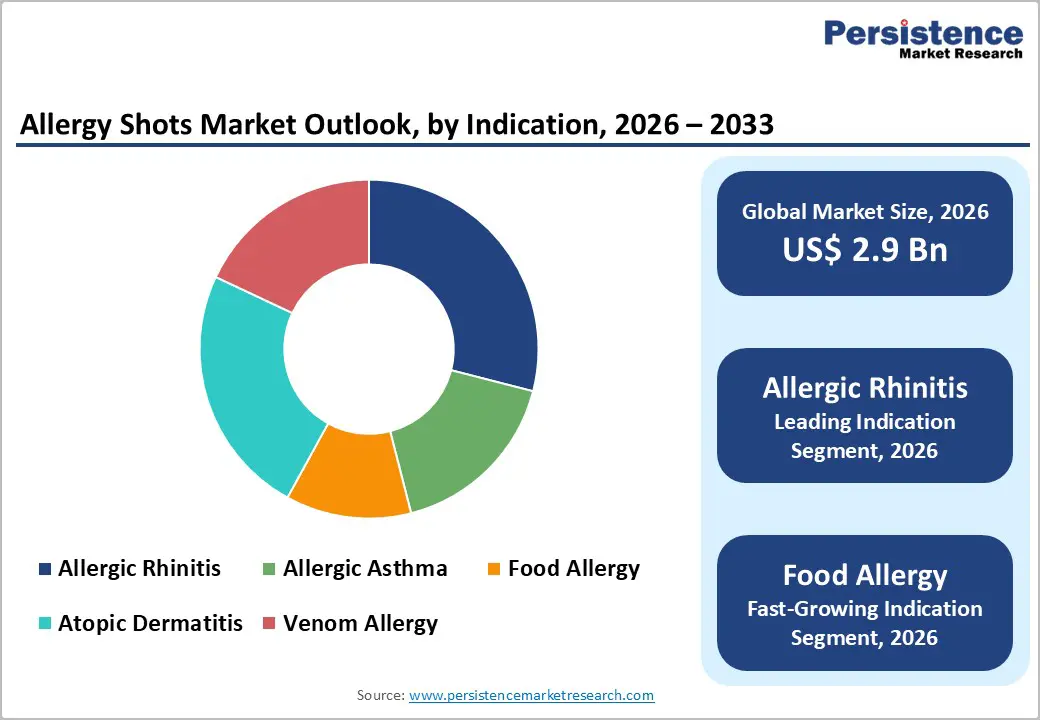
- Global Allergy Shots Market Outlook: Indication
- Introduction/Key Findings
- Historical Market Size (US$ Bn) Analysis by Indication, 2020-2025
- Current Market Size (US$ Bn) Forecast, by Indication, 2026-2033
- Allergic Rhinitis
- Allergic Asthma
- Food Allergy
- Atopic Dermatitis
- Venom Allergy
- Market Attractiveness Analysis: Indication
- Global Allergy Shots Market Outlook: Allergen
- Introduction/Key Findings
- Historical Market Size (US$ Bn) Analysis by Allergen, 2020-2025
- Current Market Size (US$ Bn) Forecast, by Allergen, 2026-2033
- Pollen
- House Dust Mites
- Mold
- Animal Dander
- Insect Venom
- Market Attractiveness Analysis: Allergen
- Global Allergy Shots Market Outlook: Distribution Channel
- Introduction/Key Findings
- Historical Market Size (US$ Bn) Analysis by Distribution Channel, 2020-2025
- Current Market Size (US$ Bn) Forecast, by Distribution Channel, 2026-2033
- Institutional Sales
- Retail Sales
- Others
- Market Attractiveness Analysis: Distribution Channel
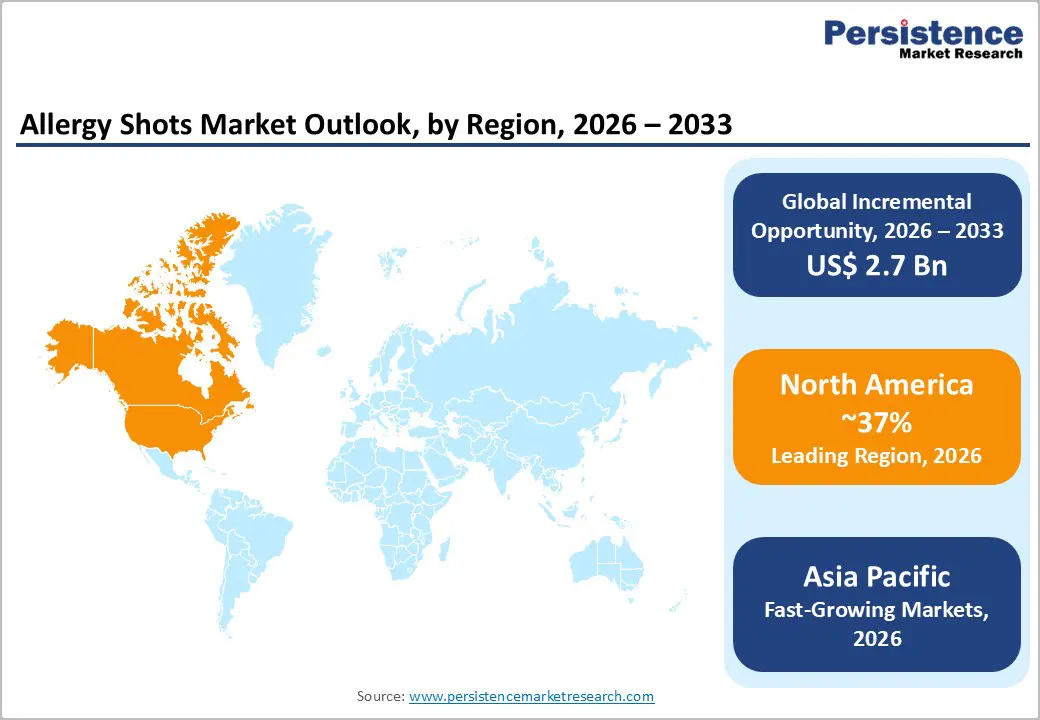
- Global Allergy Shots Market Outlook: Region
- Key Highlights
- Historical Market Size (US$ Bn) Analysis by Region, 2020-2025
- Current Market Size (US$ Bn) Forecast, by Region, 2026-2033
- North America
- Europe
- East Asia
- South Asia & Oceania
- Latin America
- Middle East & Africa
- Market Attractiveness Analysis: Region
- North America Allergy Shots Market Outlook: Historical (2020 – 2025) and Forecast (2026 – 2033)
- Key Highlights
- North America Market Size (US$ Bn) Forecast, by Country, 2026-2033
- U.S.
- Canada
- North America Market Size (US$ Bn) Forecast, by Product, 2026-2033
- SLIT Tablets
- Odactra
- Grastek
- Ragwitek
- Oralair
- Actair
- Others
- Oral
- Palforzia
- Others
- Injections
- Others
- High-Temperature NiMH Batteries
- SLIT Tablets
- North America Market Size (US$ Bn) Forecast, by Indication, 2026-2033
- Allergic Rhinitis
- Allergic Asthma
- Food Allergy
- Atopic Dermatitis
- Venom Allergy
- North America Market Size (US$ Bn) Forecast, by Allergen, 2026-2033
- Pollen
- House Dust Mites
- Mold
- Animal Dander
- Insect Venom
- North America Market Size (US$ Bn) Forecast, by Distribution Channel, 2026-2033
- Institutional Sales
- Retail Sales
- Others
- Europe Allergy Shots Market Outlook: Historical (2020 – 2025) and Forecast (2026 – 2033)
- Key Highlights
- Europe Market Size (US$ Bn) Forecast, by Country, 2026-2033
- Germany
- Italy
- France
- U.K.
- Spain
- Russia
- Rest of Europe
- Europe Market Size (US$ Bn) Forecast, by Product, 2026-2033
- SLIT Tablets
- Odactra
- Grastek
- Ragwitek
- Oralair
- Actair
- Others
- Oral
- Palforzia
- Others
- Injections
- Others
- High-Temperature NiMH Batteries
- SLIT Tablets
- Europe Market Size (US$ Bn) Forecast, by Indication, 2026-2033
- Allergic Rhinitis
- Allergic Asthma
- Food Allergy
- Atopic Dermatitis
- Venom Allergy
- Europe Market Size (US$ Bn) Forecast, by Allergen, 2026-2033
- Pollen
- House Dust Mites
- Mold
- Animal Dander
- Insect Venom
- Europe Market Size (US$ Bn) Forecast, by Distribution Channel, 2026-2033
- Institutional Sales
- Retail Sales
- Others
- East Asia Allergy Shots Market Outlook: Historical (2020 – 2025) and Forecast (2026 – 2033)
- Key Highlights
- East Asia Market Size (US$ Bn) Forecast, by Country, 2026-2033
- China
- Japan
- South Korea
- East Asia Market Size (US$ Bn) Forecast, by Product, 2026-2033
- SLIT Tablets
- Odactra
- Grastek
- Ragwitek
- Oralair
- Actair
- Others
- Oral
- Palforzia
- Others
- Injections
- Others
- High-Temperature NiMH Batteries
- SLIT Tablets
- East Asia Market Size (US$ Bn) Forecast, by Indication, 2026-2033
- Allergic Rhinitis
- Allergic Asthma
- Food Allergy
- Atopic Dermatitis
- Venom Allergy
- East Asia Market Size (US$ Bn) Forecast, by Allergen, 2026-2033
- Pollen
- House Dust Mites
- Mold
- Animal Dander
- Insect Venom
- East Asia Market Size (US$ Bn) Forecast, by Distribution Channel, 2026-2033
- Institutional Sales
- Retail Sales
- Others
- South Asia & Oceania Allergy Shots Market Outlook: Historical (2020 – 2025) and Forecast (2026 – 2033)
- Key Highlights
- South Asia & Oceania Market Size (US$ Bn) Forecast, by Country, 2026-2033
- India
- Southeast Asia
- ANZ
- Rest of SAO
- South Asia & Oceania Market Size (US$ Bn) Forecast, by Product, 2026-2033
- SLIT Tablets
- Odactra
- Grastek
- Ragwitek
- Oralair
- Actair
- Others
- Oral
- Palforzia
- Others
- Injections
- Others
- High-Temperature NiMH Batteries
- SLIT Tablets
- South Asia & Oceania Market Size (US$ Bn) Forecast, by Indication, 2026-2033
- Allergic Rhinitis
- Allergic Asthma
- Food Allergy
- Atopic Dermatitis
- Venom Allergy
- South Asia & Oceania Market Size (US$ Bn) Forecast, by Allergen, 2026-2033
- Pollen
- House Dust Mites
- Mold
- Animal Dander
- Insect Venom
- South Asia & Oceania Market Size (US$ Bn) Forecast, by Distribution Channel, 2026-2033
- Institutional Sales
- Retail Sales
- Others
- Latin America Allergy Shots Market Outlook: Historical (2020 – 2025) and Forecast (2026 – 2033)
- Key Highlights
- Latin America Market Size (US$ Bn) Forecast, by Country, 2026-2033
- Brazil
- Mexico
- Rest of LATAM
- Latin America Market Size (US$ Bn) Forecast, by Product, 2026-2033
- SLIT Tablets
- Odactra
- Grastek
- Ragwitek
- Oralair
- Actair
- Others
- Oral
- Palforzia
- Others
- Injections
- Others
- High-Temperature NiMH Batteries
- SLIT Tablets
- Latin America Market Size (US$ Bn) Forecast, by Indication, 2026-2033
- Allergic Rhinitis
- Allergic Asthma
- Food Allergy
- Atopic Dermatitis
- Venom Allergy
- Latin America Market Size (US$ Bn) Forecast, by Allergen, 2026-2033
- Pollen
- House Dust Mites
- Mold
- Animal Dander
- Insect Venom
- Latin America Market Size (US$ Bn) Forecast, by Distribution Channel, 2026-2033
- Institutional Sales
- Retail Sales
- Others
- Middle East & Africa Allergy Shots Market Outlook: Historical (2020 – 2025) and Forecast (2026 – 2033)
- Key Highlights
- Middle East & Africa Market Size (US$ Bn) Forecast, by Country, 2026-2033
- GCC Countries
- South Africa
- Northern Africa
- Rest of MEA
- Middle East & Africa Market Size (US$ Bn) Forecast, by Product, 2026-2033
- SLIT Tablets
- Odactra
- Grastek
- Ragwitek
- Oralair
- Actair
- Others
- Oral
- Palforzia
- Others
- Injections
- Others
- High-Temperature NiMH Batteries
- SLIT Tablets
- Middle East & Africa Market Size (US$ Bn) Forecast, by Indication, 2026-2033
- Allergic Rhinitis
- Allergic Asthma
- Food Allergy
- Atopic Dermatitis
- Venom Allergy
- Middle East & Africa Market Size (US$ Bn) Forecast, by Allergen, 2026-2033
- Pollen
- House Dust Mites
- Mold
- Animal Dander
- Insect Venom
- Middle East & Africa Market Size (US$ Bn) Forecast, by Distribution Channel, 2026-2033
- Institutional Sales
- Retail Sales
- Others
- Competition Landscape
- Market Share Analysis, 2025
- Market Structure
- Competition Intensity Mapping
- Competition Dashboard
- Company Profiles
- ALK Abello
- Company Overview
- Product Portfolio/Offerings
- Key Financials
- SWOT Analysis
- Company Strategy and Key Developments
- Stallergenes Greer
- Allergy Therapeutics
- Aimmune Therapeutics
- Anergis
- Arrayit Corporation
- Biomay AG
- HAL Allergy Group
- DBV Technologies
- ALK Abello
- Appendix
- Research Methodology
- Research Assumptions
- Acronyms and Abbreviations

Loading page data
Please wait a moment


