


- Executive Summary
- Global Processed Potato Products Market Snapshot, 2025 and 2032
- Market Opportunity Assessment, 2025 - 2032, US$ Mn
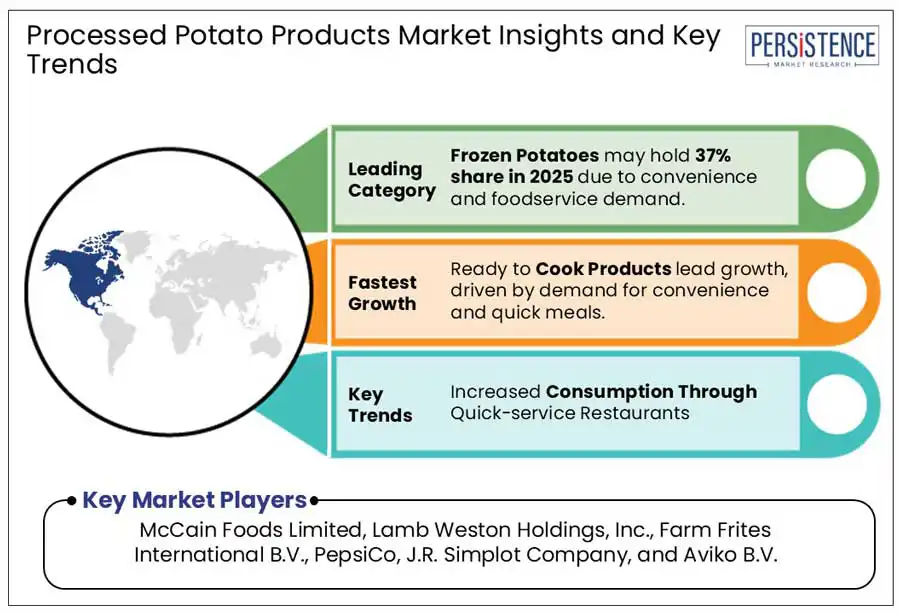
- Key Market Trends
- Future Market Projections
- Premium Market Insights
- Industry Developments and Key Market Events
- PMR Analysis and Recommendations
- Market Overview
- Market Scope and Definition
- Market Dynamics
- Drivers
- Restraints
- Opportunity
- Challenges
- Key Trends
- Macro-Economic Factors
- Global Sectorial Outlook
- Global GDP Growth Outlook
- COVID-19 Impact Analysis
- Forecast Factors - Relevance and Impact
- Value Added Insights
- Product Adoption Analysis
- Product USPs/Features
- Factors Impacting Consumer Buying Preference and Their Relevance
- Regulatory Landscape
- Value Chain Analysis
- Key Deals and Mergers
- PESTLE Analysis
- Porter’s Five Force Analysis
- Price Trend Analysis, 2019 - 2032
- Key Highlights
- Key Factors Impacting Product Prices
- Pricing Analysis, By Type
- Regional Prices and Product Preferences
- Global Processed Potato Products Market Outlook:
- Key Highlights
- Market Volume (MT) Projections
- Market Size (US$ Mn) and Y-o-Y Growth
- Absolute $ Opportunity
- Market Size (US$ Mn) Analysis and Forecast
- Historical Market Size (US$ Mn) Analysis, 2019-2023
- Current Market Size (US$ Mn) Analysis and Forecast, 2024-2032
- Global Processed Potato Products Market Outlook: Type
- Introduction / Key Findings
- Historical Market Size (US$ Mn) and Volume (MT) Analysis, By Type, 2019-2023
- Current Market Size (US$ Mn) and Volume (MT) Analysis and Forecast, By Type, 2024-2032
- Potato Chips
- Dehydrated Potato
- Frozen Potatoes
- Canned Potatoes
- Others
- Market Attractiveness Analysis: Type
- Global Processed Potato Products Market Outlook: Application
- Introduction / Key Findings
- Historical Market Size (US$ Mn) Analysis, By Application, 2019-2023
- Current Market Size (US$ Mn) Analysis and Forecast, By Application, 2024-2032
- Ready to Cook Products
- Snacks
- Others
- Market Attractiveness Analysis: Application
- Global Processed Potato Products Market Outlook: Distribution Channel
- Introduction / Key Findings
- Historical Market Size (US$ Mn) Analysis, By Distribution Channel, 2019-2023
- Current Market Size (US$ Mn) Analysis and Forecast, By Distribution Channel, 2024-2032
- Retail
- Food Service
- Market Attractiveness Analysis: Distribution Channel
- Key Highlights
- Global Processed Potato Products Market Outlook: Region
- Key Highlights
- Historical Market Size (US$ Mn) and Volume (MT) Analysis, By Region, 2019-2023
- Current Market Size (US$ Mn) and Volume (MT) Analysis and Forecast, By Region, 2024-2032
- North America
- Europe
- East Asia
- South Asia and Oceania
- Latin America
- Middle East & Africa
- Market Attractiveness Analysis: Region
- North America Processed Potato Products Market Outlook:
- Key Highlights
- Historical Market Size (US$ Mn) and Volume (MT) Analysis, By Market, 2019-2023
- By Country
- By Type
- By Application
- By Distribution Channel
- Current Market Size (US$ Mn) Analysis and Forecast, By Country, 2024-2032
- U.S.
- Canada
- Current Market Size (US$ Mn) and Volume (MT) Analysis and Forecast, By Type, 2024-2032
- Potato Chips
- Dehydrated Potato
- Frozen Potatoes
- Canned Potatoes
- Others
- Current Market Size (US$ Mn) Analysis and Forecast, By Application, 2024-2032
- Ready to Cook Products
- Snacks
- Others
- Current Market Size (US$ Mn) Analysis and Forecast, By Distribution Channel, 2024-2032
- Retail
- Food Service
- Market Attractiveness Analysis
- Europe Processed Potato Products Market Outlook:
- Key Highlights
- Historical Market Size (US$ Mn) and Volume (MT) Analysis, By Market, 2019-2023
- By Country
- By Type
- By Application
- By Distribution Channel
- Current Market Size (US$ Mn) Analysis and Forecast, By Country, 2024-2032
- Germany
- France
- U.K.
- Italy
- Spain
- Russia
- Türkiye
- Rest of Europe
- Current Market Size (US$ Mn) and Volume (MT) Analysis and Forecast, By Type, 2024-2032
- Potato Chips
- Dehydrated Potato
- Frozen Potatoes
- Canned Potatoes
- Others
- Current Market Size (US$ Mn) Analysis and Forecast, By Application, 2024-2032
- Ready to Cook Products
- Snacks
- Others
- Current Market Size (US$ Mn) Analysis and Forecast, By Distribution Channel, 2024-2032
- Retail
- Food Service
- Market Attractiveness Analysis
- East Asia Processed Potato Products Market Outlook:
- Key Highlights
- Historical Market Size (US$ Mn) and Volume (MT) Analysis, By Market, 2019-2023
- By Country
- By Type
- By Application
- By Distribution Channel
- Current Market Size (US$ Mn) Analysis and Forecast, By Country, 2024-2032
- China
- Japan
- South Korea
- Current Market Size (US$ Mn) and Volume (MT) Analysis and Forecast, By Type, 2024-2032
- Potato Chips
- Dehydrated Potato
- Frozen Potatoes
- Canned Potatoes
- Others
- Current Market Size (US$ Mn) Analysis and Forecast, By Application, 2024-2032
- Ready to Cook Products
- Snacks
- Others
- Current Market Size (US$ Mn) Analysis and Forecast, By Distribution Channel, 2024-2032
- Retail
- Food Service
- Market Attractiveness Analysis
- South Asia & Oceania Processed Potato Products Market Outlook:
- Key Highlights
- Historical Market Size (US$ Mn) and Volume (MT) Analysis, By Market, 2019-2023
- By Country
- By Type
- By Application
- By Distribution Channel
- Current Market Size (US$ Mn) Analysis and Forecast, By Country, 2024-2032
- India
- Southeast Asia
- ANZ
- Rest of South Asia & Oceania
- Current Market Size (US$ Mn) and Volume (MT) Analysis and Forecast, By Type, 2024-2032
- Potato Chips
- Dehydrated Potato
- Frozen Potatoes
- Canned Potatoes
- Others
- Current Market Size (US$ Mn) Analysis and Forecast, By Application, 2024-2032
- Ready to Cook Products
- Snacks
- Others
- Current Market Size (US$ Mn) Analysis and Forecast, By Distribution Channel, 2024-2032
- Retail
- Food Service
- Market Attractiveness Analysis
- Latin America Processed Potato Products Market Outlook:
- Key Highlights
- Historical Market Size (US$ Mn) and Volume (MT) Analysis, By Market, 2019-2023
- By Country
- By Type
- By Application
- By Distribution Channel
- Current Market Size (US$ Mn) Analysis and Forecast, By Country, 2024-2032
- Brazil
- Mexico
- Rest of Latin America
- Current Market Size (US$ Mn) and Volume (MT) Analysis and Forecast, By Type, 2024-2032
- Potato Chips
- Dehydrated Potato
- Frozen Potatoes
- Canned Potatoes
- Others
- Current Market Size (US$ Mn) Analysis and Forecast, By Application, 2024-2032
- Ready to Cook Products
- Snacks
- Others
- Current Market Size (US$ Mn) Analysis and Forecast, By Distribution Channel, 2024-2032
- Retail
- Food Service
- Market Attractiveness Analysis
- Middle East & Africa Processed Potato Products Market Outlook:
- Key Highlights
- Historical Market Size (US$ Mn) and Volume (MT) Analysis, By Market, 2019-2023
- By Country
- By Type
- By Application
- By Distribution Channel
- Current Market Size (US$ Mn) Analysis and Forecast, By Country, 2024-2032
- GCC Countries
- Egypt
- South Africa
- Northern Africa
- Rest of Middle East & Africa
- Current Market Size (US$ Mn) and Volume (MT) Analysis and Forecast, By Type, 2024-2032
- Potato Chips
- Dehydrated Potato
- Frozen Potatoes
- Canned Potatoes
- Others
- Current Market Size (US$ Mn) Analysis and Forecast, By Application, 2024-2032
- Ready to Cook Products
- Snacks
- Others
- Current Market Size (US$ Mn) Analysis and Forecast, By Distribution Channel, 2024-2032
- Retail
- Food Service
- Market Attractiveness Analysis
- Competition Landscape
- Market Share Analysis, 2024
- Market Structure
- Competition Intensity Mapping By Market
- Competition Dashboard
- Company Profiles (Details - Overview, Financials, Strategy, Recent Developments)
- McCain Foods Limited
- Overview
- Segments and Product Types
- Key Financials
- Market Developments
- Market Strategy
- Lamb Weston Holdings, Inc.
- Farm Frites International B.V.
- PepsiCo
- J.R. Simplot Company
- Aviko B.V.
- The Kraft Heinz Company
- AGRANA Beteiligungs-AG
- Idahoan Foods, LLC
- Emsland Group
- J.R. Short Milling Company
- LENG-D'OR
- Limagrain Ingredients
- Intersnack Group GmbH & Co. Kg
- The Little Potato Company Ltd.
- Cavendish Farms
- Utz Brands, Inc.
- Kettle Foods, Inc.
- Kellogg Company
- Calbee, Inc.
- McCain Foods Limited
- Appendix
- Research Methodology
- Research Assumptions
- Acronyms and Abbreviations

Loading page data
Please wait a moment


