


- Electric Mobility
- Electric Power Distribution Automation Systems Market
Electric Power Distribution Automation Systems Market Size, Share, Trends, Growth, and Forecasts for 2025 - 2032
Electric Power Distribution Automation Systems Market by Implementation (Substation Automation, Feeder Automation, Consumer Side Automation), Application (Industrial, Commercial, Residential), and Regional Analysis for 2025 - 2032
Electric Power Distribution Automation Systems Market Size and Trends Analysis
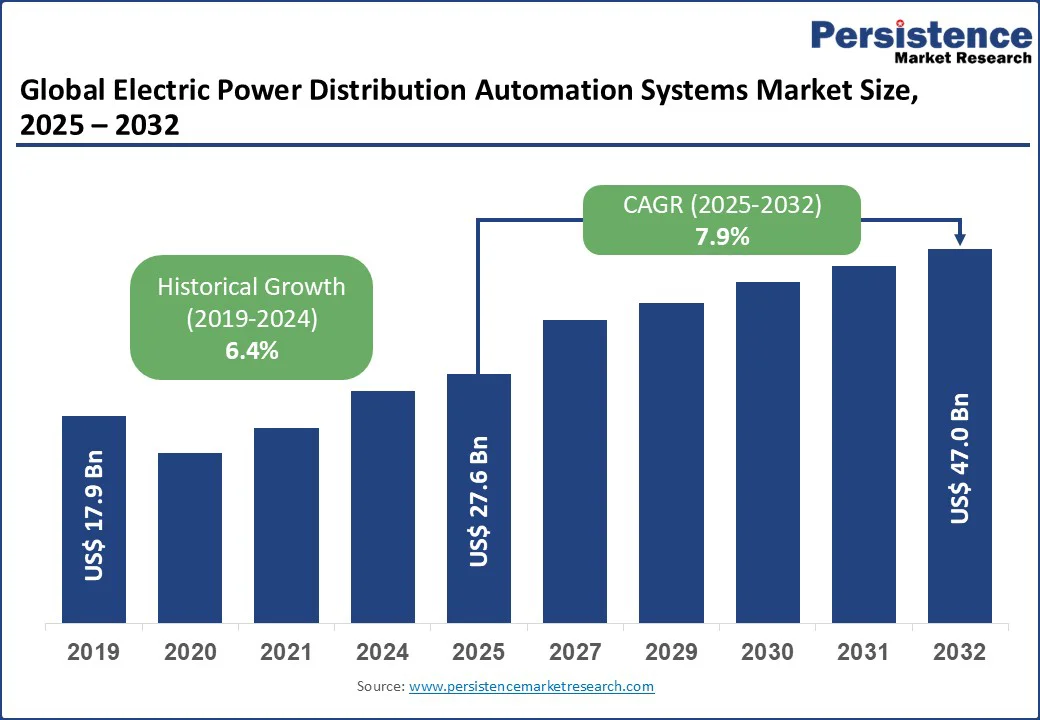
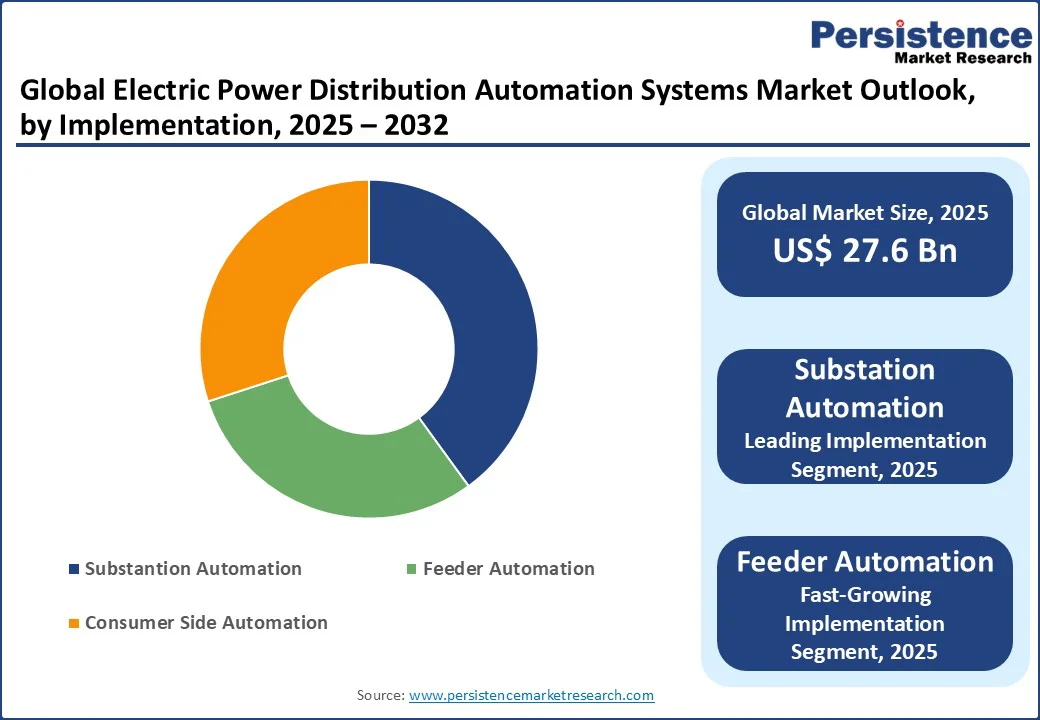
The global electric power distribution automation systems market size is valued at US$ 27.6 Bn in 2025 and is projected to reach US$ 47.0 Bn by 2032, registering a CAGR of 7.9% during forecast period 2025 - 2032, owing to steady growth as utilities and governments worldwide focus on modernizing aging grid infrastructure and enhancing energy efficiency.
Key Industry Highlights:
- Leading Implementation: Substation automation is likely to account for a 40% share in 2025, driven by grid reliability needs.
- Fastest-growing Implementation: Feeder automation fueled by smart grid advancements.
- Dominates Application: Industrial applications are likely to occupy a 45% share, valued for operational efficiency.
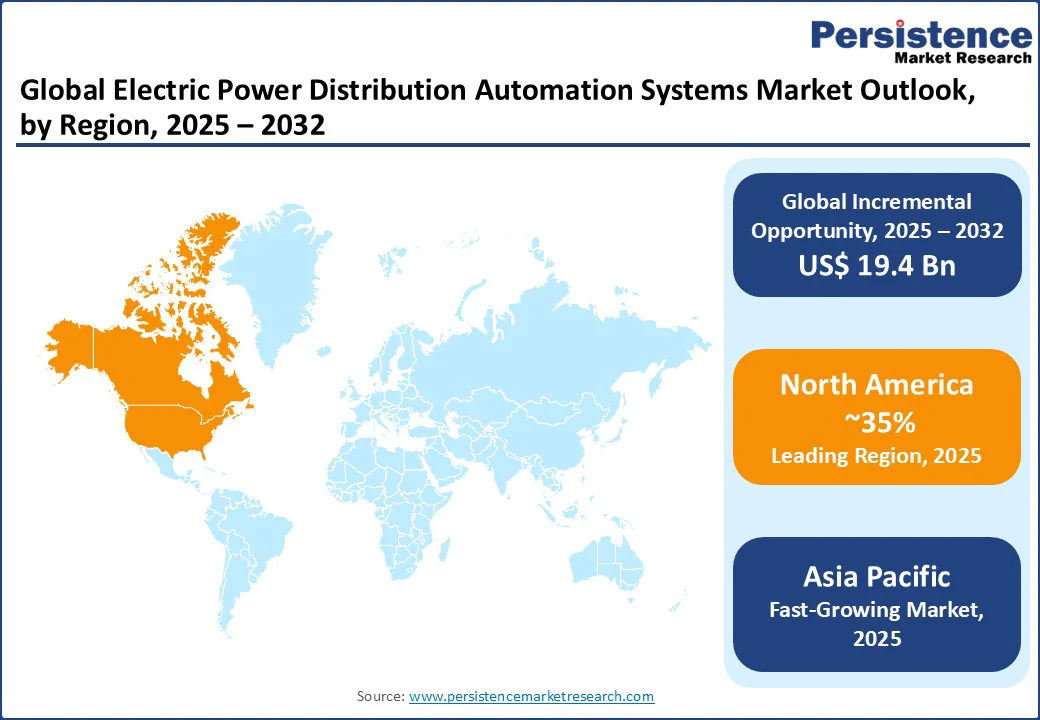
- Leading Region: North America is poised for 35% global market share, driven by U.S. infrastructure upgrades.
- Fastest Region: Asia Pacific fueled by rapid urbanization and energy demand.
| Key Insights | Details |
|---|---|
| Electric Power Distribution Automation Systems Market Size (2025E) | US$ 27.6 Bn |
| Market Value Forecast (2032F) | US$ 47.0 Bn |
| Projected Growth (CAGR 2025 to 2032) | 7.9% |
| Historical Market Growth (CAGR 2019 to 2024) | 6.4% |
Market Dynamics
Driver: Rising Demand for Smart Grid Technologies and Grid Reliability
The electric power distribution automation systems market is driven by the increasing adoption of smart grid technologies, which enhance grid reliability and efficiency. In 2025, smart grid investments globally are estimated to exceed US$ 100 Bn, with 60% of this directed toward automation systems to reduce outage times and improve energy distribution.
According to the International Energy Agency (IEA), power outages cost economies US$ 150 Bn annually, driving utilities to implement automation systems to minimize disruptions. Substation and feeder automation systems enable real-time monitoring and fault detection, reducing downtime by up to 30% in advanced grids.
The push for renewable energy integration, particularly in North America and the Asia Pacific, further fuels demand, as automation systems are critical for managing variable renewable sources such as solar and wind, which are expected to account for 50% of global electricity generation by 2030.
Additionally, government initiatives, such as the U.S. Department of Energy’s Grid Modernization Initiative, allocate funds to upgrade aging infrastructure, boosting market growth. The rise in electric vehicle (EV) adoption, with global EV sales projected to reach 30 Bn units by 2030, also necessitates advanced distribution systems to handle increased load demands, further driving automation adoption.
Restraint: High Initial Investment and Integration Challenges
The market faces challenges due to the high initial costs of deploying automation systems, including hardware, software, and communication infrastructure. In 2025, the average cost of implementing a substation automation system ranged from US$ 500,000 to US$ 2 Mn per sub-station, deterring smaller utilities in emerging markets.
Additionally, integrating automation systems with legacy grid infrastructure poses technical complexities, as 70% of global grids still rely on outdated equipment, leading to compatibility issues and extended deployment timelines.
While automation is critical for enhancing grid reliability, efficiency, and resilience, the combination of high capital intensity, legacy system integration issues, and technical skill gaps continues to act as a significant restraint on market penetration, especially in developing and cost-sensitive regions.
Opportunity: Expansion of Renewable Energy Integration and IoT Advancements
The integration of Internet of Things (IoT) technologies and the expansion of renewable energy sources present significant opportunities for the Electric Power Distribution Automation Systems market. IoT-enabled automation systems are driven by their ability to provide real-time data analytics and predictive maintenance.
The global renewable energy market requires advanced automation to manage distributed energy resources effectively. This creates opportunities for companies to develop scalable, IoT-based solutions for smart grids, particularly in regions such as the Asia Pacific, where renewable energy adoption is accelerating. Government incentives for clean energy and smart city projects further enhance market prospects.
Category-wise Analysis
Implementation Insights
Substation Automation holds a 40% market share in 2025, driven by its critical role in enhancing grid reliability and enabling real-time monitoring. This segment benefits from widespread adoption in developed regions, where utilities prioritize outage reduction and operational efficiency. Investments in substation upgrades, particularly in North America and Europe, support this dominance, with over 50% of substations in these regions incorporating automation by 2025.
Feeder Automation is the fastest-growing segment, fueled by advancements in smart grid technologies. This growth is driven by the need to optimize power flow and reduce distribution losses, especially in urbanizing regions such as Asia Pacific. Consumer Side Automation, including smart meters and demand response systems, is gaining traction due to increasing consumer awareness and regulatory mandates for energy efficiency.
Application Insights
Industrial applications dominate with a 45% market share in 2025, driven by the need for reliable power supply in manufacturing and heavy industries. Automation systems reduce downtime and improve energy efficiency, critical for industries with high energy consumption, such as steel and chemical production.
Commercial applications are the fastest-growing segment, fueled by the rise in smart buildings and commercial complexes adopting automation for energy management. Residential applications are growing steadily, driven by smart meter deployments and demand for home energy management systems, particularly in urban areas.
Regional Insights
North America Electric Power Distribution Automation Systems Market Trends
North America is likely to account for a 35% share in 2025, with the U.S. majorly contributing to the regional market. It is driven by significant investments in grid modernization, with the Department of Energy allocating US$ 10.5 Bn for smart grid projects through 2030. The U.S. also leads in renewable energy integration, with 40% of its electricity expected to come from renewables by 2030, necessitating advanced automation systems.
The rise in EV charging infrastructure, with over 500,000 charging stations planned by 2030, is expected to amplify the demand. Canada’s focus on rural electrification and smart grid deployment also contributes to regional growth.
North America’s growth is driven by a combination of policy support, renewable integration, EV adoption, and digital innovation, positioning the region as a global frontrunner in the adoption of next-generation electric power distribution automation systems.
Europe Electric Power Distribution Automation Systems Market Trends
Europe accounts for a 30% share in 2025, led by Germany, France, and the UK. Germany’s Energiewende initiative drives automation demand, with investments in smart grids exceeding €30 Bn by 2030. The UK contributes through its smart meter rollout program, targeting 50 Mn installations by 2025, enhancing consumer-side automation. France’s focus on renewable energy and smart city projects, such as Paris’s eco-districts, fuels market growth.
Europe’s stringent energy efficiency regulations, including the EU’s Clean Energy Package, support automation adoption across utilities and commercial sectors. Europe’s competitive edge lies in its regulatory-driven transformation, large-scale renewable integration, and consumer-focused digitalization, positioning the region as a global leader in the deployment of intelligent and sustainable power distribution automation systems.
Asia Pacific Electric Power Distribution Automation Systems Market Trends
Asia Pacific holds a 25% global market share in 2025, led by China, India, and Japan. China accounts for 50% of the regional market, driven by its US$ 400 Bn investment in smart grid infrastructure by 2030. India’s Power for All initiative and rapid urbanization, with a US$ 50 Bn grid modernization budget, fuel automation demand. Japan’s focus on energy resilience post-Fukushima and smart city projects, such as Tokyo’s smart districts, drives growth.
Rapid industrial growth, rising urban electricity demand, and increasing share of renewable energy in the energy mix are accelerating the deployment of next-generation distribution automation systems. Regional governments are also encouraging public-private partnerships (PPPs), foreign investments, and collaborations with global technology providers to enhance infrastructure modernization.
Competitive Landscape
The global electric power distribution automation systems market is competitive, with key players such as MYR Group Inc., The Kansai Electric Power Co., Inc., Hitachi Energy Ltd., Siemens, General Electric Company, Cisco Systems Inc., Schneider Electric, ABB, Eaton, and Power Grid Corporation of India Limited focusing on IoT integration and smart grid solutions.
Companies leverage technological advancements and partnerships to gain market share. Market players are increasingly focusing on digitalization, grid automation, and real-time monitoring technologies to address rising energy demand, renewable energy integration, and regulatory requirements for sustainable power systems.
Strategic initiatives such as partnerships, mergers & acquisitions, joint ventures, and collaborations with utility providers and technology firms are common approaches used to strengthen market presence and expand global reach.
Key Developments:
- In 2024: ABB Electrification has opened a new Smart Buildings & Smart Power Technology Hub to showcase power distribution and building automation solutions for data centres and both commercial and residential buildings.
- In 2025: Schneider Electric, the leader in the digital transformation of energy management and automation, today announced new data centre solutions specifically engineered to meet the intensive demands of next-generation AI cluster architectures. Evolving its EcoStruxure™ Data Centre Solutions portfolio, Schneider Electric introduced a Prefabricated Modular EcoStruxure Pod Data Centre solution that consolidates infrastructure for liquid cooling, high-power busway and high-density NetShelter Racks.
Companies Covered in Electric Power Distribution Automation Systems Market
- MYR Group Inc.
- The Kansai Electric Power Co., Inc.
- Hitachi Energy Ltd.
- Siemens
- General Electric Company
- Cisco Systems Inc.
- Schneider Electric
- ABB
- Eaton
- Power Grid Corporation of India Limited
- Others
Frequently Asked Questions
The electric power distribution automation systems market is projected to reach US$ 27.6 Bn in 2025, driven by smart grid and renewable energy demand.
Rising smart grid investments and renewable energy integration fuel market growth.
The electric power distribution automation systems market is likely to grow at a CAGR of 7.9% from 2025 to 2032, reaching US$ 47.0 Bn by 2032.
IoT advancements and renewable energy integration drive growth opportunities.
Key players include Siemens, ABB, Schneider Electric, General Electric, and Hitachi Energy.


