


- Oil & Gas
- U.S. Downstream Oil and Gas Market
U.S. Downstream Oil and Gas Market Size, Share, Trends, Growth, and Forecasts for 2025 - 2032
U.S. Downstream Oil and Gas Market by Product (Petroleum Products, Refined Products), by Sector (Refineries, Petrochemical Plants), and Analysis for 2025 - 2032
U.S. Downstream Oil and Gas Market Size and Trends
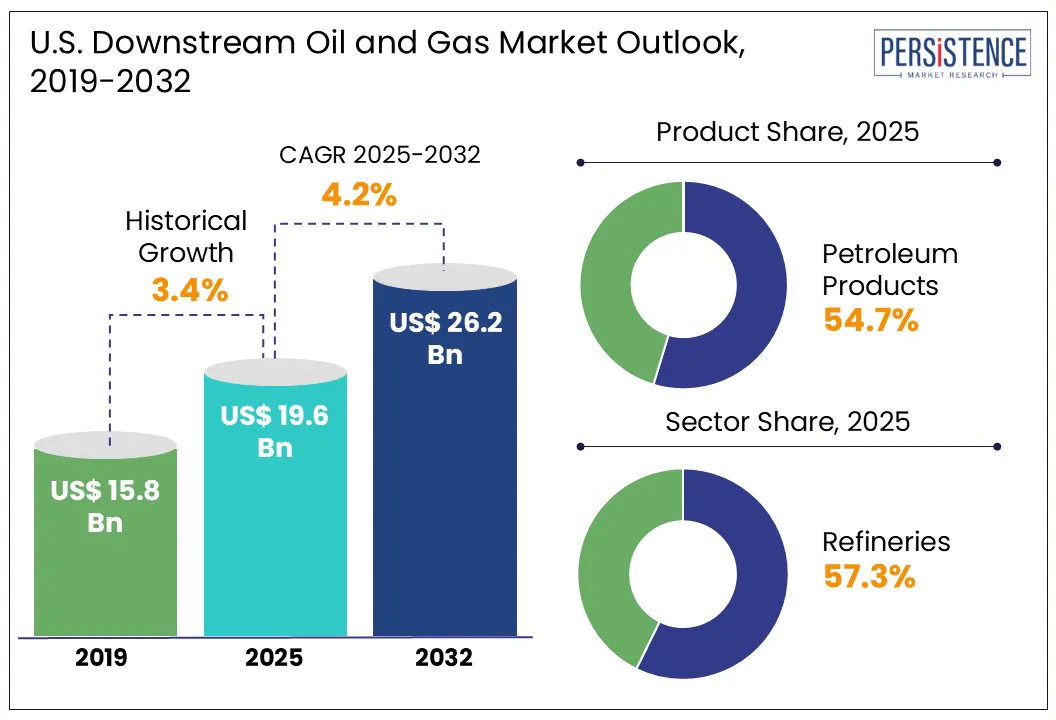
The U.S. downstream oil and gas market size is predicted to reach US$ 26.2 Bn in 2032 from US$ 19.6 Bn in 2025. It will likely witness a CAGR of around 4.2% in the forecast period between 2025 and 2032.
The U.S. is undergoing a transformation defined by precision refining, petrochemical integration, and an inclination toward export-driven growth. According to the Energy Information Administration (EIA), as of 2024, the U.S. operates over 18 Mn barrels per day in refining capacity, positioning it as a global refining powerhouse and petrochemical supplier. However, behind these numbers lies a complex interplay of shifting energy policies, evolving consumer demand, international trade realignments, and technological adaptation. From mega-refineries on the Gulf Coast to emerging renewable fuel hubs in the West, the downstream value chain is redefining its role across the U.S.
Key Industry Highlights
- Petroleum products are expected to hold nearly 54.7% share in 2025 as these offer high energy density and reliability, making them ideal for heavy industries.
- Refineries are gaining traction due to their ability to convert diverse crude slates into versatile, revenue-generating products for both domestic use and global markets.
- The Southwest is being supported by strategic Gulf ports spurring exports of diesel, gasoline, LPG, and petrochemicals to Latin America and Europe.
- Abundant low-cost feedstocks from shale basins are anticipated to spur petrochemical growth.
- Consolidation in fuel distribution and midstream segments to enhance downstream operations is a significant trend.
|
Market Attribute |
Key Insights |
|
U.S. Downstream Oil and Gas Market Size (2025E) |
US$ 19.6 Bn |
|
Market Value Forecast (2032F) |
US$ 26.2 Bn |
|
Projected Growth (CAGR 2025 to 2032) |
4.2% |
|
Historical Market Growth (CAGR 2019 to 2024) |
3.4% |
Market Dynamics
Driver - Rising energy demand and jet fuel recovery bolster growth
Rising energy demand is providing renewed momentum to the U.S. downstream oil and gas market growth, finds Persistence Market Research. It is driven by sustained diesel consumption, increased jet fuel recovery, and high petrochemical feedstock demand. While gasoline consumption has slightly dropped in a few regions because of fuel efficiency gains and rising EV adoption, diesel demand remains strong. According to Reuters, as of early 2024, U.S. distillate fuel oil consumption averaged nearly 3.9 Mn barrels per day, up from pandemic-era lows.
Air travel recovery has also provided a tailwind for downstream operations. As per a new study, jet fuel demand reached 1.7 Mn barrels per day by Q1 2024, closing in on pre-pandemic levels. This rebound is specifically important for complex refineries that rely on a balanced slate of refined products to maintain profitability. Gulf Coast refiners have extended jet fuel exports to Latin America and Europe, leveraging rising international demand to compensate for flatlining domestic gasoline markets.
Restraint - New air quality standards compel U.S. refiners to upgrade systems
Strict environmental norms in the U.S. are increasingly disrupting the operational and financial landscape of the downstream oil and gas sector. One of the most pressing challenges is the tightening of EPA rules around emissions, including the 2023 update to the National Ambient Air Quality Standards (NAAQS) for fine particulate matter (PM2.5). These stringent thresholds have placed additional compliance burdens on refineries, especially aging facilities.
Another significant barrier stems from greenhouse gas (GHG) regulations. The Environmental Protection Agency’s (EPA) final rule on methane emissions has indirect effects on downstream operations in terms of flare gas control and leak detection requirements at refineries. Upgrades to flare gas recovery systems, mandated under these rules, are capital intensive and have squeezed margins at small and mid-sized refiners.
Opportunity - Refiners turn to petrochemicals to offset gasoline demand decline
The booming U.S. petrochemical industry is predicted to create new opportunities for the downstream oil and gas sector through 2032. It is expected to create sustained demand for specific refined outputs and push infrastructure expansion in regions such as the Gulf Coast. As global demand for plastics and chemical intermediates continues to rise, U.S. refiners are increasingly optimizing operations to maximize outputs, including ethane and propylene. ExxonMobil’s US$ 2 Bn Baytown expansion in Texas, for instance, integrates refining and petrochemical operations to produce high-value materials such as linear alpha olefins and polyethylene.
Ethane, a byproduct of natural gas processing, has become a key growth driver. The U.S. has emerged as the world’s most renowned ethane exporter, with volumes surpassing 500,000 barrels per day in 2023. It has encouraged refiners and midstream players to develop new steam crackers and logistics assets that support petrochemical manufacturing. Increased integration is also allowing refiners to hedge against declining gasoline demand. In addition, the shift toward petrochemical integration has boosted new investment in hydrogen and carbon capture infrastructure, benefiting downstream operators.
Category-wise Analysis
Product Insights
In terms of product, the market is bifurcated into petroleum products and refined products. Among these, petroleum products are poised to hold approximately 54.7% of the U.S. downstream oil and gas market share in 2025 due to their deeply embedded role in industrial logistics, aviation, and petrochemical manufacturing. Another key driver is the role of petroleum derivatives in the petrochemical sector, where naphtha and gas oils serve as irreplaceable feedstocks. U.S. petrochemical production, primarily in the Gulf Coast, relies heavily on these products to manufacture plastics, fertilizers, and synthetic rubbers.
Refined products are gaining momentum owing to shifting demand patterns that favor high-margin distillates, rising export opportunities, and increasing petrochemical-linked refining activity. Diesel and jet fuel have emerged as key growth drivers due to increased freight movement, agricultural use, and industrial output. It has led refiners to recalibrate operations to produce high yields of middle distillates, optimizing profitability in the face of relatively flat gasoline demand.
Sector Insights
Based on sector, the market is divided into refineries and petrochemical plants. Out of these, refineries are envisioned to account for a share of around 57.3% in 2025, as they play a key role in converting an abundant slate of domestic and imported crude oils into high-demand fuels, petrochemical feedstocks, and export-grade products. A significant portion of U.S. refining capacity is configured for heavy crude due to decades of investment in coking and hydrocracking infrastructure. This has enabled refiners to maximize high-value outputs even from low-cost feedstocks.
Petrochemical plants have also become a pillar of the U.S. market backed by their ability to convert low-cost Natural Gas Liquids (NGLs) and refinery byproducts into high-value products. The shale gas revolution has provided the country with an abundant supply of ethane, propane, and butane, which are significant for feedstocks for ethylene and propylene production. This has further triggered a wave of capital investment in petrochemical facilities, specifically along the Gulf Coast.
Zone Insights
Southwest U.S. Downstream Oil and Gas Market Trends
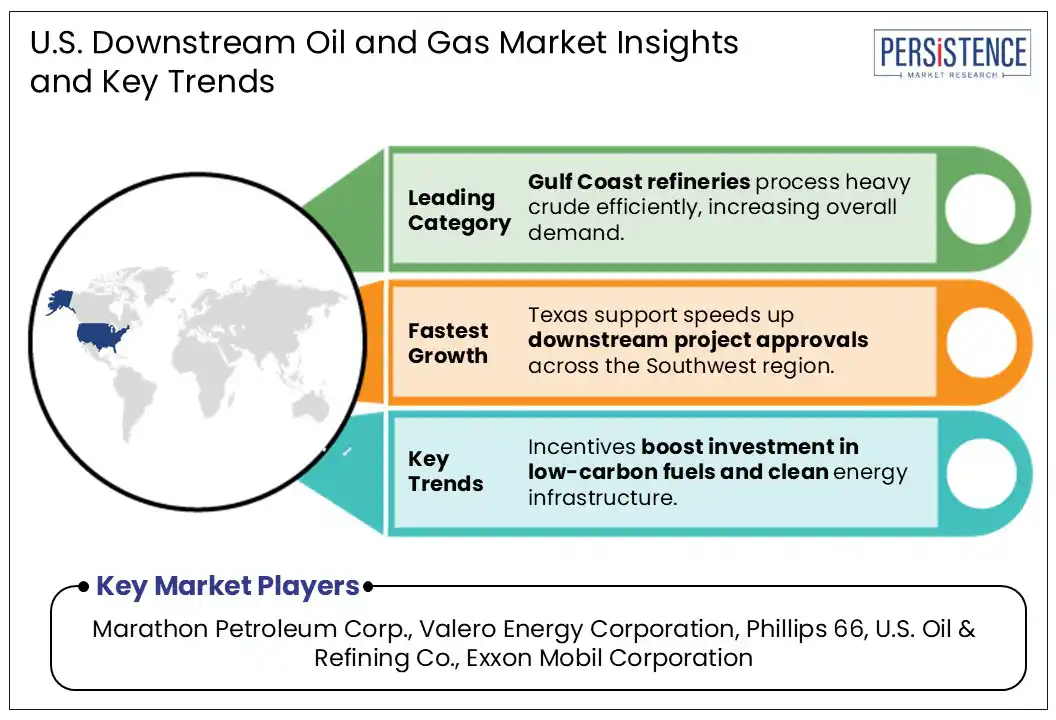
The Southwest is currently undergoing a transformative boom driven by petrochemical expansion, integrated midstream logistics, and emerging carbon-related regulation. The Permian-to-Gulf downstream corridor is experiencing a massive build?out. More than 350 projects worth nearly?US$ 60?Bn are slated to begin in the next six months across the Southwest, covering multiple states. Phillips?66 recently paid US$ 2.2 Bn to acquire Epic NGL’s pipeline and fractionation assets, optimizing ethane and propane recovery from the Permian to Gulf Coast markets.
Texas refineries remain key components of the downstream ecosystem in the Midwest. The state is being granted authority to manage carbon dioxide injection permits, paving the way for Carbon Capture/Storage (CCS) in Permian oilfields. Meanwhile, the Lavaca-Navidad water project, authorized to divert up to 31?Bn gallons annually, is required to support petrochemical capacity growth. However, a surge in petrochemical plants has invited environmental and public health scrutiny in the zone. Residents near Port Arthur and Point Comfort are voicing rising concerns, especially about air pollution and water usage.
Southeast U.S. Downstream Oil and Gas Market Trends
The market in the Southeast is shaped by strategic logistical advantages, proximity to Gulf Coast refining hubs, and vulnerability to extreme weather events. States such as Georgia, Alabama, Mississippi, and Louisiana benefit from access to high-capacity refineries, pipelines, and export terminals. Louisiana alone houses over 15% of the U.S. refining capacity, with key facilities such as Marathon’s Garyville plant and ExxonMobil’s Baton Rouge refinery. These refineries not only serve local demand but also act as main suppliers to the Eastern Seaboard via the Colonial Pipeline.
The Southeast is also emerging as a significant player in renewable diesel and biofuel blending, pushed more by market forces than by regulation, unlike California. Diamond Green Diesel, a joint venture between Valero and Darling Ingredients, for example, recently extended its Norco, Louisiana facility to 1.2 Bn gallons per year, making it one of the most important renewable diesel plants in the U.S. This growth is being fueled by demand from both domestic markets and exports, particularly to the West Coast where LCFS credits add value to these fuels.
Midwest U.S. Downstream Oil and Gas Market Trends
The Midwest is primarily influenced by its central geographic location, dependence on inland crude supplies, and a robust refining infrastructure. The zone includes various leading refining hubs in Illinois, Indiana, Ohio, and Michigan. BP’s Whiting refinery in Indiana, which is considered the most prominent in the Midwest at 435,000 barrels per day, processes a high proportion of oil sands crude from Canada. This makes the zone particularly sensitive to cross-border pipeline developments.
The Midwest’s refining configuration is mainly geared toward gasoline and diesel production, serving both local consumption and eastern states via pipeline networks. Biofuel blending and ethanol integration are also prominent in the zone owing to its deep agricultural ties. Illinois and Iowa are among the key ethanol producers nationally, and refiners in these states often blend high ethanol percentages to meet Renewable Fuel Standard (RFS) mandates. This dynamic creates a competitive edge for regional players, as ethanol blending credits offset regulatory costs.
Competitive Landscape
The U.S. downstream oil and gas market consists of various well-established oil companies, independent refiners, and specialty players. Key companies are dominating the refining segment with complex, high-capacity refineries strategically located near key logistics hubs. They have been investing in efficiency upgrades and renewable fuel capabilities, such as renewable diesel and sustainable aviation fuel, to remain competitive in a decarbonizing economy. Mid-sized players and independent refiners are under increased margin pressure due to their more limited scale and geographic footprint.
Key Industry Developments
- In May 2025, Sunoco, based in Texas, signed a US$ 9.1 Bn deal to purchase Canada-based Parkland. This move would enable the company to develop one of the most prominent independent fuel distributors in the U.S.
- In February 2025, Tulsa-based ONEOK completed the acquisition of EnLink Midstream for US$ 4.3 Bn. With this purchase, the former absorbed EnLink’s 1.7 Bn cubic feet per day of Permian gas processing capacity and 1.6 Mn barrels per day of Permian crude gathering capacity.
Companies Covered in U.S. Downstream Oil and Gas Market
- Marathon Petroleum Corp.
- Valero Energy Corporation
- Phillips 66
- U.S. Oil & Refining Co.
- Exxon Mobil Corporation
- Hunt Refining Company
- Shell plc
- Chevron Corporation
- Others
Frequently Asked Questions
The U.S. downstream oil and gas market is projected to reach US$ 19.6 Bn in 2025.
Increased co-processing of bio-feedstock and rising petrochemical demand are the key market drivers.
The market is poised to witness a CAGR of 4.2% from 2025 to 2032.
The development of modular refineries and the expansion of propane cracking capacity are the key market opportunities.
Marathon Petroleum Corp., Valero Energy Corporation, and Phillips 66 are a few key market players.


