


- Food Ingredients & Additives
- Food Antioxidants Market
Food Antioxidants Market Size, Share, Growth, and Regional Forecast, 2026 to 2033
Food Antioxidants Market by Antioxidant Type (Natural Antioxidants and Synthetic Antioxidants), by Form (Dry and Liquid), by Source (Plant Extracts, Algae-based, Chemically-Synthesized, and Others) by Application (Fats & Oils, Meat & Poultry, Bakery & Confectionery, Beverages, Prepared Foods, Seafood, Plant-based alternatives, and Others), and Regional Analysis from 2026 to 2033
Food Antioxidants Market Share and Trend Analysis
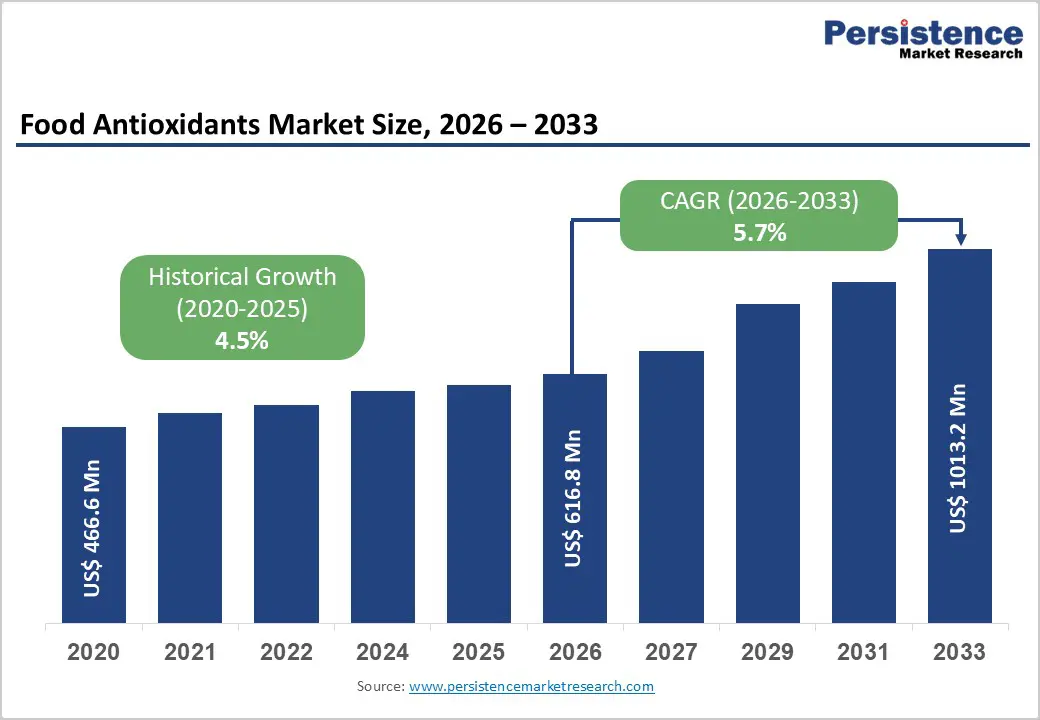
The global food antioxidants market size is likely to grow from US$ 616.8 million in 2026 to US$ 1013.2 million by 2033, at a CAGR of 5.7% during the forecast period. The global demand for food antioxidants is increasing steadily, driven by rising consumption of processed and packaged foods, stricter food safety standards, and greater emphasis on shelf-life optimization.
Food manufacturers are integrating antioxidant systems to prevent lipid oxidation, maintain color stability, and preserve nutritional integrity across meat, bakery, snack, and edible oil applications. Premiumization trends in organic and minimally processed foods are also driving innovation in natural antioxidant extraction and formulation technologies. Furthermore, growth in emerging economies, rising disposable incomes, and rapid urbanization are contributing to higher packaged food penetration. Continuous advancements in stabilization techniques, synergistic antioxidant systems, and sustainable sourcing practices are strengthening performance efficiency and commercial scalability. The growing alignment between regulatory compliance, clean-label demand, and extended shelf-life requirements continues to propel global demand for food antioxidants.
Key Industry Highlights:
- Leading Region: North America holds the largest share at 46.7%, supported by strong processed food consumption, advanced regulatory oversight, high adoption of clean-label reformulation strategies, mature retail infrastructure, and the presence of major ingredient suppliers.
- Fastest-Growing Region: Asia Pacific is expanding fastest due to rapid urbanization, rising disposable incomes, increasing packaged food demand, strengthening food safety regulations, and expansion of modern retail and distribution networks.
- Leading Type Segment: Natural antioxidants dominate the market due to strong clean-label positioning, regulatory preference, growing consumer trust in plant-derived ingredients, and expanding applications across multiple food categories.
- Fastest-Growing Type Segment: Synthetic Antioxidants are witnessing steady growth due to their high oxidative stability, cost efficiency, and strong performance in high-temperature and long-shelf-life applications, particularly in processed meats, edible oils, and packaged snack products.
- Leading Form Segment: Dry forms remain the top segment, driven by superior stability, ease of handling, longer shelf life, and broad compatibility across diverse food processing applications.
- Fastest-Growing Form Segment: Liquid forms are scaling quickly as manufacturers increasingly adopt them for improved dispersion efficiency, application flexibility, and integration into oil- and beverage-based systems.
| Key Insights | Details |
|---|---|
| Food Antioxidants Market Size (2026E) | US$ 616.8 Mn |
| Market Value Forecast (2033F) | US$ 1013.2 Mn |
| Projected Growth (CAGR 2026 to 2033) | 5.7 % |
| Historical Market Growth (CAGR 2020 to 2025) | 4.5 % |
Market Dynamics
Driver - Rising Demand for Shelf-Life Extension and Clean-Label Preservation
Growing global consumption of processed, packaged, and convenience foods is significantly accelerating the need for effective oxidation control solutions. Lipid oxidation, discoloration, nutrient degradation, and off-flavor development directly impact product quality, safety, and commercial viability, particularly in meat, bakery, snack, and edible oil categories. As supply chains become longer and distribution networks more complex, manufacturers increasingly rely on antioxidants to maintain product stability throughout storage and transportation. Simultaneously, consumers are paying closer attention to ingredient lists, prompting food brands to replace synthetic preservatives with plant-derived alternatives such as tocopherols, rosemary extracts, and ascorbates.
Stringent regulatory oversight across North America and Europe has encouraged reformulation strategies that prioritize natural additives while maintaining functional efficacy. The expansion of private-label brands and ready-to-eat food categories further amplifies demand for cost-effective yet compliant antioxidant systems. In emerging markets, urbanization and rising disposable incomes are driving packaged food penetration, creating additional volume requirements. Technological advancements in extraction, encapsulation, and synergistic antioxidant blends have improved oxidative performance, making these ingredients more adaptable across diverse food matrices. Collectively, quality preservation requirements and clean-label expectations continue to underpin sustained market expansion.
Restraints - Regulatory Scrutiny, Cost Pressures, and Performance Limitations
Despite strong demand fundamentals, several constraints moderate broader adoption and profitability. Regulatory frameworks governing antioxidant usage differ significantly across regions, creating compliance complexities for multinational manufacturers. Maximum permitted levels, labeling requirements, and safety reassessments particularly for certain synthetic antioxidants can increase formulation costs and delay product approvals. Additionally, natural antioxidants often carry higher raw material and processing expenses compared to synthetic alternatives, affecting pricing strategies in cost-sensitive markets.
Performance limitations also present technical challenges. Natural antioxidants may demonstrate variability in potency due to differences in crop quality, extraction methods, and seasonal availability. Achieving consistent oxidative stability in high-fat or high-temperature processing applications can require higher inclusion rates or combination systems, which may impact formulation economics. In some applications, plant extracts can influence color, aroma, or taste profiles, requiring additional optimization. Volatility in agricultural supply chains further contributes to pricing instability. Moreover, intense competition among ingredient suppliers compresses margins and necessitates continuous innovation. These combined factors demand strategic sourcing, regulatory expertise, and sustained R&D investment to maintain competitive advantage.
Opportunity - Expansion of Natural Solutions and Emerging Market Penetration
Shifting consumer priorities toward transparency, sustainability, and minimally processed foods create substantial growth avenues for antioxidant manufacturers. Plant-based and algae-derived antioxidants are gaining traction as food brands reformulate to meet clean-label and non-GMO positioning. Advancements in green extraction technologies, solvent-free processing, and bio-based stabilization systems enable improved yield efficiency and environmental performance, strengthening their commercial appeal. Opportunities also exist in developing multifunctional antioxidant blends that combine oxidative protection with antimicrobial or nutrient-preserving properties, enhancing value propositions for food processors.
Rapid expansion of food processing industries across Asia Pacific, Latin America, and parts of the Middle East offers significant untapped potential. Urban dietary shifts toward packaged meats, bakery goods, and snack foods are increasing demand for preservation systems that extend shelf life under variable climatic conditions. Strategic partnerships with regional manufacturers, localized production facilities, and technical support services can accelerate penetration in these high-growth markets. Additionally, premiumization trends in organic and specialty food categories open avenues for differentiated, high-margin natural antioxidant solutions tailored to niche consumer segments.
Category-wise Analysis
By Antioxidant Type, Natural Antioxidants Lead Owing to Clean-Label Demand and Regulatory Preference
The natural antioxidants segment is projected to dominate the global food antioxidants market in 2026, capturing a revenue share of 42.3%. This leadership is primarily attributed to increasing consumer preference for clean-label, plant-derived, and minimally processed food ingredients. Natural antioxidants such as tocopherols, ascorbic acid, rosemary extract, and carotenoids are widely accepted due to their perceived safety and nutritional value. Food manufacturers are progressively replacing synthetic preservatives with natural alternatives to align with regulatory scrutiny and retailer clean-label commitments.
Additionally, natural antioxidants are extensively used across bakery, meat, and oil-based applications to prevent oxidative rancidity while maintaining product labeling advantages. Rising health awareness and concerns regarding synthetic additives further reinforce segment dominance. Continuous advancements in extraction technologies and stabilization methods have improved the cost-efficiency and oxidative performance of natural solutions, enabling broader commercial adoption across developed and emerging food markets.
By Source, Plant Extracts Lead Due to Abundant Availability and Functional Versatility
The plant extracts segment is expected to lead the global food antioxidants market in 2026, accounting for a 48.0% revenue share. This dominance stems from the wide availability of botanical sources such as rosemary, green tea, grape seed, and spices, which offer strong antioxidative efficacy across diverse food matrices. Plant-based antioxidants are highly compatible with clean-label formulations and meet growing demand for natural ingredient sourcing. Their multifunctional properties, including antimicrobial benefits and flavor stabilization, enhance their appeal in processed foods, beverages, and meat preservation. Manufacturers increasingly rely on standardized plant extract blends to achieve consistent oxidative stability while maintaining regulatory compliance. Technological improvements in solvent-free extraction and concentration processes have improved potency and shelf stability. Additionally, plant extracts align well with sustainability initiatives, as many are derived from renewable agricultural sources or by-products of food processing industries, strengthening their competitive positioning globally.
By Application, Meat & Poultry Lead Due to High Oxidation Sensitivity and Large-Scale Consumption
Meat & poultry are projected to dominate the global food antioxidants market in 2026, capturing a 37.0% revenue share. The segment’s leadership is driven by the high susceptibility of animal protein products to lipid oxidation, discoloration, and off-flavor development. Antioxidants play a critical role in extending shelf life, preserving sensory attributes, and ensuring microbiological stability in fresh, processed, and frozen meat products. Growing global consumption of protein-rich diets and convenience meat products further amplifies demand for effective antioxidant systems. Regulatory standards for food safety and quality assurance also necessitate controlled oxidation management in meat processing. Both natural and synthetic antioxidants are widely applied to maintain product integrity during storage and distribution. Expansion of packaged and ready-to-cook meat categories in emerging markets strengthens volume demand. As protein consumption continues to rise worldwide, the meat & poultry segment remains the primary revenue contributor within the application landscape.
Regional Insights
North America Food Antioxidants Market Trends
North America is expected to dominate the global food antioxidants market in 2026, accounting for a 46.7% value share, led primarily by the United States. The region’s leadership is supported by high consumption of processed, packaged, and convenience foods requiring oxidative stability solutions. Strong regulatory oversight from agencies such as the FDA promotes controlled usage of both natural and synthetic antioxidants, ensuring product safety and compliance. Food manufacturers in the region prioritize shelf-life extension, quality retention, and clean-label reformulation, accelerating the shift toward natural antioxidant systems.
Advanced R&D infrastructure and the presence of major ingredient suppliers such as BASF SE, Archer Daniels Midland Company (ADM), DuPont, Kalsec Inc., and Kemin Industries further strengthen innovation capacity. Demand from large-scale meat processing, bakery, snack, and edible oil industries significantly contributes to revenue concentration. Additionally, rising consumer awareness regarding ingredient transparency and food preservation standards reinforces steady market expansion across retail and foodservice channels.
Europe Food Antioxidants Market Trends
Europe’s food antioxidants market is expected to grow steadily in 2026, driven by stringent regulatory frameworks, high-quality standards, and strong preference for natural food additives. The European Food Safety Authority (EFSA) maintains rigorous evaluation of antioxidant approvals, encouraging manufacturers to invest in plant-derived and minimally processed alternatives. Countries including Germany, France, the U.K., Italy, and Spain demonstrate consistent demand for bakery products, processed meats, ready meals, and edible oils that require oxidation control. Sustainability considerations significantly influence purchasing decisions, prompting adoption of antioxidants derived from renewable botanical sources.
Clean-label reformulation initiatives among major food brands further stimulate natural antioxidant penetration. Technological innovation in extraction and encapsulation techniques supports performance efficiency while maintaining compliance. Additionally, Europe’s mature food processing sector and established retail infrastructure ensure stable distribution and long-term consumption patterns, supporting steady revenue contribution within the global market landscape.
Asia Pacific Food Antioxidants Market Trends
Asia Pacific food antioxidants market is projected to register a higher CAGR of around 7.7% between 2026 and 2033, positioning it as the fastest-growing regional market. Rapid urbanization, expanding middle-class populations, and increasing consumption of packaged and convenience foods across China, India, Japan, and South Korea are primary growth catalysts. Rising disposable incomes and westernization of dietary habits are accelerating demand for processed meat, snack foods, bakery items, and edible oils that require effective oxidation management. Growing awareness regarding food quality, safety standards, and shelf-life optimization is encouraging adoption of both synthetic and natural antioxidant systems.
Regional governments are strengthening food safety regulations, improving manufacturing practices, and supporting domestic food processing industries. International ingredient suppliers are expanding production facilities and distribution partnerships to capture emerging demand. These structural and demographic factors collectively reinforce Asia Pacific’s strong growth trajectory in the global food antioxidants market.
Competitive Landscape
The global food antioxidants market is highly competitive, with strong participation from BASF SE, Archer Daniels Midland Company (ADM), DuPont, Kalsec Inc., and Kemin Industries. These players leverage extensive global distribution networks, integrated supply chains, strong formulation expertise, and continuous innovation in natural antioxidant extraction, synthetic stabilization technologies, and application-specific blends to address rising demand for shelf-life extension and clean-label preservation solutions.
Increasing consumption of processed and convenience foods, tightening food safety regulations, and growing preference for natural additives are driving innovation across the market. Manufacturers are focusing on plant-derived antioxidants, algae-based solutions, improved oxidative stability performance, and cost-efficient formulations, while expanding in emerging economies and strengthening R&D capabilities to deliver effective, regulatory-compliant, and application-optimized antioxidant systems.
Key Industry Developments:
- In February 2026, the U.S. Food and Drug Administration (FDA) initiated a comprehensive re-evaluation of butylated hydroxyanisole (BHA), a commonly used food antioxidant, to assess its safety under current usage conditions. The agency will review BHA’s application in food products and food contact materials based on updated scientific data and has issued a formal Request for Information (RFI) to gather additional evidence and stakeholder input.
- In February 2026, the U.S. Food and Drug Administration (FDA) approved an additional natural food dye for use in food and beverage applications while introducing updated labeling requirements to improve transparency around artificial color disclosures. The revised labeling framework is intended to help consumers more easily identify synthetic color additives and make informed purchasing decisions.
- In September 2024, Syensqo launched Riza, a 100% plant-based range of rosemary-derived antioxidants and flavors, following its majority acquisition of Moroccan extraction company Azerys in July 2024 to strengthen sourcing capabilities. Rosemary extract accounts for more than one-third of natural preservatives used in food, driven by increasing clean-label reformulation trends among manufacturers.
Companies Covered in Food Antioxidants Market
- BASF SE
- Archer Daniels Midland Company (ADM)
- DuPont
- Kalsec Inc.
- Kemin Industries
- Camlin Fine Sciences
- 3A Antioixidants
- Eastman Chemical Company
- Frutarom Ltd
- Barentz Group
- Vitablend Nederland BV
- Crystal Quinone Pvt Ltd
- Sasol Limited
- Naturex
- Others
Frequently Asked Questions
The global food antioxidants market is projected to be valued at US$ 616.8 Mn in 2026.
Rising demand for shelf-life extension and quality preservation in processed and packaged foods amid growing health-conscious consumption.
The global food antioxidants market is poised to witness a CAGR of 5.7%between 2026 and 2033.
Innovation in natural and clean-label antioxidant formulations to meet consumer health preferences and expanding demand in functional foods and emerging regions.
BASF SE, Archer Daniels Midland Company (ADM), DuPont, Kalsec Inc., and Kemin Industries are some of the key players in the food antioxidants market.


