Antioxidants Market Size, Trends, Share, and Growth Forecast 2025 - 2032

Antioxidants Market by Form (Dry, Liquid), Product Type (Natural, Synthetic), Source (Fruits & Vegetables, Oils, Spices & Extract, Other), Application (Food & Beverages, Feed Additives, Pharmaceutical, Fuel & Lubricant Additives, Other), and Regional Analysis for 2025-2032

ID: PMRREP33009
Calendar

November 2025

361 Pages

Author : Satender Singh

Antioxidants Market Size and Trend Analysis

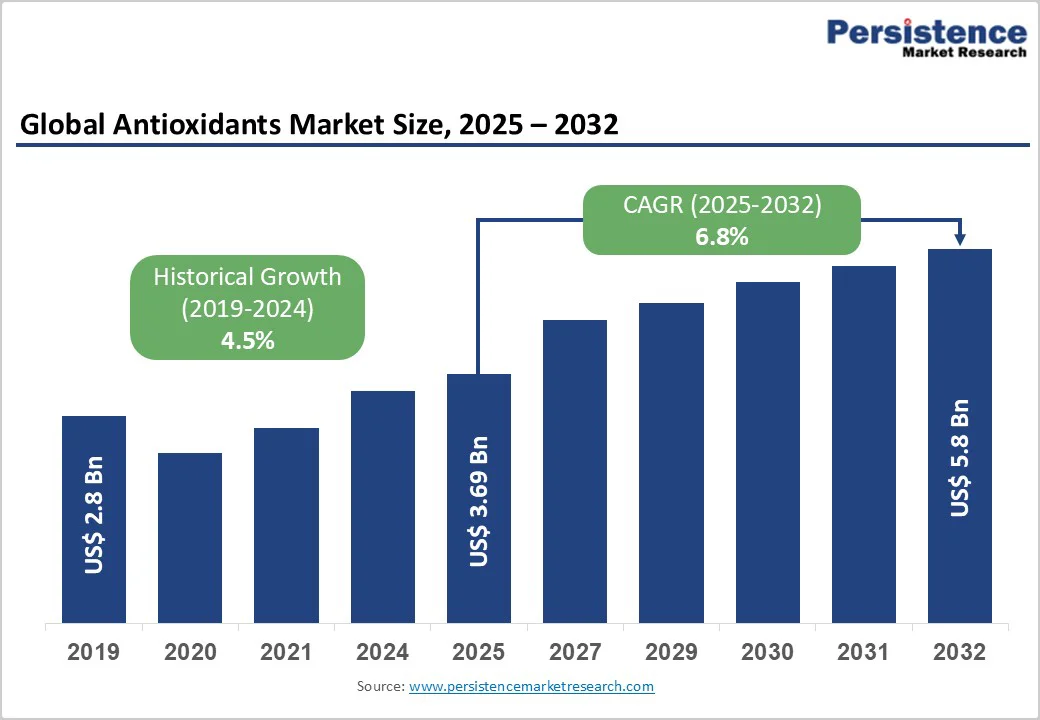
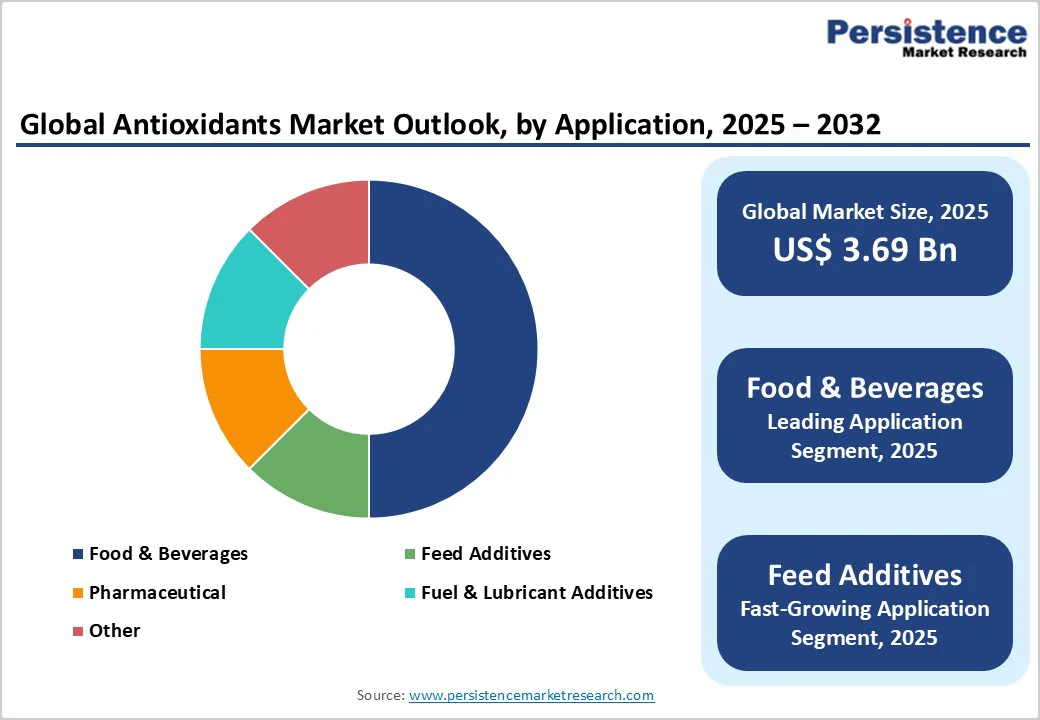
The global antioxidants market size is likely to value at US$ 3.69 billion in 2025 and is projected to reach US$ 5.8 billion, growing at a CAGR of 6.8% between 2025 and 2032. The primary drivers include rising consumer demand for processed foods and beverages that require extended shelf life to prevent oxidation, coupled with increasing health consciousness promoting the use of antioxidants in pharmaceuticals and nutraceuticals for their protective effects against free radicals. Supporting this, the growth in the plastics and lubricants industries necessitates antioxidants to enhance material durability and performance, as evidenced by surging industrial production in automotive and construction sectors globally.

Key Industry Highlights:

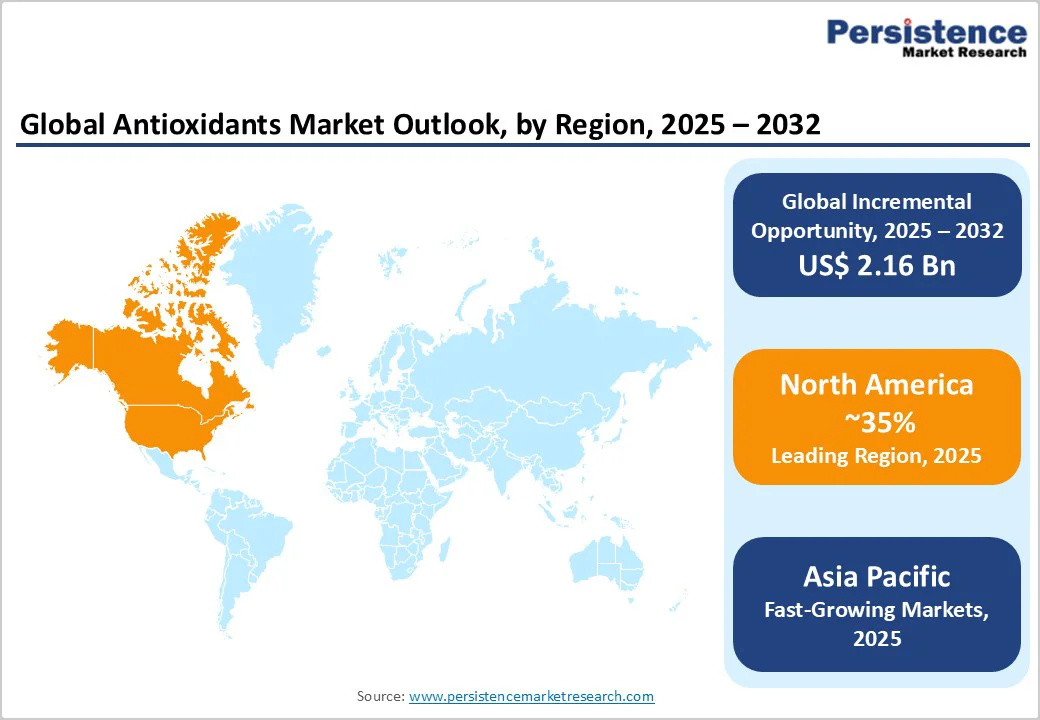
  • Regional Leader: North America leads the Antioxidants market due to advanced regulations and innovation, capturing over 35% share with the U.S. food industry dominance.
  • Fastest Growing Region: Asia Pacific emerges as the fastest-growing region, driven by manufacturing booms in China and India that boost demand in plastics and feeds for industrial efficiency.
  • Leading Segment: Food & Beverages dominates, with 50% of the market share, as the key application segment, preserving quality in processed products amid rising global consumption trends.
  • Fastest Growing Segment: Natural product type grows fastest, fueled by clean-label preferences and regulatory support for plant-derived options in nutraceuticals.
  • Growth Opportunities: Opportunities in natural antioxidants for emerging markets offer key potential, leveraging health trends and sustainable sourcing for revenue expansion.
Key Insights Details
Antioxidants Market Size (2025E) US$ 3.69 Bn
Market Value Forecast (2032F) US$ 5.8 Bn
Projected Growth CAGR (2025-2032) 6.8%
Historical Market Growth (2019-2024) 4.5%

global-antioxidants-market-size-2025-2032

Market Dynamics

Driver

Rising Demand for Processed Foods and Shelf-Life Extension

The escalating consumption of processed and convenience foods worldwide is a key driver for the antioxidants market, as these products are prone to oxidative degradation that affects quality and safety. According to USDA data, global processed food production has increased by over 20% in the last decade, driven by urbanization and busy lifestyles, necessitating antioxidants like tocopherols and ascorbic acid to inhibit lipid peroxidation and maintain nutritional integrity. This demand is particularly strong in the food and beverages sector, where antioxidants prevent rancidity in oils and fats, ensuring products remain fresh longer and reducing food waste, which aligns with sustainability goals set by organizations like the WHO.

In the Phenolic Antioxidants Market, similar trends support growth in food preservation, where phenolic compounds from natural sources effectively neutralize free radicals, enhancing market expansion by meeting consumer preferences for stable, high-quality edibles.

Health and Wellness Trends Boosting Nutraceutical Use

Growing awareness of antioxidants' role in combating oxidative stress and chronic diseases is propelling their incorporation into supplements and functional foods, fueling market growth. Research from the National Institutes of Health indicates that daily antioxidant intake can reduce the risk of cardiovascular diseases by up to 15%, prompting a surge in demand for natural variants like polyphenols from fruits. This trend is supported by rising incidences of lifestyle-related ailments, with global nutraceutical sales projected to grow at 8% annually, as consumers seek preventive health solutions amid aging populations. The shift towards clean-label products further amplifies this, with companies innovating antioxidant-fortified items that appeal to health-focused demographics, thereby driving consistent revenue streams across pharmaceutical and feed applications.

Market Restraints

Stringent Regulatory Scrutiny on Synthetic Antioxidants

Regulatory restrictions on synthetic antioxidants pose a significant barrier, as agencies like the EFSA and FDA impose limits on compounds such as BHA and BHT due to potential health risks including allergic reactions and carcinogenicity concerns. For instance, the European Commission's Directive 2008/1333 mandates labeling and usage caps, complicating formulations and increasing compliance costs for manufacturers by up to 10-15%, which discourages widespread adoption in food and pharmaceutical sectors. This oversight has led to reformulations, slowing market penetration in regions with strict guidelines and favoring alternatives, though it hampers overall growth for synthetic variants that offer cost-effective stability.

High Production Costs for Natural Antioxidants

The elevated costs associated with extracting and processing natural antioxidants from plant sources restrict market accessibility, particularly for small-scale producers in developing economies. Sourcing fruits and vegetables involves volatile agricultural prices, with USDA reports showing a 12% rise in raw material costs over recent years due to climate impacts, making natural options 20-30% more expensive than synthetics. This price premium limits scalability in price-sensitive applications like animal feed, where budget constraints prioritize cheaper alternatives, ultimately constraining broader market adoption despite consumer preference for natural products.

Market Opportunities

Expansion in Natural and Plant-Based Antioxidants

Market participants can capitalize on the surging demand for natural antioxidants derived from fruits, vegetables, and spices, driven by clean-label trends and regulatory favoritism towards bio-based preservatives. The EFSA has approved over 50 natural extracts for food use, supporting a projected 10% annual growth in this segment, as seen in innovations like rosemary extracts that match synthetic efficacy while offering health benefits like anti-inflammatory properties. With global organic food sales reaching US$ 120 Bn in 2024 per USDA estimates, companies investing in sustainable sourcing and extraction technologies, such as supercritical CO2 methods, can tap into premium markets in nutraceuticals and cosmetics, generating significant revenue from eco-conscious consumers. This opportunity is amplified in the Flame Retardant Market, where natural phenolic antioxidants enhance polymer stability without environmental harm, aligning with green chemistry initiatives.

Growth in Emerging Markets for Feed and Pharmaceutical Applications

Opportunities abound in Asia-Pacific and Latin America for antioxidants in animal feed and pharmaceuticals, fueled by rising livestock production and healthcare investments. FAO data shows a 25% increase in meat demand by 2030, necessitating feed additives to improve animal health and product quality, with natural antioxidants reducing oxidative stress in feeds by up to 40%. Recent developments, such as India's National Livestock Mission allocating US$ 500 Mn for feed enhancement, enable companies to partner with local producers for tailored solutions, potentially capturing 15% market share growth. In pharmaceuticals, the push for antioxidant therapies against aging-related diseases, backed by clinical trials showing 20% efficacy improvements, positions firms to develop novel formulations, especially in high-growth areas like personalized medicine.

Category-wise Insights

Form Analysis

Dry form dominates the antioxidants market with a 64.5% share, attributed to its superior stability, ease of handling, and longer shelf life compared to liquid variants, making it ideal for storage and transportation in industrial applications. This leadership is supported by USDA insights on processed food manufacturing, where dry powders integrate seamlessly into formulations without moisture-related degradation, reducing spoilage risks in bakery and pharmaceutical products. Industry data from natural extraction processes further justifies this, as dry forms retain potency during high-volume production, aligning with cost-efficiency needs in global supply chains.

Application Analysis

Food & Beverages leads the applications category with a 50% market share, driven by the need to preserve flavor, color, and nutritional value in perishable items like snacks and bakery goods amid rising processed food consumption. EFSA approvals for antioxidants in beverages underscore this dominance, with statistics showing a 15% reduction in oxidation-related waste when used in confectionery, supporting sustained demand from major producers. The segment's growth is further bolstered by consumer trends towards ready-to-eat products, where antioxidants ensure compliance with safety standards while enhancing product appeal.

Product Type Analysis

Synthetic antioxidants hold the leading position with a 55% share, owing to their cost-effectiveness, high stability, and proven performance in preventing oxidation across diverse applications like fuels and plastics. Regulatory data from the FDA confirms their reliability in controlled doses, with usage in over 70% of industrial lubricants reducing degradation by 30%, justifying their prevalence despite natural alternatives' rise. This edge is evident in high-throughput manufacturing, where synthetics provide consistent results, as per industry benchmarks on polymer protection.

Source Analysis

Fruits and Vegetables command a 45% share as the primary source, leveraging their rich content of bioactive compounds like vitamins C and E, which offer potent free radical scavenging for food and nutraceutical uses. PMC studies highlight their natural abundance, with extracts from berries and citrus reducing oxidative damage by 25% in clinical applications, driving preference in clean-label products. This leadership is reinforced by sustainable farming initiatives reported by the FAO, ensuring supply reliability for global formulations.

global-antioxidants-market-outlook-by-application-2025-2032

Regional Insights

North America Antioxidants Market Trends

North America leads the antioxidants market, with the U.S. dominating due to its advanced food processing infrastructure and robust innovation ecosystem supported by the FDA's guidelines on additive safety. Recent USDA reports indicate a 12% rise in natural antioxidant use in nutraceuticals, driven by health trends and R&D investments exceeding US$ 1 Bn annually from firms like ADM. The region's focus on clean-label foods has spurred developments in plant-based preservatives, enhancing market dynamics in pharmaceuticals where antioxidants combat chronic diseases.

Regulatory frameworks emphasize transparency, with FDA approvals accelerating synthetic-to-natural transitions in the bakery and feed sectors, fostering a 5% yearly growth. Innovations in encapsulation technologies further bolster the U.S. leadership, as seen in partnerships between universities and companies for bioavailable formulations.

Europe Antioxidants Market Trends

Europe's antioxidants market thrives on harmonized regulations under EFSA, promoting natural variants in countries like Germany, the U.K., France, and Spain, where clean-label demands have boosted adoption by 18% in processed foods. In Germany, industrial applications in plastics grew 10% in 2024, aligning with EU sustainability directives that favor bio-based antioxidants for reduced environmental impact. The U.K. and France performance is strong in pharmaceuticals, with clinical trials showing 20% efficacy gains against oxidative stress.

Regulatory harmonization via Directive 1333/2008 ensures consistent labeling, spurring innovations in Spain's beverage sector where antioxidants extend shelf life amid export growth. This framework supports a balanced market, with Germany leading in R&D for phenolic compounds integrated into the Phenolic Antioxidants Market.

Asia Pacific Antioxidants Market Trends

Asia Pacific exhibits rapid growth in the antioxidants market, propelled by manufacturing advantages in China, Japan, India, and ASEAN countries, where industrial expansion drives demand in plastics and feeds. China's output of plastic products hit 7.95 million metric tons monthly in 2021, necessitating antioxidants for durability, with a 5.4.5% CAGR projected through 2032. India's automotive sector, under the National Automotive Mission, integrates antioxidants in lubricants, supporting 25% livestock feed growth per FAO.

Japan and ASEAN leverage tech advancements like solvent extraction for natural sources, with India's population-driven food demand increasing bakery applications by 15%. Manufacturing hubs in China offer cost efficiencies, fueling exports and innovations in the Blowing Agents Market for polymer stability.

global-antioxidants-market-outlook-by-region-2025-2032

Competitive Landscape

The global antioxidants market remains fragmented, fostering competition through R&D and expansions. Companies pursue strategies like capacity enhancements and partnerships for natural variants, differentiating via sustainable sourcing and bio-efficacy claims. Emerging models emphasize circular economy integrations, such as recycled plastic additives, while leaders invest in green technologies to capture eco-premium segments.

Key Market Developments

  • September 2025: ADM launched natural antioxidant solutions for beverages and processed foods, focusing on clean-label extensions to enhance stability and meet consumer health demands.
  • August 2025: Cargill expanded its portfolio with plant-based extracts for bakery and dairy, targeting reduced spoilage and improved quality in response to rising processed food needs.
  • July 2025: Tate & Lyle introduced multifunctional blends for ready-to-eat meals, emphasizing flavor preservation and nutritional benefits to align with wellness trends.

Top Companies in Antioxidants Market

BASF SE (Germany) leads with a diverse portfolio of synthetic and natural antioxidants, through innovations in polymer stabilization and food preservation, leveraging global R&D for market maturity.

Archer Daniels Midland Company (USA) excels in natural extracts for food and feed, with strong influence via sustainable sourcing, and a robust pipeline in nutraceuticals for health-focused growth.

Koninklijke DSM N.V. (Netherlands) dominates pharmaceuticals with vitamin-based antioxidants, achieving high portfolio strength, driven by biotech advancements and regulatory compliance.

Companies Covered in Antioxidants Market

  • Archer Daniels Midland Company
  • BASF SE
  • Givaudan
  • Kemin Industries Inc.
  • ICC Industries Inc.
  • Barentz International BV
  • Kalsec, Inc.
  • Eastman Chemical Company
  • Camlin Fine Services
  • Koninklijke DSM N.V.
  • Vinati Organics Limited
  • Cargill Inc.
  • DuPont de Nemours, Inc.
  • Naturex (Givaudan)
  • BTSA Biotecnologías Aplicadas
Frequently Asked Questions

The antioxidants market is valued at US$ 3.69 Bn in 2025 and expected to reach US$ 5.8 Bn by 2032, growing at a 6.8% CAGR due to rising food preservation needs.

Increasing processed food consumption and health awareness for oxidative stress prevention drive demand, with USDA noting 20% growth in related sectors.

Synthetic antioxidants lead with a 55% share, valued for stability in industrial applications by regulatory approvals.

North America leads, supported by FDA innovations and a mature food industry, fostering high adoption rates.

Expansion in natural variants for emerging markets offers potential, backed by FAO livestock growth and clean-label trends.

Leading firms include BASF SE, ADM, and DSM, dominating through R&D and global portfolios in food and pharma.

Global Antioxidants Market Report Scope
Report Attribute Details

Historical Data/Actuals

2019 – 2024

Forecast Period

2025 – 2032

Market Analysis Units

Value: US$ Mn, Volume: As Applicable

Geographical Coverage

  • North America
  • Europe
  • East Asia
  • South Asia and Oceania
  • Latin America
  • Middle East and Africa

Segmental Coverage

  • Form
  • Product Type
  • Source
  • Application

Competitive Analysis

  • Archer Daniels Midland Company
  • BASF SE
  • Givaudan
  • Kemin Industries Inc.
  • ICC Industries Inc.
  • Barentz International BV
  • Kalsec, Inc.
  • Eastman Chemical Company
  • Camlin Fine Services
  • Koninklijke DSM N.V.
  • Vinati Organics Limited
  • Cargill Inc.
  • DuPont de Nemours, Inc.
  • Naturex (Givaudan)
  • BTSA Biotecnologías Aplicadas

Report Highlights

  • Market Forecast and Trends
  • Competitive Intelligence & Share Analysis
  • Growth Factors and Challenges
  • Strategic Growth Initiatives
  • Pricing Analysis & Technology Roadmap
  • Future Opportunities and Revenue Pockets
  • Market Analysis Tools
Market Segmentation

Form

  • Dry
  • Liquid

Product Type

  • Natural
  • Synthetic

Source

  • Fruits and Vegetables
  • Oils
  • Spices & Extract
  • Other

Application

  • Food & Beverages
  • Bakery
  • Snacks
  • Confectionery
  • Other
  • Feed Additives
  • Pharmaceutical
  • Fuel & Lubricant Additives
  • Other

Region

  • North America
  • Europe
  • East Asia
  • South Asia and Oceania
  • Latin America
  • Middle East and Africa

Related Reports

  1. Executive Summary
    1. Global Antioxidants Market Snapshot 2025 and 2032
    2. Market Opportunity Assessment, 2025-2032, US$ Bn
    3. Key Market Trends
    4. Industry Developments and Key Market Events
    5. Demand Side and Supply-Side Analysis
    6. PMR Analysis and Recommendations
  2. Market Overview
    1. Market Scope and Definitions
    2. Value Chain Analysis
    3. Macro-Economic Factors
      1. Global GDP Outlook
      2. Global Food & Beverage Industry Overview
      3. Global Pharmaceutical Market Overview
    4. Forecast Factors – Relevance and Impact
    5. COVID-19 Impact Assessment
    6. PESTLE Analysis
    7. Porter's Five Forces Analysis
    8. Geopolitical Tensions: Market Impact
    9. Regulatory and Technology Landscape
  3. Market Dynamics
    1. Drivers
    2. Restraints
    3. Opportunities
    4. Trends
  4. Price Trend Analysis, 2019 – 2032
    1. Region-wise Price Analysis
    2. Price by Segments
    3. Price Impact Factors
  5. Global Antioxidants Market Outlook:
    1. Key Highlights
    2. Global Antioxidants Market Outlook: Form
      1. Introduction/Key Findings
      2. Historical Market Size (US$ Bn) and Volume (Tons) Analysis by Form, 2019-2024
      3. Current Market Size (US$ Bn) and Volume (Tons) Analysis and Forecast, by Form, 2025-2032
        1. Dry
        2. Liquid
      4. Market Attractiveness Analysis: Form
    3. Global Antioxidants Market Outlook: Product Type
      1. Introduction/Key Findings
      2. Historical Market Size (US$ Bn) and Volume (Tons) Analysis by Product Type, 2019-2024
      3. Current Market Size (US$ Bn) and Volume (Tons) Analysis and Forecast, by Product Type, 2025-2032
        1. Natural
        2. Synthetic
      4. Market Attractiveness Analysis: Product Type
    4. Global Antioxidants Market Outlook: Source
      1. Introduction/Key Findings
      2. Historical Market Size (US$ Bn) and Volume (Tons) Analysis by Source, 2019-2024
      3. Current Market Size (US$ Bn) and Volume (Tons) Analysis and Forecast, by Source, 2025-2032
        1. Fruits and Vegetables
        2. Oils
        3. Spices & Extract
        4. Other
      4. Market Attractiveness Analysis: Source
    5. Global Antioxidants Market Outlook: Application
      1. Introduction/Key Findings
      2. Historical Market Size (US$ Bn) and Volume (Tons) Analysis by Application, 2019-2024
      3. Current Market Size (US$ Bn) and Volume (Tons) Analysis and Forecast, by Application, 2025-2032
        1. Food & Beverages
          1. Bakery
          2. Snacks
          3. Confectionery
          4. Other
        2. Feed Additives
        3. Pharmaceutical
        4. Fuel & Lubricant Additives
        5. Other
      4. Market Attractiveness Analysis: Application
  6. Global Antioxidants Market Outlook: Region
    1. Key Highlights
    2. Historical Market Size (US$ Bn) and Volume (Tons) Analysis by Region, 2019-2024
    3. Current Market Size (US$ Bn) and Volume (Tons) Analysis and Forecast, by Region, 2025-2032
      1. North America
      2. Europe
      3. East Asia
      4. South Asia & Oceania
      5. Latin America
      6. Middle East & Africa
    4. Market Attractiveness Analysis: Region
  7. North America Antioxidants Market Outlook:
    1. Key Highlights
    2. Pricing Analysis
    3. North America Market Size (US$ Bn) and Volume (Tons) Analysis and Forecast, by Country, 2025-2032
      1. U.S.
      2. Canada
    4. North America Market Size (US$ Bn) and Volume (Tons) Analysis and Forecast, by Form, 2025-2032
      1. Dry
      2. Liquid
    5. North America Market Size (US$ Bn) and Volume (Tons) Analysis and Forecast, by Product Type, 2025-2032
      1. Natural
      2. Synthetic
    6. North America Market Size (US$ Bn) and Volume (Tons) Analysis and Forecast, by Source, 2025-2032
      1. Fruits and Vegetables
      2. Oils
      3. Spices & Extract
      4. Other
    7. North America Market Size (US$ Bn) and Volume (Tons) Analysis and Forecast, by Application, 2025-2032
      1. Food & Beverages
        1. Bakery
        2. Snacks
        3. Confectionery
        4. Other
      2. Feed Additives
      3. Pharmaceutical
      4. Fuel & Lubricant Additives
      5. Other
  8. Europe Antioxidants Market Outlook:
    1. Key Highlights
    2. Pricing Analysis
    3. Europe Market Size (US$ Bn) and Volume (Tons) Analysis and Forecast, by Country, 2025-2032
      1. Germany
      2. Italy
      3. France
      4. U.K.
      5. Spain
      6. Russia
      7. Rest of Europe
    4. Europe Market Size (US$ Bn) and Volume (Tons) Analysis and Forecast, by Form, 2025-2032
      1. Dry
      2. Liquid
    5. Europe Market Size (US$ Bn) and Volume (Tons) Analysis and Forecast, by Product Type, 2025-2032
      1. Natural
      2. Synthetic
    6. Europe Market Size (US$ Bn) and Volume (Tons) Analysis and Forecast, by Source, 2025-2032
      1. Fruits and Vegetables
      2. Oils
      3. Spices & Extract
      4. Other
    7. Europe Market Size (US$ Bn) and Volume (Tons) Analysis and Forecast, by Application, 2025-2032
      1. Food & Beverages
        1. Bakery
        2. Snacks
        3. Confectionery
        4. Other
      2. Feed Additives
      3. Pharmaceutical
      4. Fuel & Lubricant Additives
      5. Other
  9. East Asia Antioxidants Market Outlook:
    1. Key Highlights
    2. Pricing Analysis
    3. East Asia Market Size (US$ Bn) and Volume (Tons) Analysis and Forecast, by Country, 2025-2032
      1. China
      2. Japan
      3. South Korea
    4. East Asia Market Size (US$ Bn) and Volume (Tons) Analysis and Forecast, by Form, 2025-2032
      1. Dry
      2. Liquid
    5. East Asia Market Size (US$ Bn) and Volume (Tons) Analysis and Forecast, by Product Type, 2025-2032
      1. Natural
      2. Synthetic
    6. East Asia Market Size (US$ Bn) and Volume (Tons) Analysis and Forecast, by Source, 2025-2032
      1. Fruits and Vegetables
      2. Oils
      3. Spices & Extract
      4. Other
    7. East Asia Market Size (US$ Bn) and Volume (Tons) Analysis and Forecast, by Application, 2025-2032
      1. Food & Beverages
        1. Bakery
        2. Snacks
        3. Confectionery
        4. Other
      2. Feed Additives
      3. Pharmaceutical
      4. Fuel & Lubricant Additives
      5. Other
  10. South Asia & Oceania Antioxidants Market Outlook:
    1. Key Highlights
    2. Pricing Analysis
    3. South Asia & Oceania Market Size (US$ Bn) and Volume (Tons) Analysis and Forecast, by Country, 2025-2032
      1. India
      2. Southeast Asia
      3. ANZ
      4. Rest of SAO
    4. South Asia & Oceania Market Size (US$ Bn) and Volume (Tons) Analysis and Forecast, by Form, 2025-2032
      1. Dry
      2. Liquid
    5. South Asia & Oceania Market Size (US$ Bn) and Volume (Tons) Analysis and Forecast, by Product Type, 2025-2032
      1. Natural
      2. Synthetic
    6. South Asia & Oceania Market Size (US$ Bn) and Volume (Tons) Analysis and Forecast, by Source, 2025-2032
      1. Fruits and Vegetables
      2. Oils
      3. Spices & Extract
      4. Other
    7. South Asia & Oceania Market Size (US$ Bn) and Volume (Tons) Analysis and Forecast, by Application, 2025-2032
      1. Food & Beverages
        1. Bakery
        2. Snacks
        3. Confectionery
        4. Other
      2. Feed Additives
      3. Pharmaceutical
      4. Fuel & Lubricant Additives
      5. Other
  11. Latin America Antioxidants Market Outlook:
    1. Key Highlights
    2. Pricing Analysis
    3. Latin America Market Size (US$ Bn) and Volume (Tons) Analysis and Forecast, by Country, 2025-2032
      1. Brazil
      2. Mexico
      3. Rest of LATAM
    4. Latin America Market Size (US$ Bn) and Volume (Tons) Analysis and Forecast, by Form, 2025-2032
      1. Dry
      2. Liquid
    5. Latin America Market Size (US$ Bn) and Volume (Tons) Analysis and Forecast, by Product Type, 2025-2032
      1. Natural
      2. Synthetic
    6. Latin America Market Size (US$ Bn) and Volume (Tons) Analysis and Forecast, by Source, 2025-2032
      1. Fruits and Vegetables
      2. Oils
      3. Spices & Extract
      4. Other
    7. Latin America Market Size (US$ Bn) and Volume (Tons) Analysis and Forecast, by Application, 2025-2032
      1. Food & Beverages
        1. Bakery
        2. Snacks
        3. Confectionery
        4. Other
      2. Feed Additives
      3. Pharmaceutical
      4. Fuel & Lubricant Additives
      5. Other
  12. Middle East & Africa Antioxidants Market Outlook:
    1. Key Highlights
    2. Pricing Analysis
    3. Middle East & Africa Market Size (US$ Bn) and Volume (Tons) Analysis and Forecast, by Country, 2025-2032
      1. GCC Countries
      2. South Africa
      3. Northern Africa
      4. Rest of MEA
    4. Middle East & Africa Market Size (US$ Bn) and Volume (Tons) Analysis and Forecast, by Form, 2025-2032
      1. Dry
      2. Liquid
    5. Middle East & Africa Market Size (US$ Bn) and Volume (Tons) Analysis and Forecast, by Product Type, 2025-2032
      1. Natural
      2. Synthetic
    6. Middle East & Africa Market Size (US$ Bn) and Volume (Tons) Analysis and Forecast, by Source, 2025-2032
      1. Fruits and Vegetables
      2. Oils
      3. Spices & Extract
      4. Other
    7. Middle East & Africa Market Size (US$ Bn) and Volume (Tons) Analysis and Forecast, by Application, 2025-2032
      1. Food & Beverages
        1. Bakery
        2. Snacks
        3. Confectionery
        4. Other
      2. Feed Additives
      3. Pharmaceutical
      4. Fuel & Lubricant Additives
      5. Other
  13. Competition Landscape
    1. Market Share Analysis, 2025
    2. Market Structure
      1. Competition Intensity Mapping
      2. Competition Dashboard
    3. Company Profiles
      1. Archer Daniels Midland Company
        1. Company Overview
        2. Product Portfolio/Offerings
        3. Key Financials
        4. SWOT Analysis
        5. Company Strategy and Key Developments
      2. BASF SE
      3. Givaudan
      4. Kemin Industries Inc.
      5. ICC Industries Inc.
      6. Barentz International BV
      7. Kalsec, Inc.
      8. Eastman Chemical Company
      9. Camlin Fine Services
      10. Koninklijke DSM N.V.
      11. Vinati Organics Limited
      12. Cargil Inc.
  14. Appendix
    1. Research Methodology
    2. Research Assumptions
    3. Acronyms and Abbreviations

Research Methodology Framework for Market Research Excellence

At Persistence Market Research, we implement a comprehensive, validated, and multi-dimensional approachto market analysis that delivers actionable insights across complex market landscapes. Our methodology combines the analytical rigor of leading consulting firms with innovative research techniques, ensuring robust market assessments that guide strategic decision-making with confidence.

Core Research Philosophy

Our methodology is built on four foundational pillars:

Research Philosophy Image

At Persistence Market Research, our methodology is designed to transcend conventional market studies by combining analytical rigor, multi-source validation, and future-focused insights.

We integrate advanced research frameworks, robust data collection strategies, cutting-edge analytics, and innovative technologies to deliver a 360-degree view of complex markets.

We integrate advanced research frameworks, robust data collection strategies, cutting-edge analytics, and innovative technologies to deliver a 360-degree view of complex markets.

Each stage spanning from strategic scoping and hypothesis-building to competitive intelligence, quality validation, and actionable recommendations is engineered to provide clients with unmatched clarity, precision, and confidence in decision-making.

By embedding innovation and technology at the core, our approach ensures that insights are not only comprehensive but also predictive, empowering businesses to seize opportunities, mitigate risks, and achieve sustainable growth

Research Philosophy Image

Capturing Key Information and Events

During this phase, key research objectives focus on essential information and data points for assessing the market, including:

Research Philosophy Image

TAM-SAM-SOM Framework Implementation

We employ both top-down and bottom-up approaches to ensure accurate market sizing.

Top-Down Market SizingBottom-Up Market Sizing
Universe Definition: Total global/regional market identificationUnit Economics: Average transaction values, purchase frequencies, customer lifecycle
Segmentation Filters: Geographic, demographic, and behavioral constraintsCustomer Segmentation: Detailed buyer persona development and sizing
Market Share Analysis: Competitive landscape assessment and share allocationPenetration Analysis: Market penetration rates by segment and geography
Growth Rate Application: Historical trends and forward-looking growth assumptionsScaling Methodology: Extrapolation techniques with confidence intervals

Validation & Cross-Verification

  • Triangulation: Comparing top-down and bottom-up results for consistency
  • Sensitivity Analysis: Testing key assumptions and parameter variations
  • Peer Benchmarking: Comparison with analogous markets and industry benchmarks
  • Expert Review: External validation through industry specialist consultation

Research Philosophy Image

Forecasting & Projection Modeling

Our proprietary forecasting models incorporate multiple variables and scenarios.

Forecasting Components

  • Historical Trend Analysis: 10-year historical growth patterns and cyclical variations
  • Driver-Based Modeling: Economic indicators, demographic shifts, technology adoption
  • Scenario Planning: Base case, optimistic, and conservative projections
  • Monte Carlo Simulations: Probability-weighted outcomes and risk assessments

Model Validation

  • Back-Testing: Historical accuracy assessment over 3–5-year periods
  • Cross-Validation: Multiple modeling approaches for result comparison
  • External Benchmarking: Comparison with established market forecasts
  • Continuous Calibration: Quarterly model updates based on new data

Comprehensive Data Collection Strategy

Our secondary research phase establishes a robust knowledge base utilizing diverse, credible sources.

Secondary Data Sourcess

  • Industry Publications & Reports
  • Government & Regulatory Data
  • Financial Intelligence (filings & reports)
  • Academic Research & Digital Intelligence

Quality Assurance Protocol

  • Source credibility assessment and publication date validation
  • Data consistency checks across multiple sources
  • Bias identification and neutralization techniques
  • Information gap tracking for primary research prioritization

Research Philosophy Image

Primary Research Excellence

Our primary research methodology employs best-in-class techniques to capture unique market insights.

Quantitative Research Methods

  • Large-Scale Surveys: Statistically representative samples with 95% confidence intervals
  • Survey Methodology: Multi-channel deployment (online, telephone, in-person)
  • Question Architecture and Response Optimization

Qualitative Research Methods

  • Executive Interviews
  • Focus Groups
  • Expert Consultations

Quality Assurance & Validation Framework

Multi-Stage Validation Process

  • Source Verification and Consistency Testing
  • Outlier Detection and Bias Assessment
  • Peer Review Process and External Validation
  • Sensitivity Analysis and Confidence Intervals

Research Philosophy Image

Methodology Validation & Credibility

Our research methodology has been extensively validated through:

  • Academic Partnerships: Collaborations with top-tier business schools and research institutions
  • Client Success Stories: Documented case studies demonstrating research impact and ROI
  • Continuous Benchmarking: Performance comparison with leading global research firms

This comprehensive methodology framework positions Persistence Market Research at the forefront of market intelligence, combining the analytical sophistication of top-tier consulting firms with innovative research techniques. Our approach ensures that every market assessment delivers precise, actionable, and strategically valuable insights that drive business success in competitive market environments.

Ready to unlock your market potential? Contact our research experts to discuss how our validated methodology can transform your strategic decision-making with data-driven market intelligence.

Copyright © 2026 Persistence Market Research. All Rights Reserved

Connect With Us -