


- Automotive
- Electric Commercial Vehicle Market
Electric Commercial Vehicle Market Size, Share, and Growth Forecast, 2026 - 2033
Electric Commercial Vehicle Market by Vehicle Type (Electric Bus, Electric Truck, Electric Pick-up Truck, Electric Van, Others), Powertrain Type (BEV, PHEV, FCEV), Power Output (Upto 100 KW, 101-250 KW, Above 250 KW), End Use (Last Mile Delivery, Distribution Service, Field Service, Refuse Service, Long Haul Transportation), and Regional Analysis from 2026 to 2033
Market Overview
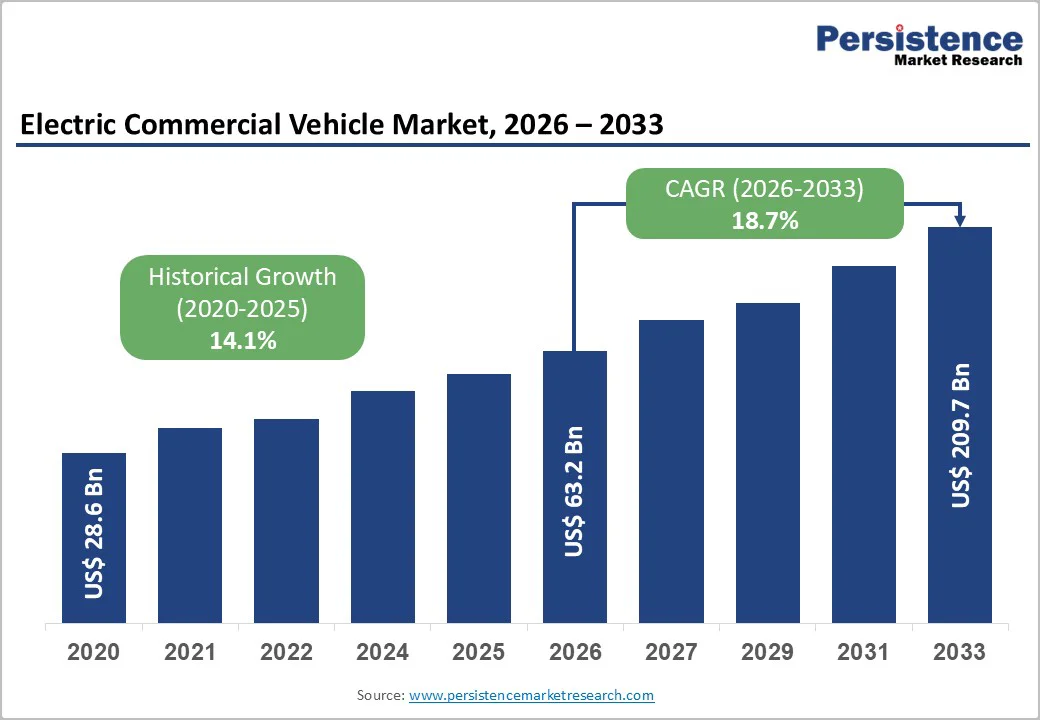
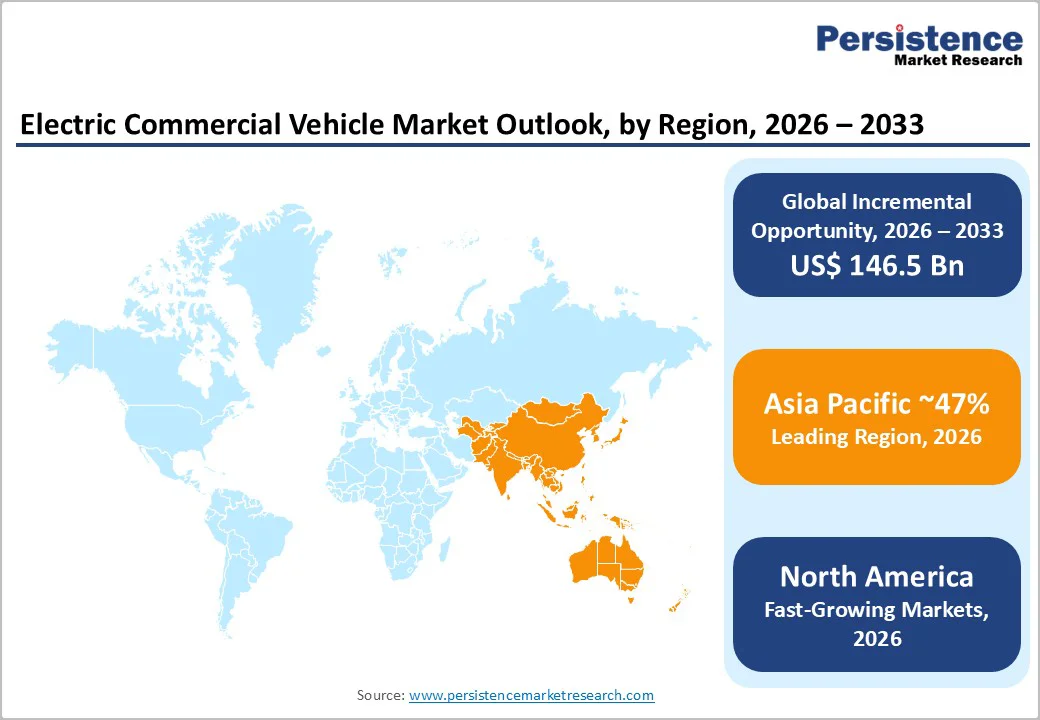
The global Electric Commercial Vehicle Market size is anticipated at US$ 63.2 Billion in 2026 and is projected to reach US$ 209.7 Billion by 2033, growing at a CAGR of 18.7% between 2026 and 2033. Market expansion is driven by regulatory mandates and emission reduction targets accelerating fleet electrification across public transport and logistics, battery technology advances delivering over 50% cost reduction improving economic viability, and e-commerce growth driving last-mile delivery electrification. North America grows at 18.1% CAGR, Europe holds 27% global share, while Asia Pacific leads with 47% share, driven by China and India.
Key Highlights Summary
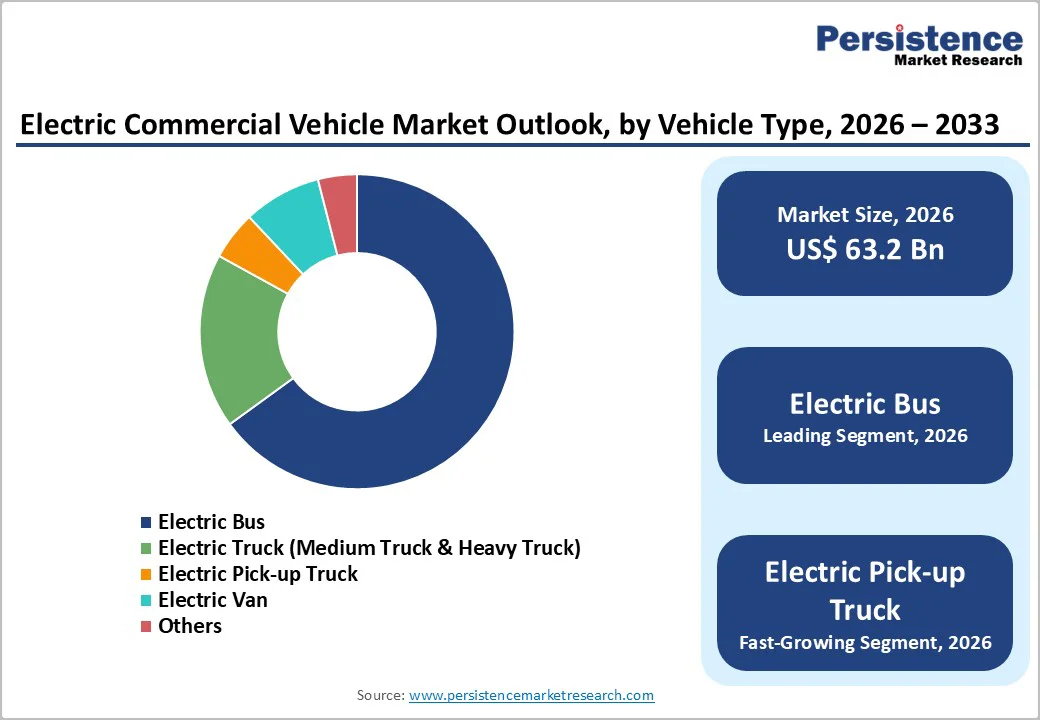
- Electric buses command 65-65.2% market share as dominant vehicle reflecting regulatory procurement, while Electric pick-up trucks expand at 20% CAGR as fastest-growing vehicle supporting emerging commercial applications.
- BEV powertrains command 67.2-71% market share as dominant propulsion, while FCEV expands at 22% CAGR as fastest-growing powertrain supporting long-haul applications and hydrogen ecosystem development.
- 101-250 KW power output commands 45% market share, while Above 250 KW segment expands at 19% CAGR supporting extended-range and heavy-duty applications.
- North America expands at 18.1% CAGR with regulatory leadership, Europe maintains 27% market share with emission standards emphasis, and Asia Pacific commands 47% market share with China's BYD dominance and India's fastest-growth trajectory.
- Volvo launches LUMINUS electric bus with 600 km range (May 2023), Volvo 7800 Electric locally manufactured in Mexico (March 2025), and De Lijn orders 350 electric buses from BYD/Daimler (December 2025), demonstrating technology innovation and regulatory-driven adoption momentum.
| Key Insights | Details |
|---|---|
| Electric Commercial Vehicle Market Size (2026E) | US$ 63.2 billion |
| Market Value Forecast (2033F) | US$ 209.7 billion |
| Projected Growth CAGR (2026-2033) | 18.7% |
| Historical Market Growth (2020-2025) | 14.1% |
Market Dynamics Analysis
Market Drivers
Stringent Regulatory Mandates and Government Incentive Programs Supporting Fleet Electrification
Stringent regulatory frameworks and government incentive programs are systematically driving electric commercial vehicle adoption, with government mandates including Germany's National Action Plan targeting 50% electric buses by 2025 and 100% by 2030, EU emission standards, and India's FAME II program generating USD 1.2 billion in subsidies, supporting sustained equipment investment and fleet electrification across public transit and commercial logistics segments. Emission reduction targets mandating zero-emission vehicle adoption. Federal and state-level incentive programs supporting vehicle acquisition and charging infrastructure. India's FAME-II and EMPS 2024 supporting electric two-wheelers, three-wheelers, and commercial vehicles. EU vehicle emission standards requiring fleet compliance. Public procurement mandates for government fleet electrification. Corporate sustainability commitments and ESG targets. Total cost of ownership advantages justifying equipment investment.
E-Commerce Growth and Last-Mile Delivery Requirements Driving Urban Vehicle Electrification
E-commerce sector expansion and logistics provider focus on last-mile delivery solutions are systematically driving urban electric commercial vehicle adoption, with last-mile delivery applications representing 35% of end-use market and Distribution Service expanding at 15% CAGR, supporting emerging demand for electric vans, trucks, and specialized delivery vehicles as critical infrastructure modernization requirement. Same-day and next-day delivery consumer expectations driving fleet modernization. Urban delivery congestion and pollution reduction focus prioritizing electric alternatives. Logistics company sustainability commitments and carbon-neutral pledges. Reverse logistics and returns management requiring flexible vehicle platforms. Warehouse automation integration with delivery vehicle optimization. Real-time tracking and fleet management enabling operational efficiency. Specialized vehicle requirements for pharmacy, food, and hazardous materials delivery.
Market Restraints
High Initial Capital Costs and Battery Component Sourcing Constraints Limiting SME Adoption
Electric commercial vehicle market expansion is constrained by substantial upfront capital investment requirements with electric commercial vehicles commanding 25-40% price premiums relative to conventional equivalents, creating adoption barriers particularly for small logistics operators and regional transport companies limiting market penetration in price-sensitive segments. Expensive battery pack costs representing 30-40% of vehicle price. Charging infrastructure investment requirements for fleet operators. Technology integration and deployment complexity. Specialized technician training requirements increasing operational costs. Battery warranty and replacement costs affecting lifecycle economics. Supply chain dependencies for critical battery and component sourcing. Currency fluctuation impacts on international vehicle pricing.
Charging Infrastructure Gap and Grid Capacity Constraints Affecting Operational Viability
Electric commercial vehicle market expansion is constrained by insufficient charging infrastructure coverage, with public DC fast charging networks inadequate to support large-scale fleet deployment, particularly in emerging markets and rural regions limiting vehicle deployment flexibility and supporting operational viability concerns affecting customer adoption decisions. Public charging network density insufficient for commercial fleet operations. DC fast charging installation costs exceeding USD 100,000 per station. Grid capacity constraints in some regions limiting simultaneous charging. Charging time requirements exceeding conventional fuel advantages for long-haul operations. Fleet depot charging infrastructure requirements for overnight charging. Regulatory approval timelines for station deployment. Geographic coverage gaps in rural and emerging market regions.
Market Opportunities
Hydrogen Fuel Cell Electric Vehicles and Extended-Range Applications Supporting Long-Haul Segment
Hydrogen fuel cell electric vehicle development and emerging long-haul applications represent substantial market opportunity, with FCEV powertrain technology expanding at 22% CAGR as fastest-growing powertrain segment and hydrogen fuel cell buses demonstrating 370+ mile range supporting extended-range applications, enabling long-distance commercial transportation and long-haul trucking electrification supporting emerging high-margin market segment development. Hydrogen infrastructure development supporting commercial deployment. Fuel cell cost reduction trajectory improving economics. Long-haul truck suitability for hydrogen systems. Regional freight and intercity bus applications supporting hydrogen positioning. Government hydrogen strategy initiatives supporting ecosystem development. Green hydrogen production expansion supporting sustainable fuel source. Vehicle-to-grid (V2G) integration supporting grid stabilization services.
Urban Mobility Transformation and Smart City Integration Supporting Specialized Applications
Urban mobility transformation and smart city integration represent emerging opportunity, with electric buses and specialized commercial vehicles supporting urban transformation initiatives, enabling congestion reduction, air quality improvement, and sustainable urban development supporting premium positioning and specialized application development across municipal and corporate segments. Integrated mobility-as-a-service (MaaS) platforms connecting transport modes. Smart city infrastructure integration enabling real-time optimization. Autonomous driving integration supporting future-ready platforms. Vehicle-to-infrastructure (V2I) communication enabling cooperative systems. Dynamic routing and fleet optimization reducing operational costs. Public-private partnerships supporting infrastructure investment. Employment and supply chain development in emerging markets.
Segmentation Analysis
Vehicle Type Analysis
Electric buses command 65.2% of electric commercial vehicle market share, representing dominant vehicle category reflecting established municipal procurement programs, regulatory mandates, and predictable urban routing supporting sustained investment in advanced battery and automation technologies across transit agencies globally. Articulated and bi-articulated bus configurations supporting high-capacity transit. Electric coach applications supporting intercity transportation. Range optimization through advanced battery technology. Charging infrastructure integration supporting depot and en-route charging. Passenger comfort and safety as critical performance factors. Urban environmental benefits supporting policy adoption. Total cost of ownership advantages justifying fleet replacement.
Electric pick-up trucks are the fastest-growing vehicle category at 20% CAGR, driven by commercial and personal adoption across last-mile delivery, utility services, and fleet operations. Demand is supported by cost efficiency, sustainability, towing and payload parity, specialized upfits, regional preference for pickups, and expanding applications for businesses and service providers.
Powertrain Type Analysis
Battery electric vehicles command 71% of market share, representing dominant powertrain reflecting total electrification enabling zero-tailpipe emissions, supporting urban transit applications and short to medium-range commercial operations with established charging infrastructure and declining battery costs. Full electrification benefits supporting emissions reduction. Operational cost advantages from reduced fuel and maintenance. Established charging ecosystem supporting deployment. Battery cost trajectory improving economics. Regulatory compliance assurance for emission standards. Fleet electrification focus across public transit. Urban and regional transport suitability.
Fuel cell electric vehicles are the fastest-growing powertrain at 22% CAGR, driven by extended range, rapid hydrogen refueling, and zero-emission operation. Growth is supported by hydrogen infrastructure development, efficiency on long-haul routes, government hydrogen strategies, regional freight deployment, and emerging intercity bus, freight, and specialized commercial applications.
Power Output Analysis
101-250 KW power output segment commands 45% of market share, representing established standard for mid-size electric buses and medium-duty trucks supporting typical urban transit and regional delivery applications with proven technology and cost-effective performance delivery. Urban bus applications at 100-150 KW typical. Medium-duty truck configurations at 150-250 KW. Efficient energy consumption and operational costs. Battery size and weight optimization supporting performance. Charging time optimization for daily operations. Cost-effectiveness supporting broad adoption. Performance adequacy for most commercial applications.
The above 250 kW segment is the fastest-growing at 19% CAGR, driven by heavy-duty trucks, articulated buses, and long-haul applications requiring higher power output. Growth is supported by 300–500+ kW systems, payload and performance parity, multi-axle configurations, specialized use cases, advancing power electronics, and future-ready architectures enabling autonomous and high-demand operations.
End Use Analysis
Last-mile delivery applications command 35% of market share, representing dominant end-use reflecting e-commerce sector expansion requiring urban delivery solutions supporting sustained demand for electric vans and light-duty trucks across courier services, parcel carriers, and grocery retailers. Same-day delivery requirements driving electrification. Urban delivery congestion prioritizing electric alternatives. Package density optimization supporting vehicle utilization. Return logistics requirements for multi-trip daily operations. Delivery timeframe support with scheduled charging. Fleet tracking and optimization improving service levels. Sustainability marketing supporting brand positioning.
Distribution service applications are the fastest-growing end-use segment at 15% CAGR, driven by wholesale, beverage, and retail supply chain modernization. Growth is supported by regional hub connectivity, temperature-controlled distribution, multi-stop route optimization, medium-distance transport of 50–200 miles, fleet consolidation strategies, and adoption of flexible electric commercial vehicles improving logistics efficiency and cost performance.
Regional Market Insights
North America
North America expands at prominent 18.1% CAGR, driven by regulatory leadership, robust charging infrastructure development, urban pollution reduction focus, and established commercial fleet modernization supporting market growth and technology innovation across transit and logistics segments. U.S. market dominance with federal incentive programs. Charging infrastructure expansion across major cities. Urban transit fleet electrification supporting pollution reduction. California emission standards leading global trends. Federal tax credits supporting vehicle acquisition. State-level incentive programs supporting infrastructure. Technology innovation ecosystem supporting advancement.
North American market characterized by regulatory leadership and technology innovation with major cities including Los Angeles, New York, and San Francisco implementing electric bus fleets. Strong infrastructure investment supporting deployment. Federal and state incentive programs accelerating adoption. Charging standards harmonization supporting ecosystem development.
Europe
Europe maintains significant 27% market share with considerable growth pace, driven by strict EU emission standards, environmental consciousness, manufacturing excellence, and strong sustainability commitment supporting technology advancement and premium market positioning. Germany leadership with 50% electric bus target by 2025. UK regulatory framework driving fleet modernization. France sustainability focus supporting green transition. Spain electric bus deployment supporting urban air quality. EU emission standards mandating fleet compliance. Environmental directives supporting technology investment. Advanced manufacturing supporting quality standards.
European market characterized by strict regulatory compliance and sustainability emphasis with manufacturers focusing on advanced battery systems and clean technology development. Strong emphasis on air quality improvement in major cities. Established charging infrastructure supporting early adoption. Technology partnerships supporting innovation ecosystems.
Asia Pacific
Asia Pacific commands dominant 47% market share, driven by rapid urban expansion, emerging market infrastructure development, manufacturing excellence, and government support programs supporting market growth exceeding global averages and reflecting emerging market momentum. China market leadership with BYD dominance and vertical integration. India fastest-growth market through FAME II and EMPS 2024 support. Japan technology leadership in battery and powertrain systems. ASEAN region expansion supporting regional distribution. Government development programs supporting infrastructure. Manufacturing cost advantages enabling competitive pricing. Vertical integration by Chinese manufacturers supporting economies.
Asia Pacific market characterized by rapid growth and emerging market opportunities with technology adoption accelerating faster than developed markets. Chinese manufacturers demonstrating vertical integration and cost advantages. Government support programs accelerating adoption. Manufacturing presence supporting supply chain development and employment creation.
Competitive Landscape
Market Structure
The global electric commercial vehicle market exhibits moderately consolidated structure with multinational leaders including BYD Company Ltd., AB Volvo, Daimler Truck AG, and Tesla Inc. commanding estimated 35-45% combined market share through integrated vehicles, battery technology, and charging solutions, complemented by established commercial vehicle manufacturers including Ford, General Motors, Scania, and Mercedes-Benz supporting distinct market positioning through technology specialization and regional presence, and emerging players including Chinese manufacturers and specialized electric vehicle developers capturing niche opportunities through innovation and cost-competitive positioning supporting technology-driven competitive differentiation.
Strategic Developments
- In May 2023, Volvo Buses introduced LUMINUS electric city bus available in 9.7-13 meter lengths featuring advanced battery management and up to 600-kilometer range supporting urban transit applications and demonstrating technology advancement momentum in electric bus segment.
- In March 2025, Volvo Buses announced introduction of Volvo 7800 Electric in Mexico marking country's first locally manufactured electric bi-articulated and articulated bus, supporting Mexico's Bus Rapid Transit modernization and reflecting emerging market technology deployment.
Business Strategies
Market leaders employ technology differentiation through advanced battery systems and autonomous capabilities, vertical integration supporting end-to-end supply chains, geographic expansion targeting emerging market infrastructure development, regulatory compliance leadership supporting market advantage, charging infrastructure ecosystem development enabling customer support, cost reduction through manufacturing scale, and sustainability positioning attracting regulatory support and customer preference.
Companies Covered in Electric Commercial Vehicle Market
- BYD Company Ltd.
- AB Volvo
- Daimler Truck AG
- Tesla, Inc.
- Ford Motor Company
- General Motors
- Mercedes-Benz Group AG
- Scania AB
- Mitsubishi Motors Corporation
- Nissan Motor Co., Ltd.
- Renault Group
- Solaris Bus & Coach
- CAF (Construcciones y Auxiliar de Ferrocarriles)
Frequently Asked Questions
The global Electric Commercial Vehicle Market is anticipated at US$ 63.2 Billion in 2026 and is projected to reach US$ 209.7 Billion by 2033.
Market growth is driven by strict emission regulations and subsidies, battery technology advancements with over 50% cost reduction, and rising e-commerce fueling last-mile delivery electrification.
The market is projected to expand at an 18.7% CAGR between 2026 and 2033.
Key opportunities include Asia Pacific fleet electrification led by India and China, hydrogen fuel cell vehicles for long-haul transport, and smart city-driven urban mobility transformation.
The market is led by BYD, AB Volvo, Daimler Truck, Tesla, Ford, and General Motors, supported by ongoing electric bus and truck launches, hydrogen partnerships, and large fleet orders driven by regulatory adoption.


