


- Metals & Minerals
- U.S. High Purity Quartz Market
U.S. High Purity Quartz Market Size and Growth Analysis for 2025 - 2032
U.S. High Purity Quartz Market By Grade (HPQ Sand (99.9% to 99.95%, Grade-1 (99.95% to 99.99%), Others), Application (Semiconductor, Consumer Electronics, Others), and Regional Analysis for 2025 - 2032
U.S. High Purity Quartz Market Size and Trends Analysis
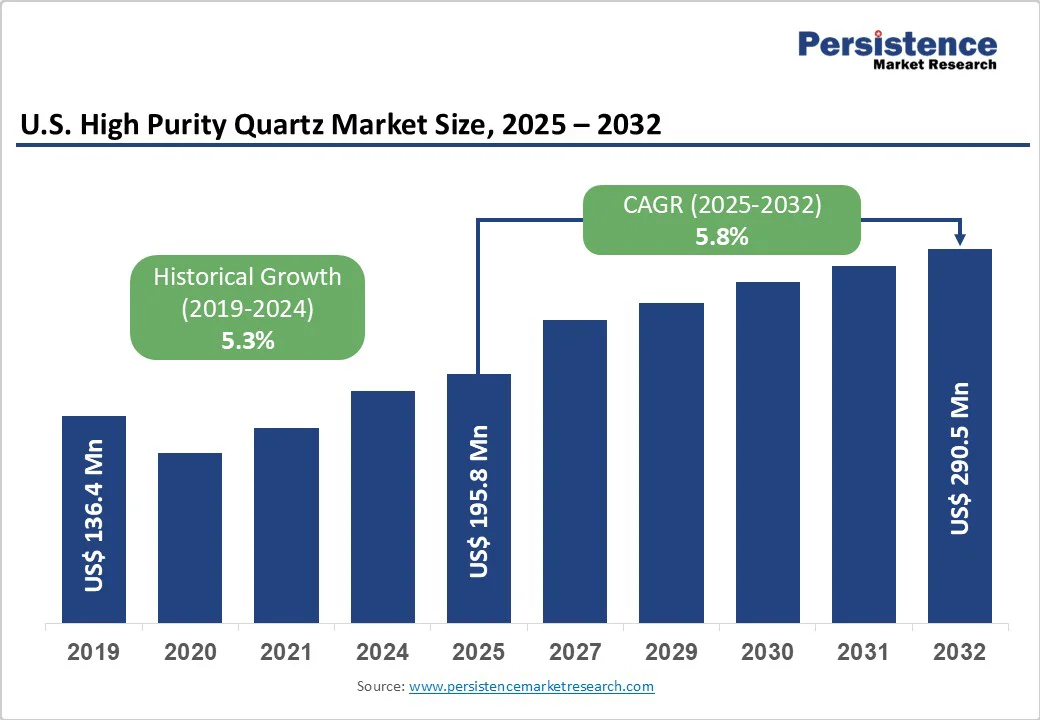
The U.S. high purity quartz market size reached a value of US$195.8 Million in 2025 and is anticipated to reach a value of US$290.5 Million by 2032, growing at a CAGR of 5.8% during the forecast period from 2025 to 2032, driven by heightened demand from the electronics industry, the swift proliferation of solar energy systems, and the burgeoning use of advanced optical technologies.
Key Industry Highlights
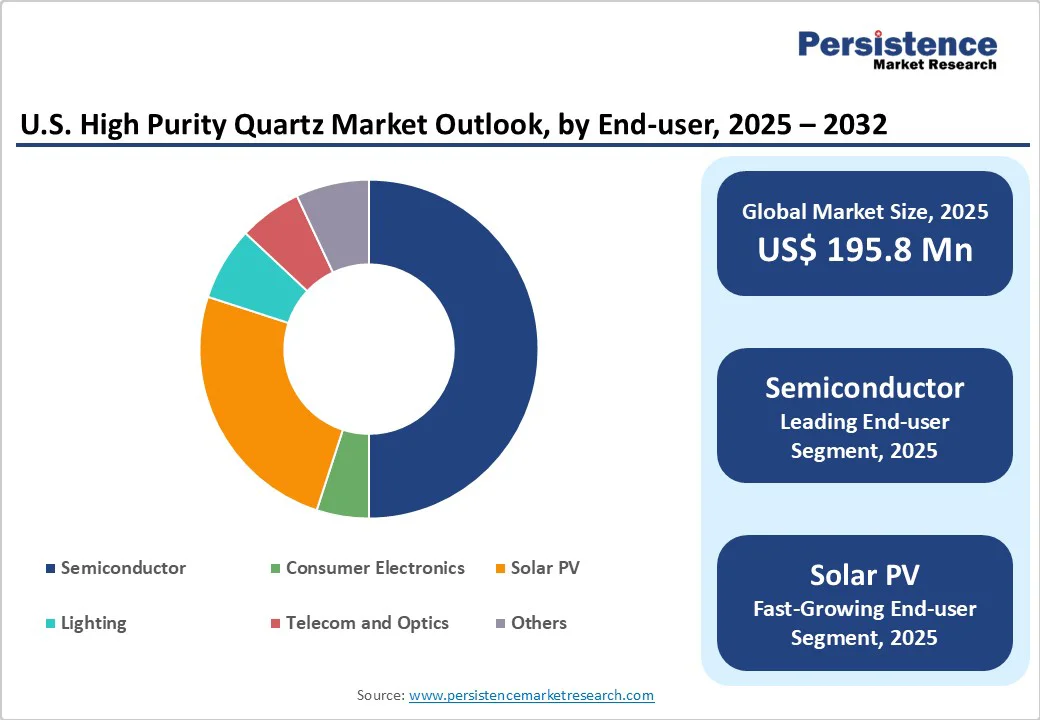
- Semiconductor Industry Maintains Market Leadership: The semiconductor sector continues to dominate the U.S. high purity quartz (HPQ) market, commanding approximately 50% market share in 2025, driven by robust demand from advanced chip manufacturing and AI applications.
- Grade III HPQ Emerges as the Premium Choice: Grade III HPQ has captured over 50% of the market in 2025, valued for its exceptional SiO? purity levels exceeding 99.995%, which are essential for next-generation semiconductor fabrication and high-efficiency solar photovoltaic applications.
- Solar Sector Drives Unprecedented Growth: The U.S. solar industry has experienced remarkable expansion, adding over 150 GW of new capacity since 2020, with projections indicating 39 GW of additional solar installations in 2025 alone, representing more than half of all new U.S. electricity generation capacity.
- Federal Investment Catalyzes Semiconductor Renaissance: The CHIPS and Science Act has unleashed a wave of private sector investment, with over US$630 Billion in announced semiconductor supply chain investments since 2020, positioning the U.S. to potentially triple its chipmaking capacity by 2032.
- Strategic Capacity Expansion by Market Leaders: Sibelco has committed to a transformative US$700 Million investment program at its Spruce Pine facility in North Carolina, including a completed US$200 Million expansion (doubling capacity by 2025) and an additional US$500 Million expansion planned for 2024-2027, ensuring long-term supply security for the global HPQ market.
- Market Valuation Reflects Strong Fundamentals: The U.S. HPQ market is projected to reach US$290 Million by 2032, supported by sustained demand growth from both traditional semiconductor applications and emerging technologies, including 5G infrastructure, artificial intelligence, and advanced photovoltaic systems.
- Supply Chain Resilience Becomes Strategic Priority: With HPQ recognized as a critical material for national security and technological leadership, domestic production capabilities are being strengthened to reduce dependence on international supply chains while supporting the broader clean energy transition.
| Key Insights | Details |
|---|---|
|
U.S. High Purity Quartz Market Size (2025E) |
US$195.8 Mn |
|
Projected Market Value (2032F) |
US$290.5 Mn |
|
U.S. Market Growth Rate (2025 to 2032) |
5.8% |
|
Historical Market Growth Rate (2019 to 2024) |
5.3% |
Demand for High Purity Grade-3 HPQ in Semiconductor Applications
Grade-3 (SiO2 content of more than 99.99%) captured the highest share in 2025, accounting for more than 50% of the market. The ultra-high purity HPQ is used in the solar and semiconductor industries, where it is used for piezoelectric quartz, Semiconductor Quartzware (Inner Layer), Solar Quartzware (Inner Layer), and Semiconductor Wafers and Crucibles manufacturing.
The U.S. semiconductor industry has been at the forefront of the supply of chips in the in past, with over 40% of the global chips being supplied by U.S. companies. As the business is investing in local manufacturing and reducing reliance on the China market, the demand for Grade-3 HPQ in the U.S. is expected to soar in the coming years.
Solar PV Continues to Take the Lead
The solar industry has played a crucial role in shaping the renewable future for energy needs. The U.S. solar industry sector has grown by a 25% CAGR in the last decade. According to the Solar Energy Industries Association (SEIA), the U.S. is likely to install about 236 to 248 GW of solar capacity by late 2025, an activity that is significantly increased by federal policies such as the Investment Tax Credit (ITC) and the Inflation Reduction Act (IRA).
As a result, the manufacturing business of solar panels and photovoltaics for residential, commercial, and utility applications is expected to grow significantly in the U.S.
HPQ Sand, which is a crucial material in preparing solar quartzware, is expected to boom with the U.S. high purity quartz market. The solar PV segment accounts for more than 40% HPQ demand in the U.S., expanding at a 6.3% CAGR from 2025 to 2032.
Market Introduction & Trend Analysis
High purity quartz (HPQ) refers to highly refined quartz with exceptional purity used in industries such as semiconductors, solar panels, and optical fibers. Manufacturers extract HPQ from high-quality quartz deposits, as its chemical stability and thermal resistance make it crucial for advanced technology applications.
The U.S. high purity quartz market is growing due to increasing demand in the electronics sector, the rapid expansion of solar energy installations, and the rise of high-performance optical applications. The surge in 5G network infrastructure and higher investments in renewable energy projects are driving this demand further. The increasing reliance on these technologies creates significant growth opportunities for HPQ suppliers.
Increasing production capacity expansions are seen in North America and Asia Pacific as these regions are witnessing huge demand for high purity quartz. Additionally, innovations in purification technologies are helping manufacturers achieve high purity levels efficiently. Meanwhile, competition is intensifying among leading players like Sibelco, The Quartz Corp, etc. as they strive to meet the increasing global demand for HPQ.
Market Factors – Growth, Barriers, and Opportunity Analysis
Growth Analysis - Growing Demand for High Purity Quartz from Fiber Optic Manufacturers
High purity quartz is a crucial material used in the production of fiber optic cables, which are the backbone of modern telecommunications infrastructure. With the ongoing rollout and expansion of 5G and future 6G technologies, the demand for fast internet connectivity and high-speed data transfer has surged dramatically.
Technologies require robust fiber optic networks to handle the massive data loads, support low latency, and deliver enhanced broadband services across industries. These industries include telecommunications, entertainment, and cloud computing. The demand for high-speed and reliable internet infrastructure continues to grow as more industries and consumers adopt Internet of Things (IoT) devices, autonomous systems, smart cities, and cloud-based services.
Fiber optics, offering superior data transmission speed and reliability, is becoming a critical requirement. This creates a significant uptick in demand for high purity quartz, which is essential in producing high-performance fiber optic cables. The U.S. high purity quartz market is benefiting from this demand growth, driven by the advancement of next-generation communication technologies.
Expanding E-commerce Penetration in the Country
The growth of consumer electronics sales in the U.S. is significantly driving demand for high purity quartz (HPQ) in the semiconductor and electronics industries. As devices such as smartphones, laptops, tablets, and wearables become more popular, the need for advanced semiconductors has surged.
HPQ, known for its exceptional purity and thermal stability, is a critical raw material used in the production of these semiconductors, which are essential for the functioning of modern electronics. By 2026, consumer electronics sales in the U.S. are predicted to surpass US$200 Billion. Growing population, rising disposable incomes, and a shift toward modernization will drive demand for HPQ more in consumer electronics manufacturing in the country.
Opportunity Analysis - Shift toward Renewable Solar Energy Projects
The shift toward renewable solar energy projects provides a lucrative opportunity for the U.S. high purity quartz market. As the U.S. accelerates its transition to clean energy, solar power generation has become a key focus.
HPQ plays a critical role in the production of photovoltaic (PV) solar panels as it is used to create high-purity silicon, which is essential for manufacturing efficient solar cells. The increasing number of solar energy installations driven by government incentives, corporate sustainability goals, and growing environmental awareness is boosting demand for HPQ further.
The need for high-quality materials to support solar cell production continues to rise as solar energy becomes a more significant part of the U.S. energy mix. This creates substantial opportunities for HPQ suppliers as they are integral to the supply chain of solar panel manufacturers. The growing adoption of solar power thus represents a promising avenue for expansion in the HPQ market with the potential for long-term and sustained demand.
Barrier Analysis - High Production Cost
The U.S. high purity quartz market faces several significant restraints, including high production costs and stringent environmental regulations. High production costs stem from the intricate and energy-intensive processes required to extract and refine HPQ to its exceptionally pure form. The need for specialized equipment, advanced technology, and rigorous quality control makes the production of HPQ expensive, which limits its affordability and accessibility for manufacturers.
Stringent Environmental Regulations
Strict environmental regulations further complicate the market. The extraction and processing of quartz often involve mining activities and chemical treatments, which are subject to strict regulations aimed at minimizing environmental impact. Compliance with these regulations can increase operational costs and create delays in production, impacting overall market growth.
Competitive Landscape
The U.S. high purity quartz (HPQ) market's competitive landscape is defined by a mix of established global players and specialized regional producers. All these players are competing in a high-demand environment driven by stringent quality standards, particularly in industries like semiconductors and renewable energy.
With high barriers to entry due to complex production processes and the need to meet strict industry specifications, the U.S. high purity quartz market is reliant on maintaining consistent quality to avoid impurities that could compromise end-product performance.
Competition revolves around technological advancements, cost management, and securing long-term contracts with key sectors. Companies are increasingly investing in research and development to enhance production efficiency and purity. Strategic partnerships and adherence to environmental regulations also play a vital role in gaining a competitive edge.
Companies Covered in U.S. High Purity Quartz Market
- The Quartz Corporation
- Sibelco
- High Purity Quartz Pty Ltd.
- Creswick Quartz
- Nordic Mining ASA
- Momentive Performance Materials Inc.
- Australian Silica Quartz Group Ltd.
- Fineton Development Limited
- Solar Quartz Technologies
Frequently Asked Questions
The U.S. high purity quartz market size is projected to reach US$195.8 Million in 2025.
High demand for HPQ from manufacturers of fiber optics is a key driver for market growth.
The U.S. high purity quartz market is poised to witness a CAGR of 5.8% from 2025 to 2032.
The key opportunity lies in developing and scaling sustainable, low-carbon, high-purity quartz (HPQ) production methods to meet rising demand from clean technology sectors and attract investments and regulatory support.
The Quartz Corporation, Sibelco, and Momentive Performance Chemicals, Inc. are some of the leading industry players.


