


- Nutraceuticals & Functional Foods
- Trail Mix Market
Trail Mix Market Size, Share, and Growth Forecast, 2025 - 2032
Trail Mix Market By Ingredient Type (Nuts and Seeds, Dried Fruits, Fruit and Nut), Flavor (Salted, Plain, Chocolate Coated), Packaging (Pouches and Sachets, Bottles and Jars), Distribution Channel (Supermarkets/Hypermarkets), and Regional Analysis for 2025 - 2032
Trail Mix Market Size and Trends Analysis
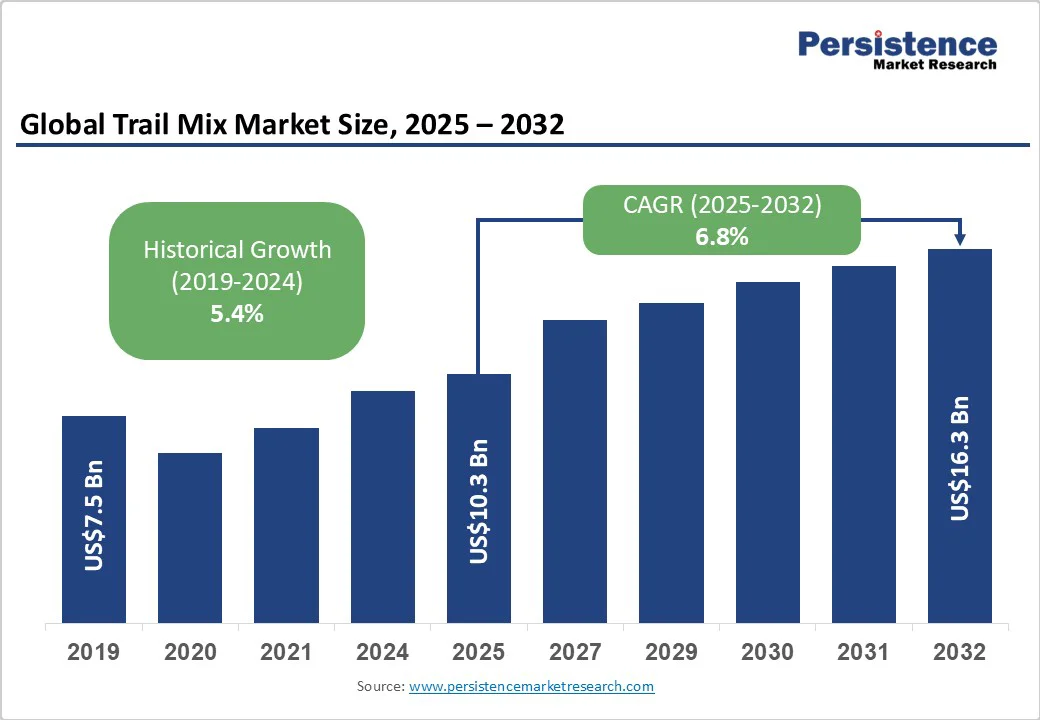
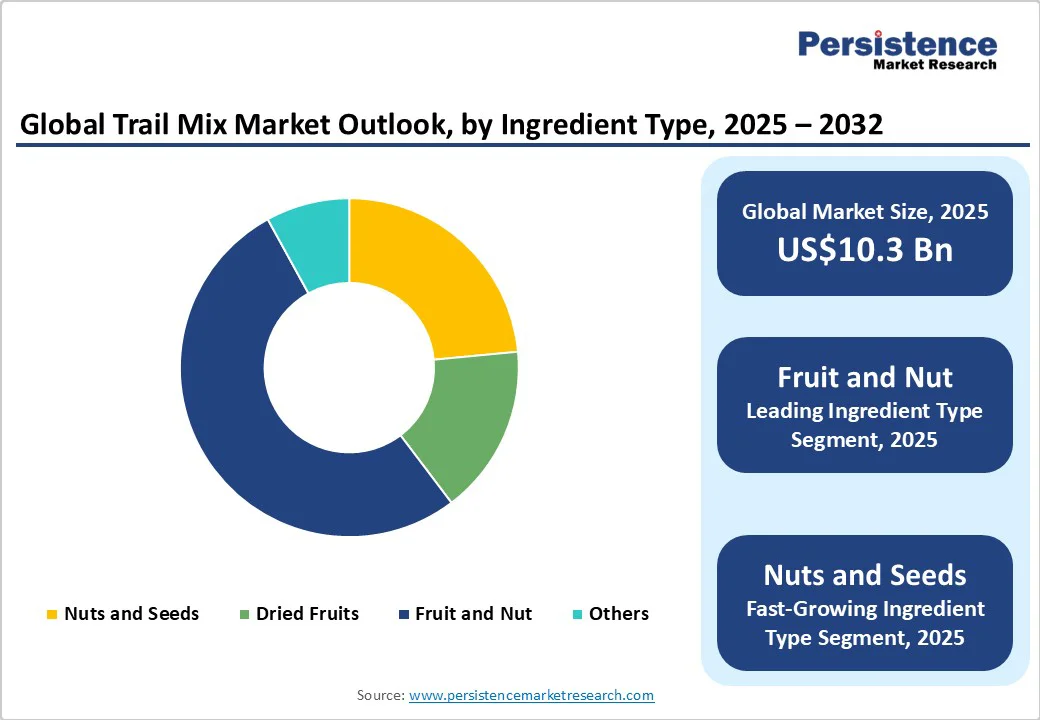
The global trail mix market size is likely to be valued at US$10.3 Bn in 2025. It is estimated to reach US$16.3 Bn in 2032, growing at a CAGR of 6.8% during the forecast period 2025 - 2032, driven by increased demand from health-conscious consumers for snacks that provide nutritional benefits without compromising on taste. The rise of plant-based diets and clean-label products also supports growth.
Key Industry Highlights:
- New Product Launch: World of Sweets recently unveiled new Trail Mix packs under its best-selling Bonds brand as part of a health-focused initiative, featuring three nutritious flavor combinations.
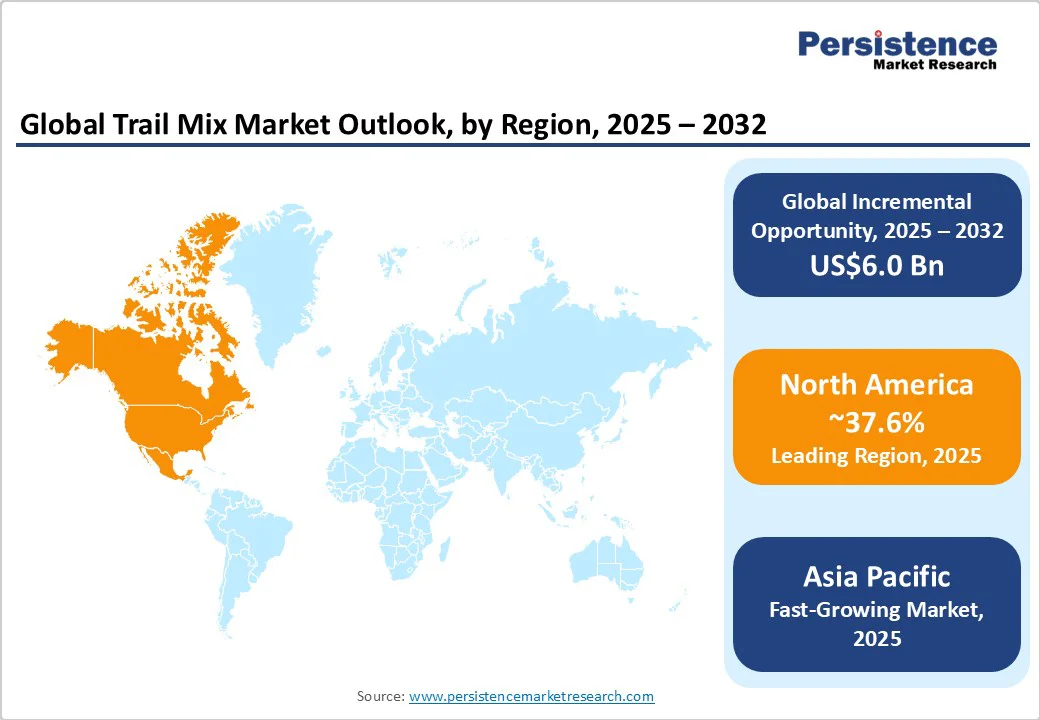
- Leading Region: North America, with about 37.6% share in 2025, owing to superior retail networks and evolving health trends.
- Fastest-growing Region: Asia Pacific, backed by surging interest in convenient and nutritious snacks among young demographics.
- Leading Ingredient Type: Fruit and nut holds nearly 52.3% share in 2025, due to its natural taste and energy-boosting properties.
- Dominant Flavor: Salted variants, approximately 33.7% of the trail mix market share in 2025, fueled by improved crunch and electrolyte replenishment properties.
- Key Packaging: Bottles and jars accounted for approximately 60.1% of the market share in 2025, as they are reusable and visually transparent.
| Key Insights | Details |
|---|---|
| Trail Mix Market Size (2025E) | US$10.3 Bn |
| Market Value Forecast (2032F) | US$16.3 Bn |
| Projected Growth (CAGR 2025 to 2032) | 6.8% |
| Historical Market Growth (CAGR 2019 to 2024) | 5.4% |
Market Factors - Growth, Barriers, and Opportunity Analysis
Growth Analysis - Preference for Low-sugar and Nutrient-rich Snacks
Consumers are conscious of sugar intake and diet quality, propelling demand for trail mixes that deliver natural sweetness from dried fruits without added sugars. Health-oriented trends, such as clean-label food and functional ingredients, are compelling manufacturers to develop mixes enriched with protein, fiber, and antioxidants.
For instance, brands such as KIND and Nature’s Garden have extended their low-sugar trail mix lines, exhibiting nutrient density on packaging to appeal to health-conscious buyers. Recent surveys indicate that over 60% of snack consumers globally now actively seek options with reduced sugar, making nutrient-packed trail mixes a preferred choice for guilt-free snacking.
Demand for On-the-go Nutrition among Busy Consumers
The rise of fast-paced lifestyles and remote work culture has made convenient and ready-to-eat snacks such as trail mixes essential for maintaining energy throughout the day. Trail mixes are lightweight, non-perishable, and easily packable, making them ideal for office workers, travelers, and fitness enthusiasts.
Companies such as Planters and Clif Bar have capitalized on this by delivering single-serve trail mix packs marketed as ‘fuel for busy days,’ often fortified with protein or electrolytes for added functional benefits. The global increase in on-the-go snacking, driven by a growing gym-going population and mobile professionals, has solidified trail mixes as a reliable snack option.
Barrier Analysis - Competition from More Affordable Snack Alternatives
Trail mixes often face resistance from price-sensitive consumers due to their higher cost compared with conventional snacks such as chips, cookies, or instant noodles. Several shoppers, especially in emerging markets, opt for inexpensive indulgent treats that provide immediate taste gratification, even if they lack nutritional benefits.
This price disparity tends to limit the adoption of trail mix among low-income segments, despite rising awareness of healthy eating. Brands such as PepsiCo’s snack portfolio have noted that when low-cost alternatives are heavily promoted, premium healthy snacks see slow uptake.
Impact of Climate Variability on Ingredient Supply
Trail mixes rely heavily on nuts, seeds, and dried fruits, which are highly sensitive to climate conditions. Unpredictable weather patterns, such as droughts in California affecting almond yields or excessive rainfall in Brazil impacting cashew production, can disrupt supply chains and increase raw material costs.
These climate-induced fluctuations not only raise retail prices but also create challenges in maintaining consistent quality and availability, discouraging regular consumer purchases. Recent reports indicate that global nut production volatility is already impacting the snack industry, prompting manufacturers to explore alternative sourcing strategies and ingredient substitutions.
Opportunity Analysis - Sustainable Packaging Improves Consumer Loyalty
The adoption of closed-loop recyclable pouches presents a key opportunity for trail mix brands to attract environmentally conscious consumers. Shoppers now prefer products with eco-friendly packaging, perceiving them as socially responsible and of higher quality. Brands such as NatureBox have introduced fully recyclable or compostable packaging, which not only reduces environmental impact but also strengthens brand trust and loyalty.
Studies show that over 70% of global consumers are more likely to buy from brands that demonstrate sustainability in packaging. By showing recyclable pouches on labels and marketing campaigns, companies can differentiate themselves in a crowded market.
Using Surplus Ingredients to Optimize Production Costs
Upcycling surplus or imperfect nuts, seeds, and dried fruits provides trail mix manufacturers with the dual benefits of cost reduction and waste minimization. Instead of discarding products that fail to meet retail standards, companies can incorporate them into mixes without compromising taste or nutrition.
Brands such as Graze and The Good Snack Company have embraced this approach, creating appealing snack blends while reducing raw material expenses. Beyond cost efficiency, this strategy resonates with eco-conscious consumers, turning a sustainability initiative into a marketing advantage.
Category-wise Analysis
Ingredient Type Insights
Fruit and nut blends are expected to account for approximately 52.3% of the market share in 2025, as they combine taste, nutrition, and convenience in a single snack. Consumers appreciate the balance of natural sweetness from dried fruits with the crunch and protein from nuts, making them satisfying and energizing. These blends are also being marketed as functional snacks, supporting heart health, digestive wellness, and sustained energy.
Nuts and seeds are anticipated to witness a CAGR of nearly 7.5% through 2032, owing to their recognized health benefits, including heart protection, improved immunity, and weight management support. Their versatility allows incorporation into trail mixes, breakfast bowls, and bakery products, expanding consumption occasions. Almonds, pumpkin seeds, and chia seeds are specifically popular due to their high protein, fiber, and omega-3 content.
Flavor Insights
Salted trail mixes are poised to hold a share of approximately 33.7% in 2025, as they provide a satisfying, savory flavor that appeals to a broad audience while helping to replenish electrolytes lost during physical activity. The combination of salt with roasted nuts or seeds improves taste and crunch, making them a go-to option for casual snacking and post-workout energy. Brands such as Planters and Wonderful Pistachios have expanded their salted and lightly salted lines to cater to this demand.
Chocolate-coated mixes are anticipated to exhibit a CAGR of around 7.3% in the foreseeable future as consumers demand indulgent yet nutrient-rich snacks that satisfy sweet cravings without compromising on nutrition. Coating nuts and dried fruits with dark or milk chocolate adds appeal through taste and visual presentation, making them popular for gifting or premium snacking occasions. The trend is strong among millennials and Gen Z, who prioritize experiential snacking that blends health and pleasure.
Packaging Insights
Bottles and jars accounted for approximately 60.1% of the market share in 2025, as they offer durability, reusability, and a premium feel, making them appealing for home storage and gifting purposes. Transparent jars enable consumers to see the product, which fosters trust in its quality and freshness.
Brands such as Blue Diamond often use glass or PET jars for large pack sizes, which promotes convenience for families or long-term use. Additionally, jars help preserve crunchiness and prevent moisture ingress, which is essential for nuts and dried fruits.
Pouches and sachets are predicted to record a CAGR of nearly 6.9% from 2025 to 2032, backed by their portability, lightweight design, and single-serve convenience. They cater perfectly to on-the-go lifestyles, allowing consumers to carry trail mixes to work, gyms, or travel without extra bulk.
Emerging brands have popularized resealable pouches that maintain freshness while delivering flexible portion sizes. Eco-conscious variations, such as recyclable or compostable pouches, are also attracting millennial consumers.
Regional Insights
North America Trail Mix Market Trends
North America is expected to account for approximately 37.6% of the market share in 2025, driven by a combination of health consciousness, convenience, and evolving consumer preferences. Consumer demand is shifting toward healthy and functional snacks. This has led to the proliferation of trail mixes featuring organic, gluten-free, and plant-based ingredients.
Brands are innovating with unique flavor combinations and premium inclusions such as dark chocolate, exotic dried fruits, and superfoods to cater to diverse taste profiles. The rise of e-commerce has further bolstered trail mix consumption. Online retail channels are experiencing steady growth, augmented by the convenience of doorstep delivery and the ability to explore a wide variety of products.
Asia Pacific Trail Mix Market Trends
Asia Pacific is estimated to witness a CAGR of about 7.4% through 2032 due to increasing health awareness, urbanization, and a shift toward convenient, nutritious snacks. India, China, and Japan are at the forefront of this expansion. In India, local brands such as Nutty Yogi and Snackible are gaining popularity by delivering trail mixes that incorporate traditional ingredients, including makhanas and spices, catering to local tastes while promoting health benefits.
Similarly, in China, the rising middle class and surging disposable incomes are contributing to high spending on premium food products, including trail mixes. In Japan, the emphasis is on superior-quality ingredients and novel flavors, catering to the country's culinary preferences. This regional trend reflects a broad movement toward healthy snacking options that comply with modern lifestyles.
Europe Trail Mix Market Trends
Europe’s market is experiencing steady growth backed by rising health-conscious consumers, increased demand for convenient snacking options, and a preference for sustainable packaging. The U.K., Germany, and France are at the forefront of this trend, with consumers seeking snacks that comply with their active lifestyles and dietary preferences.
The market is further characterized by a diverse range of products, including organic, gluten-free, and plant-based trail mixes, catering to the varied tastes and nutritional requirements of modern consumers. Brands are innovating with unique flavor combinations and premium ingredients to differentiate themselves in a competitive market. Retailers are also expanding their product lines to include trail mixes in various formats such as single-serve packs and resealable pouches.
Competitive Landscape
The global trail mix market consists of various established snack giants and emerging start-ups, each vying for consumer attention through product differentiation, strategic partnerships, and targeted marketing. Key players such as General Mills, PepsiCo, Mars, and The J.M. Smucker Company dominate with their extensive distribution networks and brand recognition.
These companies often utilize their existing portfolios to introduce trail mix products that cater to current health trends such as high-protein, low-sugar, or plant-based options. Emerging brands focus on specific dietary requirements, sustainability, and unique flavor profiles.
Business Strategies
Trail mix companies focus on innovation, cost leadership, and geographic expansion. Leading brands differentiate through new flavors, functional ingredients, and sustainable packaging. Emerging trends include direct-to-consumer subscriptions, personalized mix options, and eco-conscious sourcing. These allow established and niche players to capture health-conscious, convenience-seeking consumers while improving brand loyalty and market reach.
Key Industry Developments
- In September 2025, PLANTERS introduced PLANTERS White Chocolate Macadamia Nut and PLANTERS Chocolate Caramel Pecan Crunch. These two mixes were developed to elevate the snacking experience, one delicious handful at a time.
- In April 2025, Kar’s Nuts and Dunkin’ joined hands to launch a pair of limited-edition trail mixes inspired by Dunkin’s signature flavors, Caramel Cold Brew and Frosted Donut with Sprinkles. The new products are aimed at coffee fans, featuring roasted salted peanuts, butter toffee peanuts, and pink, orange, and white cocoa candies.
Companies Covered in Trail Mix Market
- PepsiCo Inc.
- General Mills, Inc.
- Hormel Foods Corporation
- Mars, Incorporated
- Texas Star Nut & Food Co.
- Kellonova
- Creative Snacks Co.
- Oberto Snacks Inc.
- Whitworths
- The J.M. Smucker Company
- CapVest Ltd. (Second Nature Brands)
- KIND LLC
- Nestle S.A.
- Mondelez International
- Mouth Foods
- National Raisin Company
- Orchard Bars (Liberty Orchards)
- Trader Joe's Co.
- Happilo
- Sahale Snacks
Frequently Asked Questions
The trail mix market is projected to reach US$10.3 Bn in 2025.
Rising health consciousness and the surging demand for nutrient-dense snacks are the key market drivers.
The trail mix market is poised to witness a CAGR of 6.8% from 2025 to 2032.
Emergence of sustainable packaging and use of upcycled ingredients are the key market opportunities.
Key players in the trail mix market include PepsiCo Inc., General Mills, Inc., and Hormel Foods Corporation.


