PET Radioactive Tracers Market Size, Share, and Growth Forecast for 2025 - 2032

PET Radioactive Tracers Market by Product (F-18 [Florbetapir, Florbetaben, Flutemetamol, Fludeoxyglucose, Sodium Fluoride], by Application (Neurological Disorders [Alzheimer’s Disease, Dementia], Cancer Diagnosis & Prognosis [Solid Tumors, Hematology Tumors], Cardiac Dysfunctions [Myocardial Infarction], Infectious Disease Diagnosis), and Regional Analysis

ID: PMRREP33446
Calendar

July 2025

359 Pages

Author : Abhijeet Surwase

PET Radioactive Tracers Market Size and Share Analysis

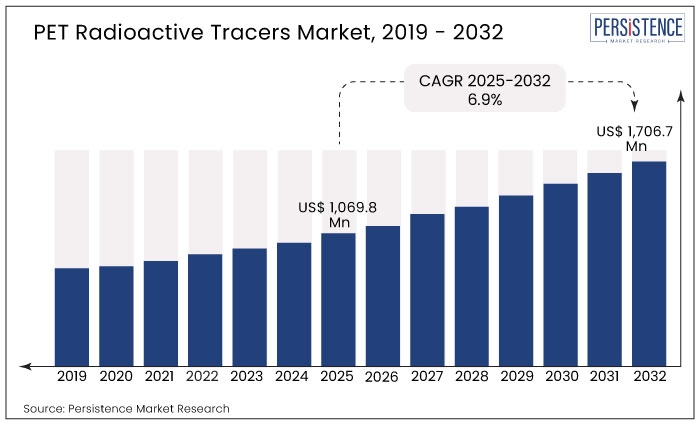
The global PET radioactive tracers market expanded at a CAGR of 4.5% from 2019 to 2024 and reached US$ 1,023.70 million in 2024. The market is forecasted to evolve at a CAGR of 6.9% to reach US$ 1,706.7 billion by the end of 2032.

Radioactive tracers, also known as radiotracers or radiopharmaceuticals, are substances used in medical imaging to help locate the diseased area before further treatment procedures. These tracers contain a small amount of a radioactive substance, which emits radiation that can be detected by specialized imaging equipment such as single-photon emission computed tomography (SPECT) and positron emission tomography (PET) scanners.

  • Product-grade-based F-18 tracers accounted for a market share of 39.9% in 2024.
  • Sales of PET radioactive tracers accounted for 14% share of the global radiopharmaceutical market in 2024.

In recent years, there have been several new radiopharmaceuticals approved by regulatory authorities such as the European Medicines Agency (EMA) and the United States Food and Drug Administration (FDA). These products have been developed for a range of applications, including cancer imaging and therapy, neurological disorders, and cardiology.

  • For example, Lantheus obtained clearance from the FDA in May 2021 for the use of PYLARIFY® (piflufolastat F 18) Injection as a PET imaging agent for prostate cancer.

Gallium-68 has found extensive usage in nuclear medicine, especially in the diagnosis and evaluation of prostate cancer. The advancement heavily depends on the integration of various technological advancements and the introduction of a new radiotracer called 68Ga-PSMA-11, which was developed by the University of Heidelberg. The marketing authorization of the first 68Ge/68Ga generator, manufactured by the German manufacturer Eckert & Ziegler, has also positively impacted the penetration of the 68Ga-PSMA-11 tracer in the treatment of prostate cancer.

  • Despite its shorter half-life, 68Ga has an ideal profile as a PET imaging agent. Several manufacturers are focusing on the introduction of cold kits for 68Ga labeling tracers (ANMI, Belgium), opening the gateways for 68Ga in PET.

Continuous development of radiopharmaceuticals and their use in nuclear medicine research for cancer diagnosis, along with the increasing prevalence of cancer, are some of the key factors driving the growth of the PET radioactive tracers market.

pet radioactive tracers market 2019-2032

Report Attribute Details

Global PET Radioactive Tracers Market Size (2025)

US$ 1,069.8 Million

Projected Market Value (2032)

US$ 1,706.7 Million

Market Growth Rate (2025 to 2032)

6.9% CAGR

Market Share of Top 5 Countries

51.8%

What are the Factors Influencing the Demand for PET Radioactive Tracers?

Increasing Prevalence of Cancer Worldwide Driving Need for PET Radioactive Tracers

Cancer is a complex disease, and accurate diagnosis and effective treatment often require the use of advanced imaging techniques, such as SPECT and PET. These imaging techniques use radiopharmaceuticals, or radioactive tracers, to detect and visualize cancerous tissues.

As the incidence of cancer continues to rise, the demand for these imaging techniques is also increasing.

  • According to the World Health Organization (WHO), cancer is the second leading cause of death worldwide, and it is estimated that there will be 27.5 million new cases of cancer each year by 2040.

This growing prevalence of cancer is creating a significant demand for radiopharmaceuticals, including radioactive tracers, which are essential for accurate diagnosis and effective treatment.

Radiopharmaceuticals are essential for nuclear medicine imaging procedures such as SPECT and PET. Many countries rely on imported radiopharmaceuticals for these procedures, which can lead to supply chain problems, delays, and higher costs. Radiopharmaceutical manufacturers are currently focusing on increasing their domestic radioisotope production to generate higher revenues.

  • A manufacturing facility operated by the Oak Ridge National Laboratory (ORNL) in the United States produces, purifies, and supplies more than 300 stable and radioactive isotopes that are used in medical, research, industrial, and space exploration applications.

Governments and private companies are investing in building domestic radiopharmaceutical production facilities. These facilities can produce a wide range of radiopharmaceuticals, ensuring a reliable and stable supply of products.

Increasing domestic radiopharmaceutical production will not only ensure a reliable and stable supply of radiopharmaceuticals for nuclear medicine imaging, but will also create jobs, facilitate access to healthcare, and improve healthcare outcomes.

What’s Hindering the Adoption of PET Radioactive Tracers?

“Limited Imaging Time Offered by PET Radioactive Tracers Due to Their Shorter Half-life

Radiopharmaceuticals are radioisotopes with shorter half-lives due to their limited shelf life. Radiopharmaceuticals with shorter half-lives provide limited imaging time, which may be insufficient for some imaging protocols. This can be a challenge for imaging procedures that require longer imaging times, such as some dynamic PET studies.

The shorter half-life of radiopharmaceuticals can lead to decreased image quality, as the radiotracer may not have sufficient time to accumulate in the target tissue. This may result in images that are less clear and more difficult to interpret.

Radiopharmaceuticals with shorter half-lives may not be available in all imaging centers or hospitals, limiting their use in some clinical settings.

Country-wise Insights

What Makes the United States a Lucrative Market for Producers of PET Radioactive Tracers?

“Increasing Utilization of PET Scanning Boosting Demand for Radiopharmaceuticals”

The United States dominated the North American PET radioactive tracers market in 2024 with a revenue of US$ 310.57 million.

Use of PET scanning has grown significantly in the United States over the past decade. PET scans are commonly used in oncology to detect, stage, and monitor cancer, as well as in neurology to diagnose and track the progression of Alzheimer's and other neurological disorders.

  • According to a report by the National Institutes of Health (NIH), the number of PET scans performed in the country increased from 200,000 in 1996 to 2 million in 2017.

How is Demand for PET Radioactive Tracers Shaping Up in China?

“Increasing Investments in Development of Advanced Cyclotron Facilities to Enhance Radioactive Isotope Production”

China held 48.8% share of the East Asia market in 2024. The country has made significant investments in the development of cyclotron facilities and in enhancing its radioactive tracer production capabilities in recent years, with several facilities located in cities such as Beijing, Shanghai, and Guangzhou. These facilities produce a range of radioactive isotopes for medical imaging applications, including fluorine-18, carbon-11, and oxygen-15.

  • One of the advanced cyclotron facilities in China is the Beijing Cyclotron Center, which is operated by the Chinese Academy of Engineering Physics. This facility has multiple cyclotrons capable of producing a range of isotopes for medical imaging, including fluorine-18 and carbon-11.

What is the Demand Outlook for PET Radioactive Tracers in Germany?

“Growing Burden of Neurological Disorders in the Country”

Germany held 27.8% of the Western Europe market share in 2024. Neurological disorders, such as Alzheimer's disease, Parkinson's disease, and stroke, are a significant health burden in Germany, affecting millions of people each year.

Use of PET-CT imaging in the diagnosis and management of neurological disorders in Germany reflects a growing recognition of the importance of advanced medical imaging technologies in the field of neurology and a commitment to improving the care and outcomes for patients with these conditions.

pet radioactive tracers market by region 2019-2032

Category-wise Insights

Which PET Radioactive Tracer Accounts for High Demand?

“High Demand for F-18 Tracers Due to Their Short Half-life Reducing Patients’ Radiation Exposure Time”

Fluorine-18 (F18) radioactive tracers held 39.9% share of the global market in 2024.

Fluorine-18 (F18) is a commonly used radioactive tracer in nuclear medicine. F18 is an isotope of fluorine that is routinely used in radiolabeling of biomolecules in PET. The fluorine-18 (F18) radioactive tracer is widely used in PET scans due to its short half-life of approximately 110 minutes, making it well-suited for imaging studies without prolonged exposure to patients. The fluorine-18 (F18) radioactive tracer currently holds a significant share of the global market.

Which Application Occupies a Dominant Share of the Market?

“Rising Awareness about Early Cancer Detection Driving Sales of Radioactive Tracers from Cancer Diagnosis & Prognosis Segment”

The cancer diagnosis & prognosis segment held 45.4% share of the market in 2024.

Radioactive tracers are extensively used for cancer diagnosis because they allow for the detection of cancerous tissues at an early stage, which can improve patient outcomes. They help differentiate between malignant and benign tumors, which is important for determining the appropriate treatment plan. Accurate detection and localization of cancerous tissues, even at early stages when they may not be visible on other imaging modalities, is a key factor for the cancer diagnosis & prognosis segment holding a dominant share of the market.

Competition Landscape

The PET radioactive tracers market is highly consolidated with few market players active within this space. Companies are investing significant efforts in expanding their foothold in emerging markets while also maintaining their relationships with existing distributors. They are also exploring options such as acquisitions, mergers, and partnerships with key players in the market to achieve their growth objectives.

Some key instances of this development include:

  • In Sep 2022, the FDA accepted Blue Earth Diagnostics’ new drug application for a PET imaging agent, called 18F-rhPSMA-7.3. This drug is a radiohybrid PSMA (prostate-specific membrane antigen) for diagnostic imaging of prostate cancer.
  • In March 2022, Cardinal Health announced its plans to construct a medical distribution center in Ohio in the United States to enhance its offerings.

The team at Persistence Market Research has tracked recent developments related to companies manufacturing PET radioactive tracers, which are available in the full report.

Companies Covered in PET Radioactive Tracers Market

  • Eli Lilly and Company
  • Blue Earth Diagnostics
  • Lantheus
  • Siemens Healthcare Private Limited
  • GE Healthcare
  • Advanced Accelerator Applications (Novartis)
  • University of Lowa HealthCare
  • Telix Pharmaceuticals Limited
  • Jubilant Radiopharma
  • TRASIS
  • RadioMedix Inc.
  • IBA Radiopharma Solutions
  • Piramal Imaging (Life Molecular Imaging)
  • Cardinal Health
  • DuchemBio, Co., Ltd
Frequently Asked Questions

The market reached US$ 1,023.7 million in 2024.

The market is forecasted to reach US$ 1,706.7 million by 2032.

The market is projected to grow at a 6.9% CAGR during this period.

They are used in medical imaging to detect diseases, especially in cancer, neurology, and cardiology.

PET tracers accounted for 14% of the global radiopharmaceutical market in 2024.

F-18 tracers held the highest share, accounting for 39.9% of the market.

PET Radioactive Tracers Industry Report Scope
Attribute Details

Forecast Period

2023 to 2033

Historical Data Available for

2018 to 2022

Market Analysis

US$ Million/Billion for Value

Key Countries Covered

  • United States
  • Canada
  • Brazil
  • Argentina
  • Mexico
  • Germany
  • France
  • United Kingdom
  • Italy
  • Spain
  • Nordic Countries
  • Benelux
  • Poland
  • Hungary
  • Romania
  • Czech Republic
  • Russia & Belarus
  • Central Asia
  • Balkan & Baltic Countries
  • India
  • Thailand
  • Malaysia
  • Indonesia
  • Philippines
  • Vietnam
  • China
  • Japan
  • South Korea
  • Australia & New Zealand
  • Türkiye
  • GCC Countries
  • Northern Africa
  • Israel
  • Kingdom of Saudi Arabia
  • South Africa

Key Market Segments Covered

  • Product
  • Application
  • End User
  • Region

Key Companies Covered

  • Eli Lilly and Company
  • Blue Earth Diagnostics
  • Lantheus
  • Siemens Healthcare Private Limited
  • GE Healthcare
  • Advanced Accelerator Applications (Novartis)
  • University of Lowa HealthCare
  • Telix Pharmaceuticals Limited
  • Jubilant Radiopharma
  • TRASIS
  • RadioMedix Inc.
  • IBA Radiopharma Solutions
  • Piramal Imaging (Life Molecular Imaging)
  • Cardinal Health
  • DuchemBio, Co. Ltd.

Report Coverage

  • Market Forecast
  • Competition Intelligence
  • DROT Analysis
  • Market Dynamics and Challenges
  • Strategic Growth Initiatives

Customization & Pricing

Available upon Request

Key Segments of PET Radioactive Tracers Industry Research

Product:

  • F-18
    • Florbetapir
    • Florbetaben
    • Flutemetamol
    • Fludeoxyglucose
    • Sodium Fluoride
    • Others
  • C-11
    • Choline
    • Methionine
    • Others
  • Ga-68
    • DOTA-TOC
    • DOTATATE
    • DOTANOC
    • Others
  • O-15
  • N-13
  • Cu-64

Application:

  • Neurological Disorders
    • Alzheimer’s Disease
    • Dementia
    • Others
  • Cancer Diagnosis & Prognosis
    • Solid Tumors
    • Hematology Tumors
  • Cardiac Dysfunctions
    • Myocardial Infarction
    • Others
  • Infectious Disease Diagnosis
  • Others

End User:

  • Hospitals
  • Speciality Diagnostic Centers
  • Cancer Research Centers
  • Academic & Research Institutes

Region:

  • North America
  • Latin America
  • East Asia
  • South Asia & Pacific
  • Western Europe
  • Eastern Europe
  • Central Asia
  • Russia & Belarus
  • Balkan & Baltic Countries
  • Middle East & Africa

Related Reports

1. Executive Summary

    1.1. Global Market Outlook

    1.2. Demand Side Trends

    1.3. Supply Side Trends

    1.4. Analysis and Recommendations

2. Market Overview

    2.1. Market Coverage / Taxonomy

    2.2. Market Definition / Scope / Limitations

    2.3. Inclusion and Exclusions

3. Key Market Trends

    3.1. Key Trends Impacting the Market

    3.2. Innovation / Development Trends

4. Key Success Factors

    4.1. PET Scanner Installed Base Scenario

    4.2. Number of PET Scans, By Country

    4.3. Disease Epidemiology

    4.4. Product Adoption/Usage Analysis

    4.5. Regulatory Approval Pathway

    4.6. Reimbursement Scenario

    4.7. Technology Advancements

    4.8. Good Manufacturing Practice (cGMP)

    4.9. Value Chain Analysis

    4.10. Quality Standards/Accreditations

    4.11. PESTEL Analysis

    4.12. Porter’s Analysis

5. Market Background

    5.1. Macro-Economic Factors

        5.1.1. Global GDP Outlook

        5.1.2. Global Healthcare Expenditure Outlook

        5.1.3. Oncology Spending

    5.2. Forecast Factors - Relevance & Impact

        5.2.1. Development of Novel Products

        5.2.2. Regulatory Imposition

        5.2.3. Increasing Spending on Targeted Therapies

        5.2.4. Increasing Prevalence of Cancer

        5.2.5. Strategic Mergers and Acquisitions among Local Players

        5.2.6. Rising Awareness towards Development of Disease

    5.3. Market Dynamics

        5.3.1. Drivers

        5.3.2. Restraints

        5.3.3. Opportunity Analysis

6. COVID-19 Crisis Analysis

    6.1. 2021 Market Scenario

    6.2. COVID-19 and Impact Analysis

        6.2.1. By Product

        6.2.2. By Application

        6.2.3. By End User

        6.2.4. By Region

7. Global Market Demand (in Value or Size in US$ Mn) Analysis 2019–2024 and Forecast, 2025–2032

    7.1. Historical Market Value (US$ Mn) Analysis, 2019–2024

    7.2. Current and Future Market Value (US$ Mn) Projections, 2025–2032

        7.2.1. Y-o-Y Growth Trend Analysis

        7.2.2. Absolute $ Opportunity Analysis

8. Global Market Analysis 2019–2024 and Forecast 2025–2032, By Product

    8.1. Introduction / Key Findings

    8.2. Historical Market Size (US$ Mn) Analysis By Product, 2019–2024

    8.3. Current and Future Market Size (US$ Mn) Analysis and Forecast By Product, 2025–2032

        8.3.1. F-18

            8.3.1.1. Florbetapir

            8.3.1.2. Florbetaben

            8.3.1.3. Flutemetamol

            8.3.1.4. Fludeoxyglucose

            8.3.1.5. Sodium Fluoride

            8.3.1.6. Others

        8.3.2. C-11

            8.3.2.1. Choline

            8.3.2.2. Methionine

            8.3.2.3. Others

        8.3.3. Ga-68

            8.3.3.1. DOTA-TOC

            8.3.3.2. DOTATATE

            8.3.3.3. DOTANOC

            8.3.3.4. Others

        8.3.4. O-15

        8.3.5. N-13

        8.3.6. Cu-64

    8.4. Market Attractiveness Analysis By End User

9. Global Market Analysis 2019–2024 and Forecast 2025–2032, By Application

    9.1. Introduction / Key Findings

    9.2. Historical Market Size (US$ Mn) Analysis By Application, 2019–2024

    9.3. Current and Future Market Size (US$ Mn) Analysis and Forecast By Application, 2025–2032

        9.3.1. Neurological Disorders

            9.3.1.1. Alzheimer’s Disease

            9.3.1.2. Dementia

            9.3.1.3. Others

        9.3.2. Cancer Diagnosis & Prognosis

            9.3.2.1. Solid Tumor

            9.3.2.2. Hematology Tumor

        9.3.3. Cardiac Dysfunctions

            9.3.3.1. Myocardial Infarction

            9.3.3.2. Others

        9.3.4. Infectious disease Diagnosis

        9.3.5. Others

    9.4. Market Attractiveness Analysis By End User

10. Global Market Analysis 2019–2024 and Forecast 2025–2032, By End User

    10.1. Introduction / Key Findings

    10.2. Historical Market Size (US$ Mn) Analysis By End User, 2019–2024

    10.3. Current and Future Market Size (US$ Mn) Analysis and Forecast By End User, 2025–2032

        10.3.1. Hospitals

        10.3.2. Speciality Diagnostic Centers

        10.3.3. Cancer Research Centers

        10.3.4. Academic & Research Institutes

    10.4. Market Attractiveness Analysis By End User

11. Global Market Analysis 2019–2024 and Forecast 2025–2032, By Region

    11.1. Introduction

    11.2. Historical Market Size (US$ Mn) Analysis By Region, 2019–2024

    11.3. Current and Future Market Size (US$ Mn) Analysis and Forecast By Region, 2025–2032

        11.3.1. North America

        11.3.2. Latin America

        11.3.3. East Asia

        11.3.4. South Asia & Pacific

        11.3.5. Western Europe

        11.3.6. Eastern Europe

        11.3.7. Central Asia

        11.3.8. Russia & Belarus

        11.3.9. Balkan & Baltic Countries

        11.3.10. Middle East & Africa

    11.4. Market Attractiveness Analysis By Region

12. North America Market Analysis 2019–2024 and Forecast 2025–2032

    12.1. Introduction

    12.2. Historical Market Size (US$ Mn) Trend Analysis By Market Taxonomy, 2019–2024

    12.3. Current and Future Market Size (US$ Mn) Analysis and Forecast By Market Taxonomy, 2025–2032

        12.3.1. By Country

            12.3.1.1. U.S.

            12.3.1.2. Canada

        12.3.2. By Product

        12.3.3. By Application

        12.3.4. By End User

    12.4. Market Attractiveness Analysis

        12.4.1. By Country

        12.4.2. By Product

        12.4.3. By Application

        12.4.4. By End User

    12.5. Key Market Trends

    12.6. Drivers and Restraints - Impact Analysis

    12.7. Key Players - Intensity Mapping

    12.8. Country Level Analysis & Forecast

        12.8.1. U.S. Market

            12.8.1.1. Introduction

            12.8.1.2. Market Analysis and Forecast by Market Taxonomy

                12.8.1.2.1. By Product

                12.8.1.2.2. By Application

                12.8.1.2.3. By End User

        12.8.2. Canada Market

            12.8.2.1. Introduction

            12.8.2.2. Market Analysis and Forecast by Market Taxonomy

                12.8.2.2.1. By Product

                12.8.2.2.2. By Application

                12.8.2.2.3. By End User

13. Latin America Market Analysis 2019–2024 and Forecast 2025–2032

    13.1. Introduction

    13.2. Historical Market Size (US$ Mn) Trend Analysis By Market Taxonomy, 2019–2024

    13.3. Current and Future Market Size (US$ Mn) Analysis and Forecast By Market Taxonomy, 2025–2032

        13.3.1. By Country

            13.3.1.1. Brazil

            13.3.1.2. Argentina

            13.3.1.3. Mexico

            13.3.1.4. Rest of Latin America

        13.3.2. By Product

        13.3.3. By Application

        13.3.4. By End User

    13.4. Market Attractiveness Analysis

        13.4.1. By Country

        13.4.2. By Product

        13.4.3. By Application

        13.4.4. By End User

    13.5. Key Market Trends

    13.6. Drivers and Restraints - Impact Analysis

    13.7. Key Players - Intensity Mapping

    13.8. Country Level Analysis & Forecast

        13.8.1. Brazil Market

            13.8.1.1. Introduction

            13.8.1.2. Market Analysis and Forecast by Market Taxonomy

                13.8.1.2.1. By Product

                13.8.1.2.2. By Application

                13.8.1.2.3. By End User

        13.8.2. Argentina Market

            13.8.2.1. Introduction

            13.8.2.2. Market Analysis and Forecast by Market Taxonomy

                13.8.2.2.1. By Product

                13.8.2.2.2. By Application

                13.8.2.2.3. By End User

        13.8.3. Mexico Market

            13.8.3.1. Introduction

            13.8.3.2. Market Analysis and Forecast by Market Taxonomy

                13.8.3.2.1. By Product

                13.8.3.2.2. By Application

                13.8.3.2.3. By End User

14. East Asia Market Analysis 2019–2024 and Forecast 2025–2032

    14.1. Introduction

    14.2. Historical Market Size (US$ Mn) Trend Analysis By Market Taxonomy, 2019–2024

    14.3. Current and Future Market Size (US$ Mn) Analysis and Forecast By Market Taxonomy, 2025–2032

        14.3.1. By Country

            14.3.1.1. China

            14.3.1.2. Japan

            14.3.1.3. South Korea

        14.3.2. By Product

        14.3.3. By Application

        14.3.4. By End User

    14.4. Market Attractiveness Analysis

        14.4.1. By Country

        14.4.2. By Product

        14.4.3. By Application

        14.4.4. By End User

    14.5. Key Market Trends

    14.6. Drivers and Restraints - Impact Analysis

    14.7. Key Players - Intensity Mapping

    14.8. Country Level Analysis & Forecast

        14.8.1. China Market

            14.8.1.1. Introduction

            14.8.1.2. Market Analysis and Forecast by Market Taxonomy

                14.8.1.2.1. By Product

                14.8.1.2.2. By Application

                14.8.1.2.3. By End User

        14.8.2. Japan Market

            14.8.2.1. Introduction

            14.8.2.2. Market Analysis and Forecast by Market Taxonomy

                14.8.2.2.1. By Product

                14.8.2.2.2. By Application

                14.8.2.2.3. By End User

        14.8.3. South Korea Market

            14.8.3.1. Introduction

            14.8.3.2. Market Analysis and Forecast by Market Taxonomy

                14.8.3.2.1. By Product

                14.8.3.2.2. By Application

                14.8.3.2.3. By End User

15. South Asia & Pacific Market Analysis 2019–2024 and Forecast 2025–2032

    15.1. Introduction

    15.2. Historical Market Size (US$ Mn) Trend Analysis By Market Taxonomy, 2019–2024

    15.3. Current and Future Market Size (US$ Mn) Analysis and Forecast By Market Taxonomy, 2025–2032

        15.3.1. By Country

            15.3.1.1. India

            15.3.1.2. Indonesia

            15.3.1.3. Thailand

            15.3.1.4. Philippines

            15.3.1.5. Malaysia

            15.3.1.6. Vietnam

            15.3.1.7. Rest of ASEAN

            15.3.1.8. Australia & New Zealand

        15.3.2. By Product

        15.3.3. By Application

        15.3.4. By End User

    15.4. Market Attractiveness Analysis

        15.4.1. By Country

        15.4.2. By Product

        15.4.3. By Application

        15.4.4. By End User

    15.5. Key Market Trends

    15.6. Drivers and Restraints - Impact Analysis

    15.7. Key Players - Intensity Mapping

    15.8. Country Level Analysis & Forecast

        15.8.1. India Market

            15.8.1.1. Introduction

            15.8.1.2. Market Analysis and Forecast by Market Taxonomy

                15.8.1.2.1. By Product

                15.8.1.2.2. By Application

                15.8.1.2.3. By End User

        15.8.2. Indonesia Market

            15.8.2.1. Introduction

            15.8.2.2. Market Analysis and Forecast by Market Taxonomy

                15.8.2.2.1. By Product

                15.8.2.2.2. By Application

                15.8.2.2.3. By End User

        15.8.3. Thailand Market

            15.8.3.1. Introduction

            15.8.3.2. Market Analysis and Forecast by Market Taxonomy

                15.8.3.2.1. By Product

                15.8.3.2.2. By Application

                15.8.3.2.3. By End User

        15.8.4. Philippines Market

            15.8.4.1. Introduction

            15.8.4.2. Market Analysis and Forecast by Market Taxonomy

                15.8.4.2.1. By Product

                15.8.4.2.2. By Application

                15.8.4.2.3. By End User

        15.8.5. Malaysia Market

            15.8.5.1. Introduction

            15.8.5.2. Market Analysis and Forecast by Market Taxonomy

                15.8.5.2.1. By Product

                15.8.5.2.2. By Application

                15.8.5.2.3. By End User

        15.8.6. Vietnam Market

            15.8.6.1. Introduction

            15.8.6.2. Market Analysis and Forecast by Market Taxonomy

                15.8.6.2.1. By Product

                15.8.6.2.2. By Application

                15.8.6.2.3. By End User

        15.8.7. Australia & New Zealand Market

            15.8.7.1. Introduction

            15.8.7.2. Market Analysis and Forecast by Market Taxonomy

                15.8.7.2.1. By Product

                15.8.7.2.2. By Application

                15.8.7.2.3. By End User

16. Western Europe Market Analysis 2019–2024 and Forecast 2025–2032

    16.1. Introduction

    16.2. Historical Market Size (US$ Mn) Trend Analysis By Market Taxonomy, 2019–2024

    16.3. Current and Future Market Size (US$ Mn) Analysis and Forecast By Market Taxonomy, 2025–2032

        16.3.1. By Country

            16.3.1.1. Germany

            16.3.1.2. France

            16.3.1.3. Spain

            16.3.1.4. Italy

            16.3.1.5. BENELUX

            16.3.1.6. Nordic Countries

            16.3.1.7. United Kingdom

        16.3.2. By Product

        16.3.3. By Application

        16.3.4. By End User

    16.4. Market Attractiveness Analysis

        16.4.1. By Country

        16.4.2. By Product

        16.4.3. By Application

        16.4.4. By End User

    16.5. Key Market Trends

    16.6. Drivers and Restraints - Impact Analysis

    16.7. Key Players - Intensity Mapping

    16.8. Country Level Analysis & Forecast

        16.8.1. Germany Market

            16.8.1.1. Introduction

            16.8.1.2. Market Analysis and Forecast by Market Taxonomy

                16.8.1.2.1. By Product

                16.8.1.2.2. By Application

                16.8.1.2.3. By End User

        16.8.2. France Market

            16.8.2.1. Introduction

            16.8.2.2. Market Analysis and Forecast by Market Taxonomy

                16.8.2.2.1. By Product

                16.8.2.2.2. By Application

                16.8.2.2.3. By End User

        16.8.3. Spain Market

            16.8.3.1. Introduction

            16.8.3.2. Market Analysis and Forecast by Market Taxonomy

                16.8.3.2.1. By Product

                16.8.3.2.2. By Application

                16.8.3.2.3. By End User

        16.8.4. Italy Market

            16.8.4.1. Introduction

            16.8.4.2. Market Analysis and Forecast by Market Taxonomy

                16.8.4.2.1. By Product

                16.8.4.2.2. By Application

                16.8.4.2.3. By End User

        16.8.5. BENULUX Market

            16.8.5.1. Introduction

            16.8.5.2. Market Analysis and Forecast by Market Taxonomy

                16.8.5.2.1. By Product

                16.8.5.2.2. By Application

                16.8.5.2.3. By End User

        16.8.6. Nordic Countries Market

            16.8.6.1. Introduction

            16.8.6.2. Market Analysis and Forecast by Market Taxonomy

                16.8.6.2.1. By Product

                16.8.6.2.2. By Application

                16.8.6.2.3. By End User

        16.8.7. U.K. Market

            16.8.7.1. Introduction

            16.8.7.2. Market Analysis and Forecast by Market Taxonomy

                16.8.7.2.1. By Product

                16.8.7.2.2. By Application

                16.8.7.2.3. By End User

17. Eastern Europe Market Analysis 2019–2024 and Forecast 2025–2032

    17.1. Introduction

    17.2. Historical Market Size (US$ Mn) Trend Analysis By Market Taxonomy, 2019–2024

    17.3. Current and Future Market Size (US$ Mn) Analysis and Forecast By Market Taxonomy, 2025–2032

        17.3.1. By Country

            17.3.1.1. Poland

            17.3.1.2. Hungary

            17.3.1.3. Romania

            17.3.1.4. Czech Republic

            17.3.1.5. Rest of Eastern Europe

        17.3.2. By Product

        17.3.3. By Application

        17.3.4. By End User

    17.4. Market Attractiveness Analysis

        17.4.1. By Country

        17.4.2. By Product

        17.4.3. By Application

        17.4.4. By End User

    17.5. Key Market Trends

    17.6. Drivers and Restraints - Impact Analysis

    17.7. Key Players - Intensity Mapping

    17.8. Country Level Analysis & Forecast

        17.8.1. Poland Market

            17.8.1.1. Introduction

            17.8.1.2. Market Analysis and Forecast by Market Taxonomy

                17.8.1.2.1. By Product

                17.8.1.2.2. By Application

                17.8.1.2.3. By End User

        17.8.2. Hungary Market

            17.8.2.1. Introduction

            17.8.2.2. Market Analysis and Forecast by Market Taxonomy

                17.8.2.2.1. By Product

                17.8.2.2.2. By Application

                17.8.2.2.3. By End User

        17.8.3. Romania Market

            17.8.3.1. Introduction

            17.8.3.2. Market Analysis and Forecast by Market Taxonomy

                17.8.3.2.1. By Product

                17.8.3.2.2. By Application

                17.8.3.2.3. By End User

        17.8.4. Czech Republic Market

            17.8.4.1. Introduction

            17.8.4.2. Market Analysis and Forecast by Market Taxonomy

                17.8.4.2.1. By Product

                17.8.4.2.2. By Application

                17.8.4.2.3. By End User

18. Central Asia Market Analysis 2019–2024 and Forecast 2025–2032

    18.1. Introduction

    18.2. Historical Market Size (US$ Mn) Trend Analysis By Market Taxonomy, 2019–2024

    18.3. Current and Future Market Size (US$ Mn) Analysis and Forecast By Market Taxonomy, 2025–2032

        18.3.1. By Product

        18.3.2. By Application

        18.3.3. By End User

    18.4. Market Attractiveness Analysis

        18.4.1. By Product

        18.4.2. By Application

        18.4.3. By End User

    18.5. Key Market Trends

    18.6. Drivers and Restraints - Impact Analysis

    18.7. Key Players - Intensity Mapping

19. Russia & Belarus Market Analysis 2019–2024 and Forecast 2025–2032

    19.1. Introduction

    19.2. Historical Market Size (US$ Mn) Trend Analysis By Market Taxonomy, 2019–2024

    19.3. Current and Future Market Size (US$ Mn) Analysis and Forecast By Market Taxonomy, 2025–2032

        19.3.1. By Product

        19.3.2. By Application

        19.3.3. By End User

    19.4. Market Attractiveness Analysis

        19.4.1. By Product

        19.4.2. By Application

        19.4.3. By End User

    19.5. Key Market Trends

    19.6. Drivers and Restraints - Impact Analysis

    19.7. Key Players - Intensity Mapping

20. Balkan & Baltic Countries Asia Market Analysis 2019–2024 and Forecast 2025–2032

    20.1. Introduction

    20.2. Historical Market Size (US$ Mn) Trend Analysis By Market Taxonomy, 2019–2024

    20.3. Current and Future Market Size (US$ Mn) Analysis and Forecast By Market Taxonomy, 2025–2032

        20.3.1. By Product

        20.3.2. By Application

        20.3.3. By End User

    20.4. Market Attractiveness Analysis

        20.4.1. By Product

        20.4.2. By Application

        20.4.3. By End User

    20.5. Key Market Trends

    20.6. Drivers and Restraints - Impact Analysis

    20.7. Key Players - Intensity Mapping

21. Middle East and Africa (MEA) Market Analysis 2019–2024 and Forecast 2025–2032

    21.1. Introduction

    21.2. Historical Market Size (US$ Mn) Trend Analysis By Market Taxonomy, 2019–2024

    21.3. Current and Future Market Size (US$ Mn) Analysis and Forecast By Market Taxonomy, 2025–2032

        21.3.1. By Country

            21.3.1.1. GCC Countries

            21.3.1.2. Kingdom of Saudi Arabia

            21.3.1.3. Türkiye

            21.3.1.4. Northern Africa

            21.3.1.5. South Africa

            21.3.1.6. Israel

        21.3.2. By Product

        21.3.3. By Application

        21.3.4. By End User

    21.4. Market Attractiveness Analysis

        21.4.1. By Country

        21.4.2. By Product

        21.4.3. By Application

        21.4.4. By End User

    21.5. Key Market Trends

    21.6. Drivers and Restraints - Impact Analysis

    21.7. Key Players - Intensity Mapping

    21.8. Country Level Analysis & Forecast

        21.8.1. GCC Countries Market

            21.8.1.1. Introduction

            21.8.1.2. Market Analysis and Forecast by Market Taxonomy

                21.8.1.2.1. By Product

                21.8.1.2.2. By Application

                21.8.1.2.3. By End User

        21.8.2. Kingdom of Saudi Arabia Market

            21.8.2.1. Introduction

            21.8.2.2. Market Analysis and Forecast by Market Taxonomy

                21.8.2.2.1. By Product

                21.8.2.2.2. By Application

                21.8.2.2.3. By End User

        21.8.3. Türkiye Market

            21.8.3.1. Introduction

            21.8.3.2. Market Analysis and Forecast by Market Taxonomy

                21.8.3.2.1. By Product

                21.8.3.2.2. By Application

                21.8.3.2.3. By End User

        21.8.4. Northern Africa Market

            21.8.4.1. Introduction

            21.8.4.2. Market Analysis and Forecast by Market Taxonomy

                21.8.4.2.1. By Product

                21.8.4.2.2. By Application

                21.8.4.2.3. By End User

        21.8.5. South Africa Market

            21.8.5.1. Introduction

            21.8.5.2. Market Analysis and Forecast by Market Taxonomy

                21.8.5.2.1. By Product

                21.8.5.2.2. By Application

                21.8.5.2.3. By End User

        21.8.6. Israel Market

            21.8.6.1. Introduction

            21.8.6.2. Market Analysis and Forecast by Market Taxonomy

                21.8.6.2.1. By Product

                21.8.6.2.2. By Application

                21.8.6.2.3. By End User

22. Market Structure Analysis

    22.1. Market Analysis by Tier of Companies

    22.2. Market Share Analysis of Top Players

    22.3. Market Presence Analysis

        22.3.1. Regional footprint of Players

        22.3.2. Platform Type foot print by Players

        22.3.3. Channel Foot Print by Players

23. Competition Analysis

    23.1. Competition Dashboard

    23.2. Competition Benchmarking

    23.3. Competition Deep Dive

        23.3.1. Eli Lilly and Company

            23.3.1.1. Company Overview

            23.3.1.2. Product Portfolio

            23.3.1.3. Sales Footprint

            23.3.1.4. Key Financials

            23.3.1.5. SWOT Analysis

            23.3.1.6. Key Developments

            23.3.1.7. Strategy Overview

                23.3.1.7.1. Channel Strategy

                23.3.1.7.2. Marketing Strategy

                23.3.1.7.3. Product Strategy

        23.3.2. Blue Earth Diagnostics

            23.3.2.1. Company Overview

            23.3.2.2. Product Portfolio

            23.3.2.3. Sales Footprint

            23.3.2.4. Key Financials

            23.3.2.5. SWOT Analysis

            23.3.2.6. Key Developments

            23.3.2.7. Strategy Overview

                23.3.2.7.1. Channel Strategy

                23.3.2.7.2. Marketing Strategy

                23.3.2.7.3. Product Strategy

        23.3.3. Lantheus

            23.3.3.1. Company Overview

            23.3.3.2. Product Portfolio

            23.3.3.3. Sales Footprint

            23.3.3.4. Key Financials

            23.3.3.5. SWOT Analysis

            23.3.3.6. Key Developments

            23.3.3.7. Strategy Overview

                23.3.3.7.1. Channel Strategy

                23.3.3.7.2. Marketing Strategy

                23.3.3.7.3. Product Strategy

        23.3.4. Siemens Healthcare Private Limited

            23.3.4.1. Company Overview

            23.3.4.2. Product Portfolio

            23.3.4.3. Sales Footprint

            23.3.4.4. Key Financials

            23.3.4.5. SWOT Analysis

            23.3.4.6. Key Developments

            23.3.4.7. Strategy Overview

                23.3.4.7.1. Channel Strategy

                23.3.4.7.2. Marketing Strategy

                23.3.4.7.3. Product Strategy

        23.3.5. GE Healthcare

            23.3.5.1. Company Overview

            23.3.5.2. Product Portfolio

            23.3.5.3. Sales Footprint

            23.3.5.4. Key Financials

            23.3.5.5. SWOT Analysis

            23.3.5.6. Key Developments

            23.3.5.7. Strategy Overview

                23.3.5.7.1. Channel Strategy

                23.3.5.7.2. Marketing Strategy

                23.3.5.7.3. Product Strategy

        23.3.6. Advanced Accelerator Applications (Novartis)

            23.3.6.1. Company Overview

            23.3.6.2. Product Portfolio

            23.3.6.3. Sales Footprint

            23.3.6.4. Key Financials

            23.3.6.5. SWOT Analysis

            23.3.6.6. Key Developments

            23.3.6.7. Strategy Overview

                23.3.6.7.1. Channel Strategy

                23.3.6.7.2. Marketing Strategy

                23.3.6.7.3. Product Strategy

        23.3.7. University of Lowa HealthCare

            23.3.7.1. Company Overview

            23.3.7.2. Product Portfolio

            23.3.7.3. Sales Footprint

            23.3.7.4. Key Financials

            23.3.7.5. SWOT Analysis

            23.3.7.6. Key Developments

            23.3.7.7. Strategy Overview

                23.3.7.7.1. Channel Strategy

                23.3.7.7.2. Marketing Strategy

                23.3.7.7.3. Product Strategy

        23.3.8. Telix Pharmaceuticals Limited

            23.3.8.1. Company Overview

            23.3.8.2. Product Portfolio

            23.3.8.3. Sales Footprint

            23.3.8.4. Key Financials

            23.3.8.5. SWOT Analysis

            23.3.8.6. Key Developments

            23.3.8.7. Strategy Overview

                23.3.8.7.1. Channel Strategy

                23.3.8.7.2. Marketing Strategy

                23.3.8.7.3. Product Strategy

        23.3.9. Jubilant Radiopharma

            23.3.9.1. Company Overview

            23.3.9.2. Product Portfolio

            23.3.9.3. Sales Footprint

            23.3.9.4. Key Financials

            23.3.9.5. SWOT Analysis

            23.3.9.6. Key Developments

            23.3.9.7. Strategy Overview

                23.3.9.7.1. Channel Strategy

                23.3.9.7.2. Marketing Strategy

                23.3.9.7.3. Product Strategy

        23.3.10. TRASIS

            23.3.10.1. Company Overview

            23.3.10.2. Product Portfolio

            23.3.10.3. Sales Footprint

            23.3.10.4. Key Financials

            23.3.10.5. SWOT Analysis

            23.3.10.6. Key Developments

            23.3.10.7. Strategy Overview

                23.3.10.7.1. Channel Strategy

                23.3.10.7.2. Marketing Strategy

                23.3.10.7.3. Product Strategy

        23.3.11. RadioMedix Inc.

            23.3.11.1. Company Overview

            23.3.11.2. Product Portfolio

            23.3.11.3. Sales Footprint

            23.3.11.4. Key Financials

            23.3.11.5. SWOT Analysis

            23.3.11.6. Key Developments

            23.3.11.7. Strategy Overview

                23.3.11.7.1. Channel Strategy

                23.3.11.7.2. Marketing Strategy

                23.3.11.7.3. Product Strategy

        23.3.12. IBA Radiopharma Solutions

            23.3.12.1. Company Overview

            23.3.12.2. Product Portfolio

            23.3.12.3. Sales Footprint

            23.3.12.4. Key Financials

            23.3.12.5. SWOT Analysis

            23.3.12.6. Key Developments

            23.3.12.7. Strategy Overview

                23.3.12.7.1. Channel Strategy

                23.3.12.7.2. Marketing Strategy

                23.3.12.7.3. Product Strategy

        23.3.13. Piramal Imaging (Life Molecular Imaging)

            23.3.13.1. Company Overview

            23.3.13.2. Product Portfolio

            23.3.13.3. Sales Footprint

            23.3.13.4. Key Financials

            23.3.13.5. SWOT Analysis

            23.3.13.6. Key Developments

            23.3.13.7. Strategy Overview

                23.3.13.7.1. Channel Strategy

                23.3.13.7.2. Marketing Strategy

                23.3.13.7.3. Product Strategy

        23.3.14. Cardinal Health

            23.3.14.1. Company Overview

            23.3.14.2. Product Portfolio

            23.3.14.3. Sales Footprint

            23.3.14.4. Key Financials

            23.3.14.5. SWOT Analysis

            23.3.14.6. Key Developments

            23.3.14.7. Strategy Overview

                23.3.14.7.1. Channel Strategy

                23.3.14.7.2. Marketing Strategy

                23.3.14.7.3. Product Strategy

        23.3.15. DuchemBio, Co., Ltd

            23.3.15.1. Company Overview

            23.3.15.2. Product Portfolio

            23.3.15.3. Sales Footprint

            23.3.15.4. Key Financials

            23.3.15.5. SWOT Analysis

            23.3.15.6. Key Developments

            23.3.15.7. Strategy Overview

                23.3.15.7.1. Channel Strategy

                23.3.15.7.2. Marketing Strategy

                23.3.15.7.3. Product Strategy

24. Assumptions and Acronyms Used

25. Research Methodology

Research Methodology Framework for Market Research Excellence

At Persistence Market Research, we implement a comprehensive, validated, and multi-dimensional approachto market analysis that delivers actionable insights across complex market landscapes. Our methodology combines the analytical rigor of leading consulting firms with innovative research techniques, ensuring robust market assessments that guide strategic decision-making with confidence.

Core Research Philosophy

Our methodology is built on four foundational pillars:

Research Philosophy Image

At Persistence Market Research, our methodology is designed to transcend conventional market studies by combining analytical rigor, multi-source validation, and future-focused insights.

We integrate advanced research frameworks, robust data collection strategies, cutting-edge analytics, and innovative technologies to deliver a 360-degree view of complex markets.

We integrate advanced research frameworks, robust data collection strategies, cutting-edge analytics, and innovative technologies to deliver a 360-degree view of complex markets.

Each stage spanning from strategic scoping and hypothesis-building to competitive intelligence, quality validation, and actionable recommendations is engineered to provide clients with unmatched clarity, precision, and confidence in decision-making.

By embedding innovation and technology at the core, our approach ensures that insights are not only comprehensive but also predictive, empowering businesses to seize opportunities, mitigate risks, and achieve sustainable growth

Research Philosophy Image

Capturing Key Information and Events

During this phase, key research objectives focus on essential information and data points for assessing the market, including:

Research Philosophy Image

TAM-SAM-SOM Framework Implementation

We employ both top-down and bottom-up approaches to ensure accurate market sizing.

Top-Down Market SizingBottom-Up Market Sizing
Universe Definition: Total global/regional market identificationUnit Economics: Average transaction values, purchase frequencies, customer lifecycle
Segmentation Filters: Geographic, demographic, and behavioral constraintsCustomer Segmentation: Detailed buyer persona development and sizing
Market Share Analysis: Competitive landscape assessment and share allocationPenetration Analysis: Market penetration rates by segment and geography
Growth Rate Application: Historical trends and forward-looking growth assumptionsScaling Methodology: Extrapolation techniques with confidence intervals

Validation & Cross-Verification

  • Triangulation: Comparing top-down and bottom-up results for consistency
  • Sensitivity Analysis: Testing key assumptions and parameter variations
  • Peer Benchmarking: Comparison with analogous markets and industry benchmarks
  • Expert Review: External validation through industry specialist consultation

Research Philosophy Image

Forecasting & Projection Modeling

Our proprietary forecasting models incorporate multiple variables and scenarios.

Forecasting Components

  • Historical Trend Analysis: 10-year historical growth patterns and cyclical variations
  • Driver-Based Modeling: Economic indicators, demographic shifts, technology adoption
  • Scenario Planning: Base case, optimistic, and conservative projections
  • Monte Carlo Simulations: Probability-weighted outcomes and risk assessments

Model Validation

  • Back-Testing: Historical accuracy assessment over 3–5-year periods
  • Cross-Validation: Multiple modeling approaches for result comparison
  • External Benchmarking: Comparison with established market forecasts
  • Continuous Calibration: Quarterly model updates based on new data

Comprehensive Data Collection Strategy

Our secondary research phase establishes a robust knowledge base utilizing diverse, credible sources.

Secondary Data Sourcess

  • Industry Publications & Reports
  • Government & Regulatory Data
  • Financial Intelligence (filings & reports)
  • Academic Research & Digital Intelligence

Quality Assurance Protocol

  • Source credibility assessment and publication date validation
  • Data consistency checks across multiple sources
  • Bias identification and neutralization techniques
  • Information gap tracking for primary research prioritization

Research Philosophy Image

Primary Research Excellence

Our primary research methodology employs best-in-class techniques to capture unique market insights.

Quantitative Research Methods

  • Large-Scale Surveys: Statistically representative samples with 95% confidence intervals
  • Survey Methodology: Multi-channel deployment (online, telephone, in-person)
  • Question Architecture and Response Optimization

Qualitative Research Methods

  • Executive Interviews
  • Focus Groups
  • Expert Consultations

Quality Assurance & Validation Framework

Multi-Stage Validation Process

  • Source Verification and Consistency Testing
  • Outlier Detection and Bias Assessment
  • Peer Review Process and External Validation
  • Sensitivity Analysis and Confidence Intervals

Research Philosophy Image

Methodology Validation & Credibility

Our research methodology has been extensively validated through:

  • Academic Partnerships: Collaborations with top-tier business schools and research institutions
  • Client Success Stories: Documented case studies demonstrating research impact and ROI
  • Continuous Benchmarking: Performance comparison with leading global research firms

This comprehensive methodology framework positions Persistence Market Research at the forefront of market intelligence, combining the analytical sophistication of top-tier consulting firms with innovative research techniques. Our approach ensures that every market assessment delivers precise, actionable, and strategically valuable insights that drive business success in competitive market environments.

Ready to unlock your market potential? Contact our research experts to discuss how our validated methodology can transform your strategic decision-making with data-driven market intelligence.

Copyright © 2026 Persistence Market Research. All Rights Reserved

Connect With Us -