


- Animal Health
- OTC Pet Medication Market
OTC Pet Medication Market Size, Share, and Growth Forecast, 2026 - 2033
Over-the-Counter (OTC) Pet Medication Market by Product Type (Fleas & Ticks, Pain Relief & Arthritis, Dewormers, Others), Pet Type (Dogs, Cats, Birds, Fish & Reptiles, Small Pets, Others), Medicine Form (Chewable & Tablets, Capsules & Ointment, Sprays, Others), and Regional Analysis for 2026 - 2033
OTC Pet Medication Market Share and Trends Analysis
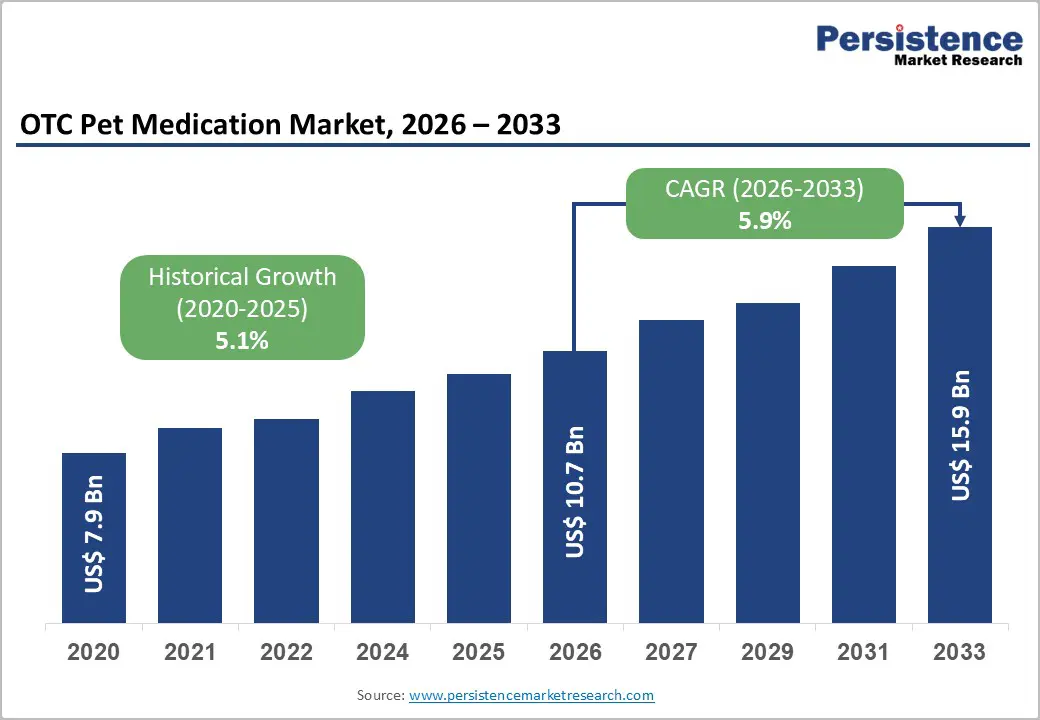
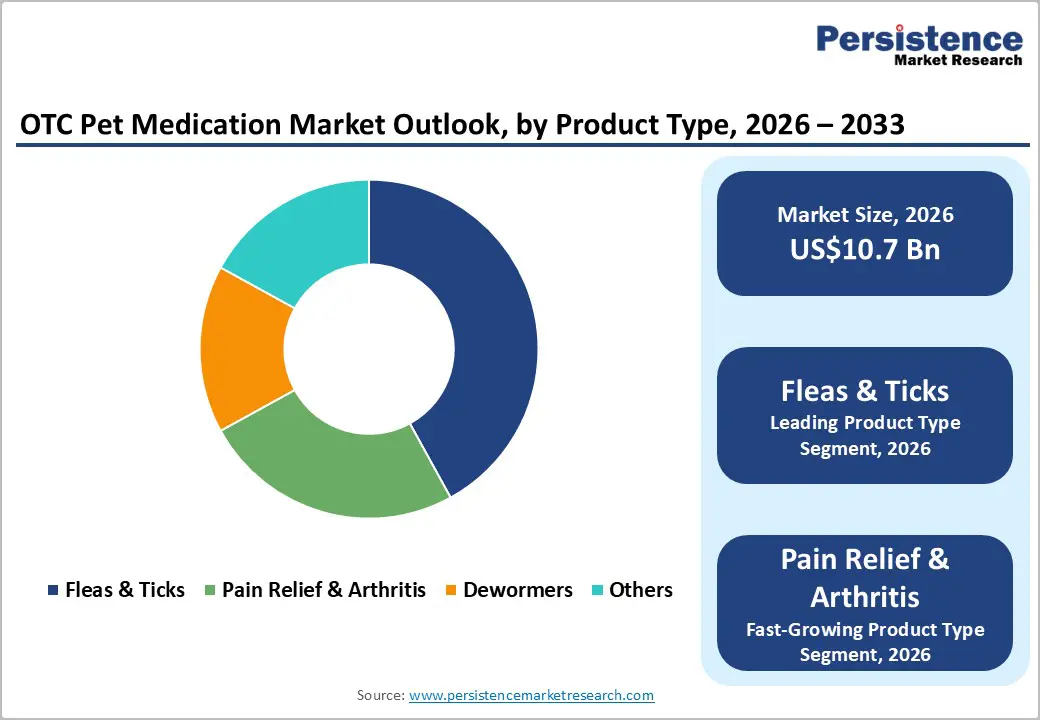
The global OTC pet medication market size is likely to be valued at US$10.7 billion in 2026 and is estimated to reach US$15.9 billion by 2033, growing at a CAGR of 5.9% during the forecast period 2026 - 2033, driven by increasing companion animal ownership, rising expenditure on preventive veterinary care, and wider accessibility of non-prescription animal health products through retail and digital distribution channels.
Regulatory support for preventive parasite control and pet wellness management is strengthening consumer confidence in self-administered medications.
Key Industry Highlights:
- Leading Product Type: Fleas & ticks are set to hold around 42% revenue share in 2026, driven by persistent pest pressures and rising global temperatures.
- Fastest-Growing Product Type: Pain relief & arthritis are projected as the fastest-growing segment, supported by advancing companion animal lifespans.
- Leading Medicine Form: Chewable & tablets are estimated to hold roughly 48% revenue share in 2026, due to high product palatability and easy home administration.
- Fastest-Growing Medicine Form: Capsules & ointment are forecast to record the fastest growth, driven by rising global cases of seasonal skin allergies.
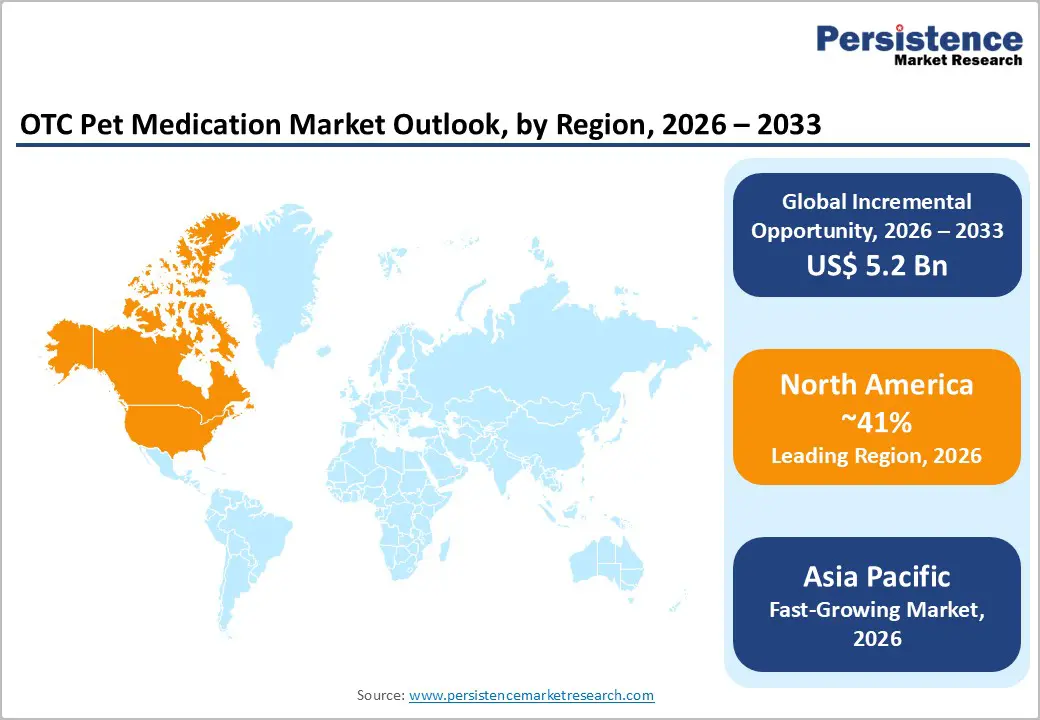
- Regional Leadership: North America is projected to capture roughly 41% of the market share by 2026, driven by deep humanization trends and high disposable income.
- Fastest-growing Region: Asia Pacific is forecast to record the fastest growth due to rapid urbanization and escalating per-capita pet expenditures.
- Key Opportunity: Executing direct-to-consumer digital subscription architecture optimizes warehouse inventory turns and secures highly predictable, recurring corporate revenue streams.
DRO Analysis
Driver - Rising Companion Animal Ownership and Preventive Healthcare Spending
Increasing pet adoption levels across urban households are driving demand for accessible preventive healthcare products. Growing emotional attachment toward companion animals is encouraging regular spending on parasite prevention, pain management, and nutritional wellness solutions. According to the American Pet Products Association, nearly 95 million households in the U.S. owned pets in 2025, reflecting sustained expansion in companion animal care demand. Preventive medication purchasing behavior is increasing due to rising veterinary consultation expenses and growing consumer preference for home-based treatment options.
Expansion of organized pet retail chains and digital veterinary advisory platforms is improving product visibility and consumer awareness. OTC flea and tick treatments are gaining traction due to recurring infestation risks associated with climate variability and outdoor pet activity. Major animal health companies are increasing investments in flavored chewable formulations and simplified dosage packaging, improving compliance rates among pet owners. Broader product availability through supermarkets, veterinary pharmacies, and online channels is strengthening recurring sales volumes for non-prescription pet medications.
Restraint - Regulatory Complexity and Product Compliance Challenges
Variation in animal healthcare regulations across countries is creating approval and labeling challenges for manufacturers. Differences in ingredient restrictions, dosage standards, and veterinary compliance requirements are increasing operational complexity for multinational companies. Frequent reformulation requirements and packaging modifications are elevating production costs, limiting scalability for smaller manufacturers operating across multiple distribution markets.
Quality assurance expectations for pet medications are increasing manufacturing and testing expenditures. Raw material traceability requirements and product safety evaluations are extending commercialization timelines for new formulations. Rising compliance costs are placing pressure on operating margins, particularly among regional suppliers with limited production capacity. Distribution disruptions linked to regulatory inspections are also affecting inventory consistency across retail channels.
Opportunity - Rising Demand for Natural and Organic OTC Formulations
Consumer preference for plant-derived and chemical-free veterinary formulations is creating a structurally distinct premium subsegment within OTC pet medication. The U.S. Department of Agriculture (USDA) organic certification framework has been progressively referenced by pet product manufacturers to signal ingredient transparency, responding to owner demand for formulations free from synthetic pesticides and artificial excipients. This trend is particularly pronounced in flea and tick prevention, where botanical alternatives are gaining clinical validation.
Manufacturers that invest in clinical substantiation of natural formulations and secure credible third-party certifications position themselves to command price premiums of 20-35% above standard OTC products. Regulatory bodies, including the FDA, have indicated openness to expedited review pathways for ingredient categories with established safety profiles, reducing time-to-market for compliant natural formulations. Retail partnerships with specialty pet chains and health-focused e-commerce platforms amplify distribution reach within the high-intent consumer demographic that prioritizes ingredient transparency.
Category-wise Analysis
Product Type Insights
Fleas and ticks are expected to lead the OTC pet medication market, accounting for approximately 42% of the revenue in 2026. Rising parasite exposure and increasing preventive healthcare awareness are sustaining strong consumer demand for recurring treatment products. Bayer expanded topical flea treatment distribution across digital pet pharmacies during 2025, strengthening retail accessibility. Longer protection cycles and simplified dosage formats are improving customer adherence and supporting consistent purchasing frequency across companion animal households globally.
Pain relief and arthritis are likely to represent the fastest-growing segment, propelled by increasing aging pet populations and rising mobility-related health concerns. Growing preference for non-prescription joint wellness products is accelerating segment expansion among urban pet owners. Elanco introduced advanced joint support chewables in 2025, improving palatability and treatment compliance. Increasing awareness regarding long-term musculoskeletal care is supporting premium product penetration across organized veterinary retail channels globally.
Pet Type Insights
Dogs are projected to lead the market, capturing around 56% of the revenue share in 2026. High absolute body weight requirements dictate elevated dosage volumes and higher product prices per unit. Oral chewable treatments for large canine breeds require greater concentrations of active ingredients, inflating average consumer transaction values. This structural pricing factor generates substantial baseline revenue, maintaining the dog segment's position as the primary focal point for commercial innovation.
Cats are likely to be the fastest-growing segment, fueled by expanding multi-pet urban households and the lower absolute costs of feline ownership. Urban density preferences favor smaller companion animals, accelerating feline population growth faster than other animal categories. Spot-on topical dewormers tailored for indoor cats see expanding sales volumes across metropolitan retail corridors. This demographic shift drives consistent volume growth, establishing the feline segment as a high-velocity growth center.
Medicine Form Insights
Chewable & tablets are likely to be the leading segment with a projected 48% of the OTC pet medication market share in 2026 due to high palatability and ease of home administration without professional clinical help. Standardizing veterinary treatments into highly palatable, flavor-enhanced delivery designs removes traditional consumer compliance obstacles. Beef-flavored parasiticides are consumed willingly by companion animals, preventing treatment stress. This user-friendly administration style ensures high consumer brand loyalty and steady repeat purchase volumes across all retail channels.
Capsules & ointment are anticipated to be the fastest-growing segment, fueled by the rising prevalence of localized dermatological conditions and chronic secondary ear infections. Targeted topical formulations provide immediate localized symptom relief, bypassing potential systemic metabolic complications in sensitive or aging animals. Hydrocortisone anti-itch creams are heavily utilized by owners to manage seasonal environmental allergies. This clinical shift toward target-specific treatment forms drives rapid volume expansion across mass retail distribution networks.
Regional Insights
North America OTC Pet Medication Market Trends
North America is anticipated to be the leading region, accounting for a market share of 41% in 2026, driven by unusually high pet humanization rates, extensive disposable incomes, and advanced digital retail distribution networks. The structural consolidation of veterinary pharmacy operations into mass retail environments accelerates transactional velocity.
U.S. OTC Pet Medication Market Insights
The U.S. is projected to maintain a commanding revenue position, supported by rising subscription-based pet healthcare services and expanding e-commerce pharmacy penetration. Increasing demand for flea prevention and mobility support products is encouraging product diversification among major animal health companies. Petco and Chewy expanded digital veterinary advisory integration during 2025, strengthening direct-to-consumer medication accessibility.
Canada OTC Pet Medication Market Insights
Canada is forecast to see steady demand increases, driven by expanding investments in domestic companion animal supply networks and veterinary wellness channels. Rising ownership of domestic animals within major urban centers expands the baseline addressable market for therapeutic interventions. Increasing consumer demand for clean-label, natural formulations encourages retailers to dedicate premium shelf space to advanced bio-based therapeutics.
Europe OTC Pet Medication Market Trends
Europe is expected to hold a major revenue share, supported by comprehensive animal welfare laws and established distribution partnerships across independent pet store chains. Regional health trends heavily influence product development, accelerating the transition toward chemical-free parasiticides and organic wellness supplements. Strategic retail integrations allow consumer brands to gain visible positioning across both traditional and digital storefronts.
Germany OTC Pet Medication Market Insights
Germany is likely to act as a primary revenue contributor within Europe, driven by strict consumer demands for clinically validated therapeutic options and transparent ingredient profiles. Widespread availability of targeted over-the-counter medications in established drugstore chains optimizes customer acquisition pathways. Corporate focus on sustainable, bio-based ingredient sourcing satisfies strict local consumer expectations, preserving solid operating margins.
U.K. OTC Pet Medication Market Insights
The U.K. is expected to show robust growth dynamics, propelled by rapid consumer adoption of digital omnichannel retail platforms and automated direct-to-home delivery services. Evolving retail models lower purchase friction, improving compliance rates for regular seasonal treatments. Collaborative initiatives between veterinary product developers and mass-market retailers expand the reach of specialized health formulations.
Asia Pacific OTC Pet Medication Market Trends
Asia Pacific is forecast to be the fastest-growing market for OTC pet medication, stimulated by accelerating urbanization, expanding middle-class populations, and rising per-capita expenditures on companion animal wellness. Shifting lifestyle preferences across metropolitan areas drive a surge in domestic animal adoption, particularly small dogs and cats. Expanding local manufacturing capabilities optimizes regional production costs, lowering retail prices and driving mass market penetration.
China OTC Pet Medication Market Insights
China is projected to exhibit rapid market acceleration, supported by the massive expansion of digital ecosystem commerce and viral pet health awareness campaigns. Rapidly rising companion animal populations in Tier 1 and Tier 2 cities expand the consumption of preventative medications. Large investments by domestic enterprises into modern production facilities increase the regional availability of cost-effective therapeutic options.
Japan OTC Pet Medication Market Insights
Japan is expected to display consistent premium value growth, driven by an aging domestic pet population requiring specialized geriatric therapies and advanced joint support supplements. High consumer purchasing power allows manufacturers to focus on specialized, premium chewable dosage forms. Strict local health standards maintain high market entry barriers, favoring well-established brands with documented clinical testing.
Competitive Landscape
The global OTC pet medication market is moderately fragmented, with established animal health enterprises operating alongside agile direct-to-consumer digital brands. Intense competition forces companies to utilize advanced chemical delivery technologies and expand omni-channel retail distribution networks to protect their market positioning.
Key Market Competitors are Zoetis Inc., Elanco Animal Health Incorporated, Boehringer Ingelheim International GmbH, Merck & Co., Inc., and Virbac S.A. The continuous presence of regional private-label manufacturers exerts downward pricing pressure within standard product categories, accelerating the corporate need for specialized product differentiation.
Key Industry Developments
- In May 2026, ALR Technologies SG Ltd. launched the GluCurve Pet CGM in Canada, reinforcing the expansion of advanced OTC diabetic monitoring solutions for companion animals.
- In April 2026, PetMeds partnered with Rural King to launch integrated pet pharmacy services across retail stores and digital platforms, reinforcing accessibility of OTC pet medications in underserved communities.
Companies Covered in OTC Pet Medication Market
- Zoetis Inc.
- Elanco Animal Health Incorporated
- Boehringer Ingelheim International GmbH
- Merck & Co., Inc. (Merck Animal Health)
- Virbac S.A.
- Ceva Santé Animale S.A.
- Dechra Pharmaceuticals PLC
- Vetoquinol S.A.
- Neogen Corporation
- Phibro Animal Health Corporation
- Norbrook Laboratories Limited
- Kyoritsu Seiyaku Corporation
- Heska Corporation
Frequently Asked Questions
The global OTC pet medication market is projected to reach US$10.7 billion in 2026.
Rising companion animal ownership, increasing preventive healthcare awareness, and expanding accessibility of non-prescription veterinary products are driving the OTC pet medication market.
The OTC pet medication market is poised to witness a CAGR of 5.9% from 2026 to 2033.
Expansion of e-commerce pet pharmacies and increasing demand for natural, preventive pet wellness formulations are creating key growth opportunities in the OTC pet medication market.
Some of the key market players include Zoetis Inc., Elanco Animal Health Incorporated, Boehringer Ingelheim International GmbH, Merck & Co., Inc., and Virbac S.A.


