


- Specialty & Fine Chemicals
- North America Aluminum Sulfate Market
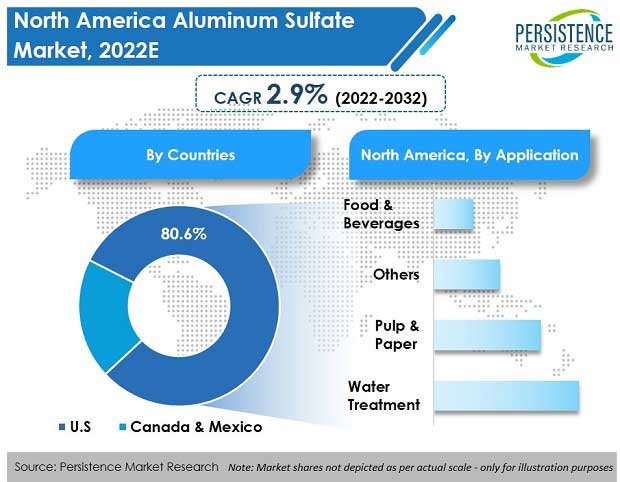
North America Aluminum Sulfate Market
North America Market Study on Aluminum Sulfate: Western United States to Account for Over 40% Market Share
Aluminum Sulfate Market Outlook (2022-2032)
Sales of aluminum sulfate in North America were valued at US$ 182.3 Mn in 2021, registering Y-o-Y growth of 2.7%. Overall, the North America aluminum sulfate market is expected to expand at 2.9% CAGR and reach a market valuation of US$ 249 Mn by 2032.
| Attribute | Key Insights |
|---|---|
|
Aluminum Sulfate Market Size (2021A) |
US$ 182.3 Mn |
|
Market Estimation (2022E) |
US$ 187.2 Mn |
|
Market Projections (2032F) |
US$ 249 Mn |
|
Value CAGR (2022-2032) |
2.9% |
|
Market Share of Top 4 Players |
72% |
In North America, the aluminum sulfate market is estimated to account for around 5.3% share of the bauxite market.
The U.S. is anticipated to remain a prominent country in the North American aluminum sulfate market due to the high number of water treatment plants and large base for various end-use industries.
Consumption Analysis of Aluminum Sulfate in North America from 2017 to 2021 Vs Market Outlook for 2022 to 2032
Sales of aluminum sulfate witnessed 2.5% to 2.7% year-over-year growth during the historical period of 2017 to 2021. However, the demand graph for aluminum sulfate saw a minor dip in 2020 due to the COVID pandemic.
Demand for aluminum sulfate is expected to increase during the assessment period at a growth rate of 2.9%. Extensive aluminum sulfate usage as a coagulating agent in wastewater treatment plants and purification of drinking water has increased its demand.
What are the Key Trends Being Observed in the North America Aluminum Sulfate Market?
“Increasing Number of Wastewater Treatment Plants Driving Market Demand”
Over the past decades, the global water management industry has been rapidly growing due to high demand for freshwater for residential and commercial usage. This has led to an increase in the consumption of water treatment chemicals such as aluminum sulfate, ferric sulfate, and others. To reuse the processed water, many wastewater treatment projects have been sanctioned in North America.
Several manufacturing industries such as chemicals, pharmaceuticals, pulp & paper, and others generate huge volumes of wastewater consisting of organic & inorganic matter. It is mandatory to treat industrially processed water to meet the standard quality of pH, TDS, hardness, alkalinity, etc., so that the water can be reused for industrial and domestic purposes.
For this recycling process, coagulants such as aluminum sulfate are mostly utilized all over the world for water treatment to remove impurities from the water. Aluminum-based coagulants are used in the pharmaceutical industry as coagulating agents, in the food & beverage industry as firming, anti-cracking agents & n other applications.
Due to its physicochemical properties, aluminum sulfate finds a wide range of applications. It has industrial as well as residential application. A large number of ongoing as well as planned wastewater treatment plants is expected to drive consumption growth of aluminum sulfate across North America.
“Growth of Water Treatment Industry Supplementing Demand for Aluminum Sulfate”
Natural water consists of several impurities such as dust particles, and microorganisms such as viruses, bacteria, fungus, and others. Water treatment with aluminum sulfate is effective at removing these parasites and particles when used at the time of chemical treatment, and this process is called coagulation.
Substantial rise in demand for treated natural water has been observed worldwide. This demand is expected to grow at a healthy rate with rising health consciousness among the population. Significantly growing demand for treated natural water is anticipated to propel the sales of water treatment chemicals. Further, increasing wastewater generation from industries is also contributing to boosting the sales of aluminum sulfate.
“Various Other End Uses of Aluminum Sulfate”
Aluminum sulfate demand is witnessing significant rise from numerous end-use industries, including chemicals, paper & pulp, and others. The compound plays a key role in paper manufacturing industries for sizing paper.
Printing and sizing paper is expected to remain a key growth driver for aluminum sulfate over the coming years, which is used in the paper and pulp industry. Extensive use of paper in the packaging industry is expected to create significant opportunities for paper treated from aluminum sulfate owing to its cost-effectiveness.
Further, aluminum sulfate plays a key role in the food & beverage industry as a food additive and neutralizing agent.
What Might Adversely Hit Aluminum Sulfate Consumption?
“High Acidic Nature of Aluminum Sulfate Restricting its Usage”
Aluminum sulfate has relatively higher acidity, clogging, high density, and various other properties. High acidity is one of the properties that has a negative impact on paper and pulp. Aluminum sulfate is used during paper manufacturing for sizing the paper, and this breaks the chain and weakens the fibers.
Paper mills can make sizing paper by using alternative synthetic agents such as ferric sulfate and ferric chloride, from which, acid-free paper can be manufactured and do not tear as easily as paper manufactured using aluminum sulfate. Stiff competition from these alternative synthetic agents negatively impacts aluminum sulfate demand growth.
Pulp & paper manufacturers are focusing on achieving longer lifespan of paper. Hence, a relatively higher acidic level created by aluminum sulfate during processing is anticipated to slow down market growth to some extent.
Country-wise Analysis
Why is the U.S. Dominating the Aluminum Sulfate Market in North America?
The U.S. is expected to remain a leading market in the North America aluminum sulfate market. The U.S. market is expected to reach US$ 199.5 Mn by the end of the forecast period expanding at a CAGR of 2.8%.
The U.S. stands for 4.25% of the total world population, and the water crisis in the country has traced importance to the treatment of wastewater. The U.S. processes approximately 34 billion liters of wastewater every day.
A coagulating agent such as aluminum sulfate, which is widely used in wastewater treatment, is expected to witness upsurge in demand.
What is the Outlook for the Canada Aluminum Sulfate Market?
Canada has a significant share in the North American market for aluminum sulfate, which stands at 11.9% in 2022 by value.
End-use industries of aluminum sulfate, including wastewater treatment, paper and pulp manufacturing industries, and personal care have been estimated to witness faster growth in Canada as compared to the U.S., owing to rising investments in industrialization across the country.
Category-wise Insights
What is the Growth Outlook for Ferric Alum?
Ferric alum is estimated to remain a prominent aluminum sulfate product type. The segment is expected to expand at a growth rate of 3% across the North American region.
Majority of alum produced across the region is consumed by water treatment and pulp & paper industries, as it is effective and inexpensive for a wide range of wastewater treatment problems.
The advantages of ferric alum such as low sludge formation, good low-temperature performance, high-performance primary coagulant, etc., have made it the best fit for a wide spectrum of applications, ranging from small-scale industries to government wastewater treatment plants.
Which Applications are Contributing to Demand Growth of Aluminum Sulfate?
Aluminum sulfate usage in the poultry business is popular to reduce ammonia volatilization. It is used in dyeing fabrics as a dye 'fixer' for printing and dyeing on cloth. Due to its highly acidic nature, it is added to alkaline soils to balance the pH of plants in gardening.
Aluminum sulfate also has some clinical benefits. It is used in the pharmaceutical and personal care industry as a coagulant agent. Further, aluminum-containing personal care products are harmless to human skin. Aluminum sulfate is used in the production of various personal care products, personal cleanliness products, and skin fresheners.
Growing demand for these personal care products is strengthening aluminum sulfate sales.
Covid-19 Impact & Recovery
Aluminum sulfate market growth was affected by the COVID-19 pandemic crisis. However, economic recovery and improving industrial performance have resulted in a recovery of the market.
Over the past few years, there has been considerable increase in the demand for chemicals and pharmaceuticals. To meet this increasing demand, new production units are being set up and existing infrastructure is being expanded. This expansion in capacity is generating a huge amount of wastewater, thereby boosting aluminum sulfate consumption.
Competitive Landscape
Key manufacturers of aluminum sulfate are focusing on alternative distribution channels, such as online channels, to further strengthen their market presence in North America. Majority of key players are focusing on the acquisition of small players and small-scale companies, whereas some market players are focusing on expanding their existing manufacturing sites.
Some of the key developments are:
- In Nov 2021, the merger between USALCO and G2O created one of North America's leading producers of water treatment chemicals.
- In 2018, Reagents tripled its manufacturing services with the opening of its new 38,000 square feet eco-friendly manufacturing facility at Cheshire, U.S.
Similarly, other key developments related to companies manufacturing aluminum sulfate have been tracked by the team at Persistence Market Research, which are available in the full report.
Companies Covered in North America Aluminum Sulfate Market
- Chemtrade Logistics Inc.
- GAC Chemical Corporation
- Reagents
- Affinity Chemical LLC
- GEO Specialty Chemicals, Inc.
- Noah Chemicals
- Chemical Store Inc.
- The Chemical Company
- Alfa Chemistry
- Cole Chemical
- Penta International Corp
- Miles Chemical Company Inc.
- Sigma Aldrich
- USALCO
Frequently Asked Questions
The North America aluminum sulfate market is estimated to be valued at US$ 187.2 Mn in 2022.
Rising demand for water and wastewater treatment is the main factor driving aluminum sulfate demand in North America.
Consumption of aluminum sulfate in North America is projected to increase at 2.9% CAGR and be valued at around US$ 249 Mn by 2032-end.
The U.S. aluminum sulfate market holds 80.6% share in the North American region in 2022.
USALCO, Nippon Light Metal Co., Ltd, Kemira Oyj, and Chemtrade Logistics Inc. account for 72% of the market share.


