


- Biotechnology
- High Content Screening Market
High Content Screening Market Size, Share, Growth, and Regional Forecast, 2026 - 2033
High Content Screening Market by Product (Instruments, Consumables & Reagents, Software & Data‑Analysis Platform, Services, Others), Application (Primary & Secondary Screening, Drug Discovery & Development, Target Identification & Validation, Toxicity / Safety Testing, Compound Profiling, Others), End-user (Pharmaceutical & Biotechnology Companies, Contract Research Organizations, Academic & Research Institutions, Others) and Regional Analysis from 2026 - 2033
High Content Screening Market Share and Trends Analysis
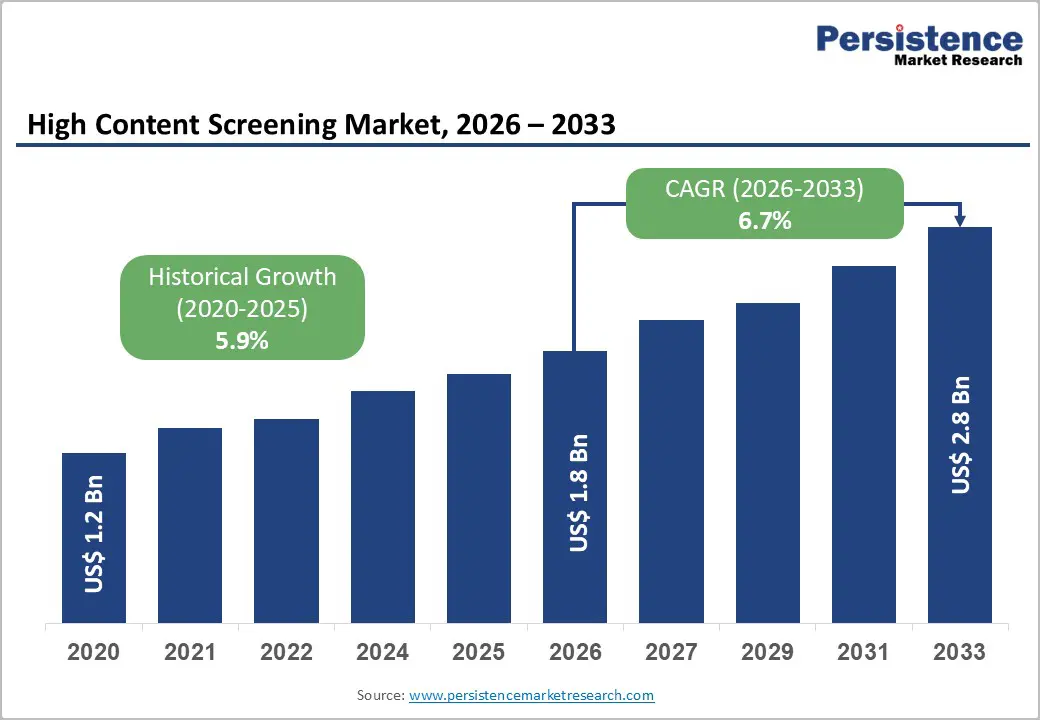
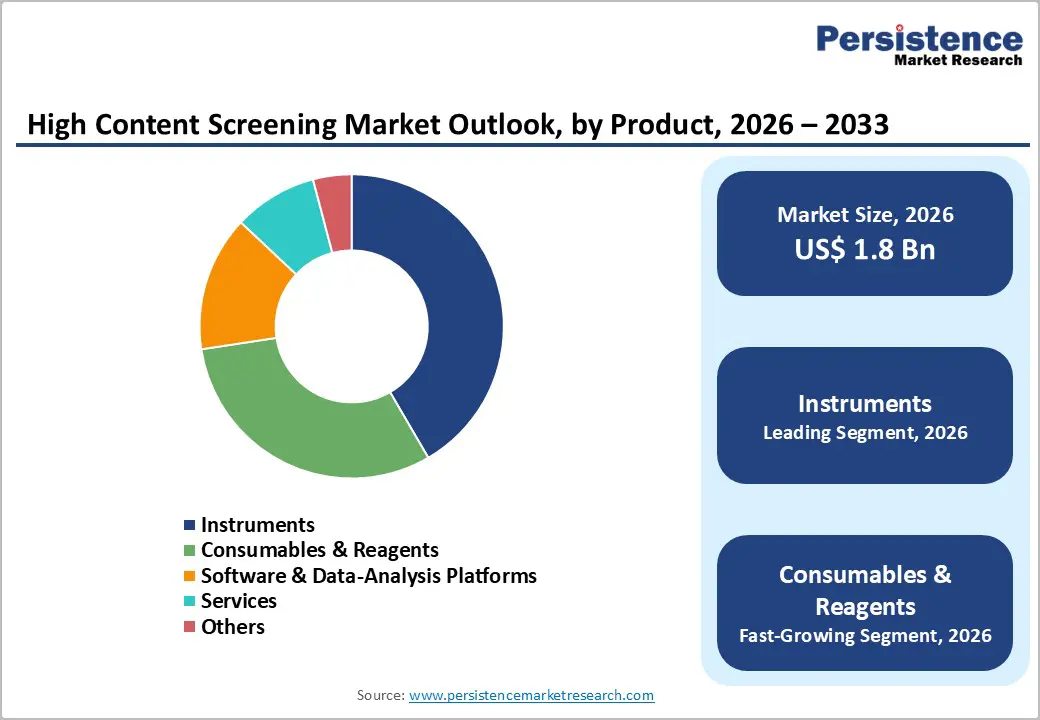
The global high content screening market size is estimated to be valued at US$ 1.8 billion in 2026 to US$ 2.8 billion by 2033, growing at a CAGR of 6.7% during the forecast period from 2026 to 2033.
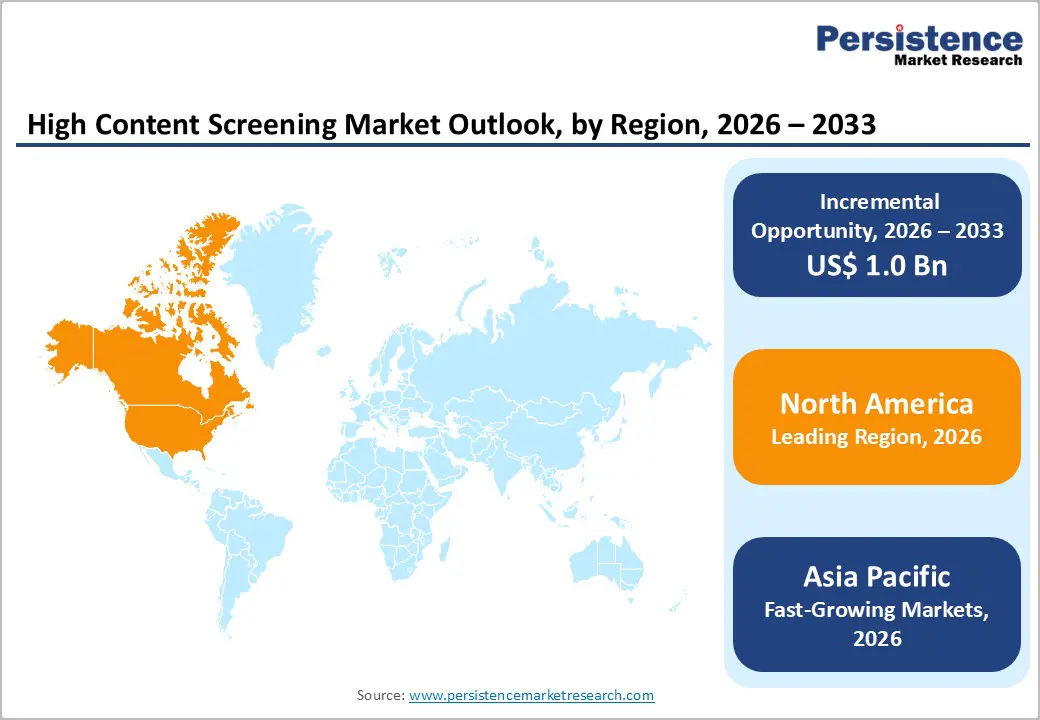
The market is growing steadily, driven by increasing drug discovery, complex cell-based assays, and demand for automated, high-throughput screening. North America leads with advanced research infrastructure and early adoption of HCS technologies. At the same time, Asia Pacific is the fastest-growing region, fueled by rising biotech investments, expanding research labs, and growing adoption of AI-powered imaging and analysis platforms.
Key Industry Highlights
- Dominant Segment: Instruments lead the HCS Market with 41.6% share in 2025, driven by the adoption of automated imaging systems, high-throughput screening platforms, and advanced microscopy. Their precision, scalability, and integration with software platforms support widespread use in drug discovery, toxicology, and phenotypic assays across pharmaceutical and academic research labs.
- Dominant Region: North America remains the largest regional market due to advanced life-sciences infrastructure, high R&D investment, and early adoption of automated HCS platforms. Asia Pacific is the fastest-growing region, fueled by expanding biotech investments, rising research labs, increasing drug discovery projects, and growing adoption of AI-powered image analysis solutions.
- Market Drivers: Growth is driven by rising demand for high-throughput screening, increasing adoption of complex cell-based assays, advances in imaging and AI-based data analysis, expansion of drug discovery pipelines, and growing focus on personalized medicine and safety/toxicity testing.
- Market Opportunity: Key opportunities include AI-powered data-analysis platforms, 3D cell-model screening, expansion into emerging markets, integration of HCS with organ-on-a-chip systems, cloud-based analytics solutions, and development of specialized assays for phenotypic and multi-parametric screening applications.
| Key Insights | Details |
|---|---|
|
Global High Content Screening Market Size (2026E) |
US$ 1.8 Bn |
|
Market Value Forecast (2033F) |
US$ 2.8 Bn |
|
Projected Growth (CAGR 2026 to 2033) |
6.7% |
|
Historical Market Growth (CAGR 2020 to 2025) |
5.9% |
Market Dynamics
Driver - Rising Drug Discovery and Development Activities
Over the past few years, global biopharma R&D has surged significantly, with approximately 5,500 new planned clinical-trial starts in 2021, up 14% compared to 2020. The total number of products in active development exceeded 6,000, a 68% increase since 2016. This rising volume of drug candidates across oncology, immunology, and neurology has intensified the need for early-stage, high-throughput, yet information-rich screening to evaluate efficacy, toxicity, and mechanism of action. High Content Screening (HCS) enables detailed cell-based assays, phenotypic profiling, and multiplexed readouts, supporting large-scale drug discovery pipelines efficiently and accurately.
As drug development pipelines broaden and diversify, traditional biochemical or single-endpoint assays often fail to capture the complexity of cellular responses. HCS provides deep phenotypic screening with imaging and multiparametric readouts, improving the predictive power for in vivo behavior and aiding lead selection. With billions of dollars invested annually in global R&D and increasing demand for safe, effective novel drugs, the adoption of HCS platforms has become essential. Rising drug discovery and development activities are therefore a major driver for the growth of the HCS market worldwide.
Restraints - High Cost of Instruments and Software
Advanced HCS instruments often cost hundreds of thousands of dollars; many high-end systems exceed US $250,000–$350,000 for a full automated imaging plus screening setup. Scientific-grade microscopes with fluorescence or confocal imaging modules, required for high-content assays, routinely cost US $200,000 to $500,000, depending on configuration. The high initial capital outlay makes it prohibitively expensive for small labs, academic institutions or biotech startups especially in resource-limited or emerging-market settings. This alone limits widespread adoption of HCS, even where research demand exists.
Beyond the purchase cost, operational expenses add a significant burden. Running HCS requires proprietary software licenses, specialized reagents and consumables (e.g., assay kits, dyes, multi-well plates), and regular maintenance. High-spec imaging modules (objectives, lasers, cameras), automated plate-handling robotics, and data analysis infrastructure all contribute to recurring cost. For many labs, these ongoing costs plus complexity discourage adoption, making HCS accessible mainly to well-funded organizations and impeding broader market penetration.
Opportunity - Expansion of 3D Cell Models and Organoids
As researchers globally shift away from traditional 2D cell cultures, 3D cell models and organoids have surged in popularity because they better reflect real tissue architecture, cell–cell interactions, and micro-environmental cues. For example, the number of scientific publications on 3D cell culture rose from around 50 in 2000 to over 1,700 by 2020, reflecting widespread adoption in labs. These models more accurately capture cellular behavior, gene expression, and drug response, making them highly suitable for preclinical drug screening, efficacy testing, and toxicity assays.
Because 3D models, especially organoids and spheroids, are increasingly used in drug discovery pipelines, demand for high-throughput, high-content imaging and analysis is growing. Many cancer-research and drug-development labs have incorporated 3D screening platforms to capture more complex phenotypes, tumor-microenvironment effects, or organ-level responses. As a result, HCS platforms can offer much greater value (multiparametric readouts, imaging-based phenotypic endpoints) compared with simple 2D assays, making integration of 3D models a strong growth driver for the HCS market worldwide.
Category-wise Analysis
By Product, Instruments Dominates the High Content Screening Market
Instruments dominates with 41.6% share of the global market in 2025, because automated high-content microscopes, imaging platforms, and flow cytometers are essential for capturing high-resolution, multiparametric cellular data. Instruments account for the largest product-type revenue share, reflecting their foundational role in HCS workflows. Once a lab invests in hardware, consumables, software, and services are layered on, but the instrument remains the operational backbone. Modern HCS instruments offer automated microscopy, high-throughput imaging, robotics integration, live-cell imaging, and multiplexed fluorescent readouts. These capabilities are critical for drug discovery, toxicity assays, and complex cell-based experiments, enabling quantitative, high-content analysis that conventional biochemical or low-content assays cannot achieve, ensuring instruments’ continued dominance in the market.
By Application, Primary & Secondary Screening lead the market, due to high-throughput, multiparametric cell-based testing for early drug discovery.
Primary & secondary screening dominate because HCS enables high-throughput, multiparametric, cell-based testing of large compound libraries something traditional single-endpoint assays can’t match. In practice, up to 71% of drug-discovery programs now incorporate HCS at these early stages to identify “hit” compounds. HCS lets researchers observe multiple cellular responses (morphology, target translocation, viability, signaling) simultaneously in intact cells, allowing rapid triage of thousands of compounds in a single experiment. Because early-stage lead discovery demands speed, scale, and biologically relevant readouts, HCS-based primary/secondary screening becomes the preferred method, driving its dominant share of overall HCS application use.
Regional Insights
North America High Content Screening Market Trends
North America dominates the high-content screening market with 44.1% share in 2025, due to its leading position in life-science R&D and clinical research. The region accounts for nearly 30% of global R&D spending, totaling hundreds of billions of dollars annually, with the U.S. pharmaceutical industry alone investing approximately US$96 billion in 2023. This strong financial and innovation infrastructure supports widespread adoption of HCS instruments, consumables, and software. Additionally, North America hosts thousands of research institutions, biotech companies, and contract research organizations, conducting the highest number of clinical trials globally. The combination of robust funding, advanced infrastructure, high drug discovery activity, and a mature research ecosystem makes North America the largest and most established market for HCS worldwide.
Europe High Content Screening Market Trends
Europe is an important region for the high-content screening market due to its strong investment in life sciences research and development. In 2023, the European Union spent approximately €381 billion on R&D, marking a 58% increase since 2013. Countries such as Germany, Sweden, Belgium, and Austria invested over 3% of their GDP in research activities. This funding supports advanced biomedical infrastructure, including universities, research labs, and pharmaceutical and biotech companies. Additionally, Europe hosts a dense network of clinical trials, translational research centers, and highly skilled scientific personnel. This combination of robust R&D spending, infrastructure, and expertise drives demand for HCS instruments, consumables, and software, making Europe a key market for high-content screening globally.
Asia Pacific High Content Screening Market Trends
Asia Pacific is the fastest-growing region in the market due to the rapid expansion of pharmaceutical and biotech research. Between 2020 and 2025, six major countries such as China, India, Japan, South Korea, Australia, and Singapore initiated nearly 40,000 clinical trials, reflecting increased R&D activity. The region hosts approximately 9,900 active life-sciences startups, driving demand for high-throughput and high-content cellular screening. The growing prevalence of chronic diseases, expanding hospital and laboratory infrastructure, and significant public-private investment in drug discovery further drive HCS adoption. Additionally, Asia Pacific’s large, genetically diverse populations facilitate preclinical and translational research. These factors combined make the region a key driver of global HCS market growth and the fastest-growing market worldwide.
Competitive Landscape
Leading high content screening companies invest in R&D, advanced imaging, and software development, collaborating with pharmaceutical, biotech, and academic labs. By focusing on accuracy, high-throughput phenotypic analysis, and integration with complex cell models, they drive innovation, enhance drug discovery efficiency, support translational research, and accelerate global growth in the HCS market.
Key Industry Developments:
- In December 2025, Thermo Fisher Scientific expanded its bioprocessing capabilities across Asia, enhancing support for local biopharmaceutical manufacturing. The company invested in advanced equipment, technology platforms, and regional facilities to strengthen production, accelerate biologics development, and meet growing demand for high-quality bioprocessing solutions across Asian markets.
- In November 2025, Revvity collaborated with MDIC and NIST to launch new somatic cancer reference standards aimed at improving diagnostic assay accuracy. The initiative provided standardized materials for laboratories and researchers, enabling more reliable testing, enhancing assay performance, and supporting consistent, high-quality results in cancer diagnostics and research applications.
Companies Covered in High Content Screening Market
- Thermo Fisher Scientific Inc.
- Danaher Corporation
- Revvity, Inc.
- GE HealthCare Technologies Inc.
- Becton, Dickinson and Company
- Yokogawa Electric Corporation
- Agilent Technologies Inc.
- Olympus Corporation
- Sartorius AG
- Tecan Group Ltd.
- Merck KGaA
- Bio-Rad Laboratories, Inc.
- Arrayjet Ltd.
- Bitplane AG (Oxford Instruments)
- Others
Frequently Asked Questions
The global high content screening market is projected to be valued at US$ 1.8 Bn in 2026.
Rising drug discovery, complex cell-based assays, AI-driven imaging, demand for high-throughput screening, and personalized medicine drive HCS growth.
The global high content screening market is poised to witness a CAGR of 6.7% between 2026 and 2033.
AI integration, 3D cell models, organoids, cloud-based analysis, emerging markets expansion, personalized medicine, and advanced phenotypic screening drive HCS opportunities.
Thermo Fisher Scientific Inc., Danaher Corporation, Revvity, Inc., GE HealthCare Technologies Inc., Becton, Dickinson and Company, Yokogawa Electric Corporation.


