


- Chipsets & Processors
- GaN Adapters Market
GaN Adapters Market Size, Share, and Growth Forecast 2026 - 2033
GaN Adapters Market by Product Type (1 port Power Charger, 2 Port Power Charger, 4 Port Power Charger), Power (45 W, 65 W, More than 100 W) Application (Mobile Phones, Computers & Laptops, Others), and Regional Analysis for 2026 - 2033
GaN Adapters Market Size and Trends Analysis
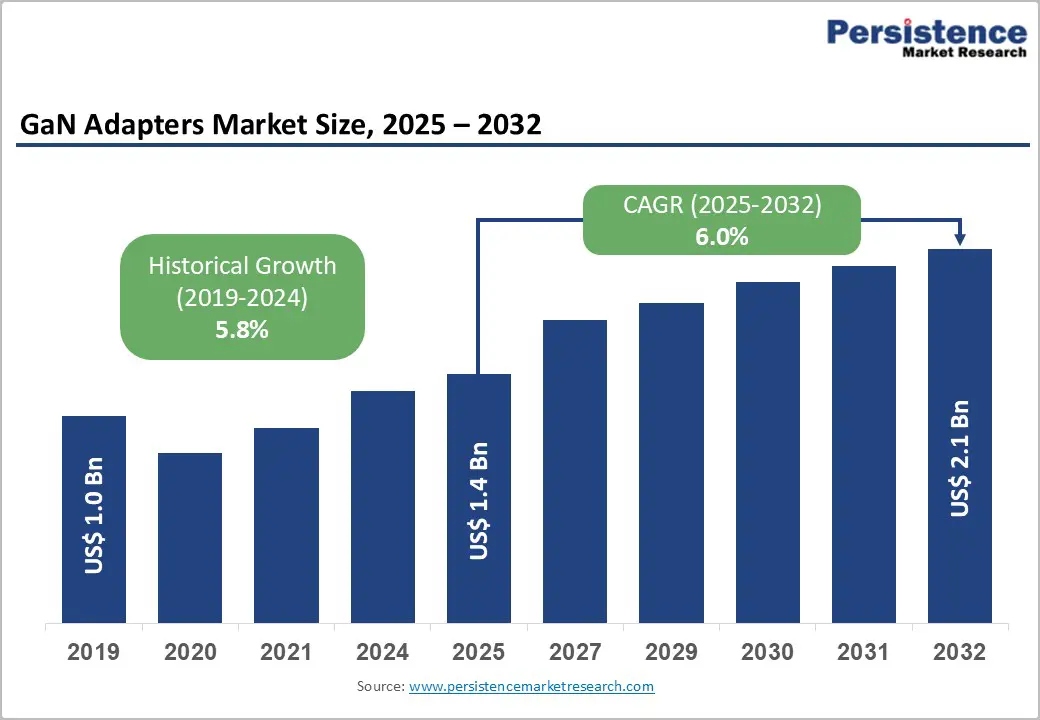
The global GaN adapters market size is likely to be valued at US$1.5 billion in 2026 and is expected to reach US$2.3 billion by 2033, growing at a CAGR of 6.0% during the forecast period from 2026 to 2033, driven by the rising adoption of fast-charging, energy-efficient, and compact power solutions across consumer electronics, laptops, and emerging automotive applications.
The increasing adoption of USB-C power delivery standards, along with the growing demand for high-wattage chargers for premium devices and the shift toward portable multi-device charging, is driving market expansion. The growing awareness of energy efficiency and sustainability, combined with gradual cost reductions in GaN components, is fostering broader adoption across both consumer and commercial segments.
Key Industry Highlights:
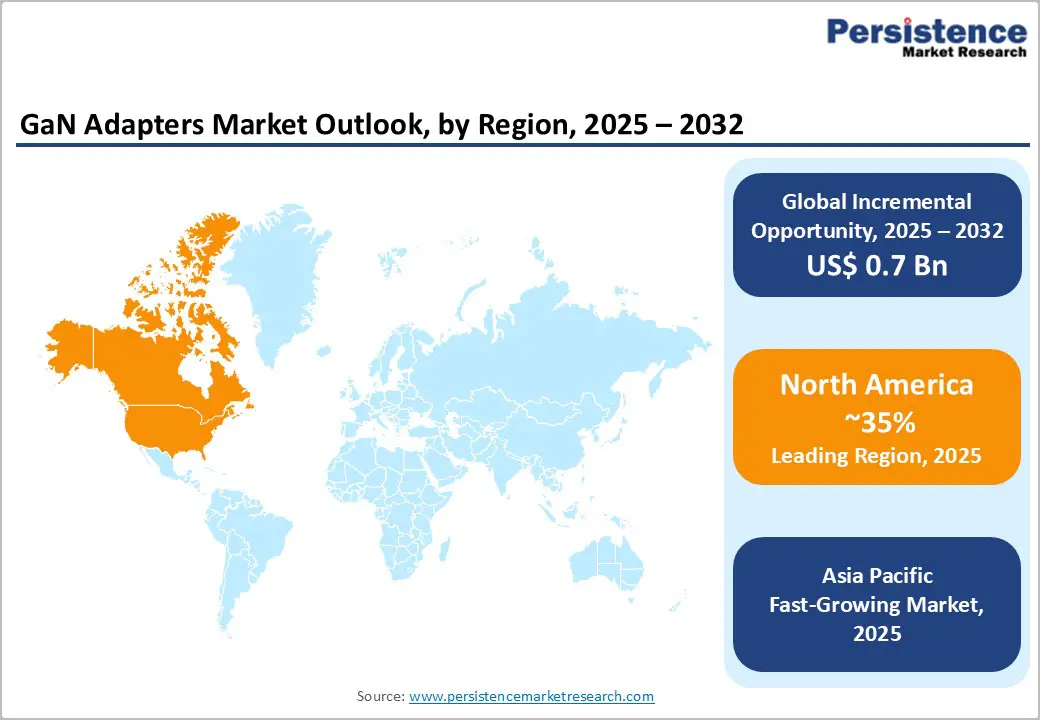
- Leading Region: North America is anticipated to be the leading region, accounting for a market share of 35% in 2026, driven by strong consumer electronics demand, robust R&D in GaN technologies, and supportive green-energy and EV infrastructure policies.
- Fastest-growing Region: Asia Pacific is likely to be the fastest-growing region in the GaN adapters in 2026, driven by China, Japan, India, and ASEAN, fueled by large-scale electronics manufacturing, rising digital device consumption, and government initiatives supporting local semiconductor production and clean energy adoption.
- Leading Product Type: The 1 port power charger segment is projected to represent the leading product segment with 50% revenue share in 2026, due to strong consumer preference for single-device dedicated adapters.
- Leading Power Type: The 65W GaN adapters segment is anticipated to be the leading power type, accounting for over 30% of the revenue share in 2026, due to widespread adoption in laptops and mid-range electronic devices.
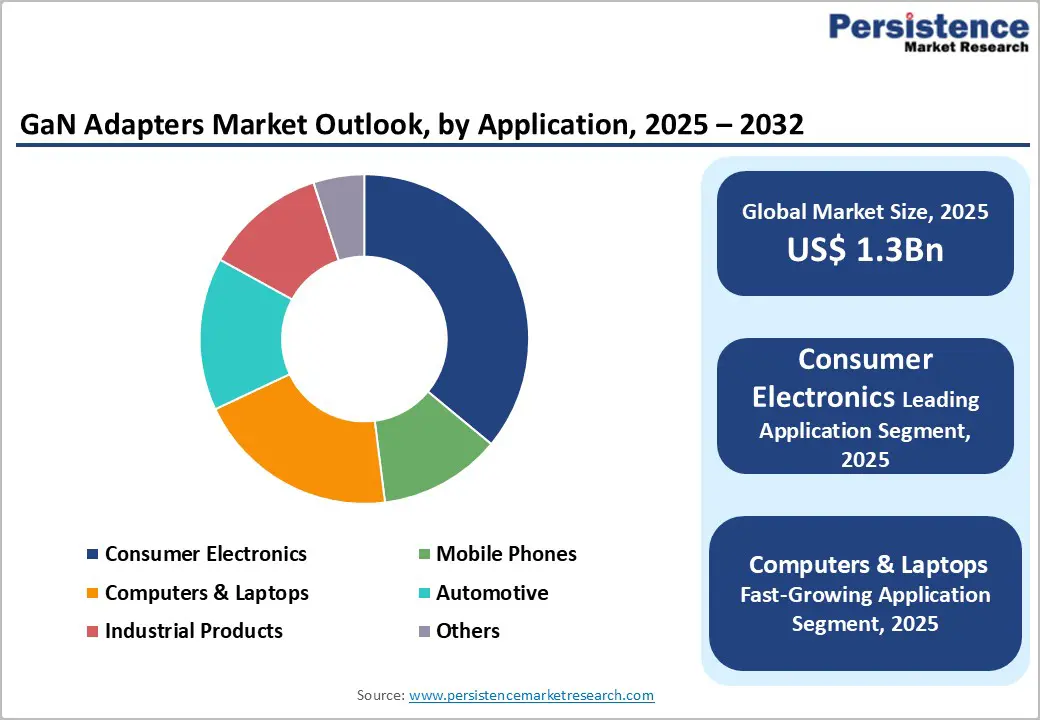
- Leading Application Type: The consumer electronics segment is projected to represent the leading application type in 2026, accounting for 40% of the revenue share, driven by smartphones, tablets, and wearables.
| Key Insights | Details |
|---|---|
|
GaN Adapters Market Size (2026E) |
US$1.5 Bn |
|
Market Value Forecast (2033F) |
US$2.3 Bn |
|
Projected Growth CAGR (2026-2033) |
6.0% |
|
Historical Market Growth (2020-2025) |
5.8% |
Market Factors - Growth, Barriers, and Opportunity Analysis
Rising Demand for Fast Charging in Consumer Electronics
The demand for GaN (Gallium Nitride) adapters is being driven by consumers' increasing desire for fast charging in their everyday electronics. With smartphones, tablets, and laptops increasingly supporting high-wattage power delivery standards such as USB-C PD, GaN technology enables the creation of compact, efficient adapters that deliver these fast charging speeds with minimal heat loss. This surge in demand is largely due to the rising preference for quick and efficient charging solutions in consumer tech. The removal of bundled chargers by several smartphone brands has increased consumer demand for standalone fast-charging adapters, accelerating the adoption of GaN technology.
GaN adapters are much smaller and lighter than traditional silicon-based adapters. This miniaturization appeals to mobile users who prioritize portability without compromising on power. The compact design is particularly attractive to users of smartphones, tablets, laptops, and other portable devices, offering convenience without sacrificing charging speed. As high-wattage devices such as gaming laptops, AI-powered notebooks, and wearables become more widespread, consumers are increasingly in need of fast, reliable, and efficient chargers. The rising trend of multi-device ecosystems is further driving demand for GaN adapters capable of charging multiple devices simultaneously.
High Initial Cost Compared to Traditional Silicon Chargers
The GaN adapter market faces considerable challenges due to the higher upfront cost compared to traditional silicon-based chargers. The manufacturing of GaN semiconductors involves specialized techniques, such as precise epitaxial growth and substrate preparation, which increase production costs. GaN devices typically have lower yields than silicon, increasing the cost burden for manufacturers. Despite their superior performance, the higher cost of GaN chargers limits their appeal, especially among price-sensitive consumers. This issue is particularly pronounced in emerging markets and mass-market segments, where affordability is a major factor in purchasing decisions.
Consumer awareness and perception also play a significant role in hindering the adoption of GaN chargers. Many users remain unaware of the benefits of GaN technology, such as greater energy efficiency, smaller size, lighter weight, and faster charging speeds compared to traditional silicon chargers. This lack of awareness makes it difficult for manufacturers to justify the higher price, even though GaN adapters offer long-term energy savings and improved thermal performance. As a result, consumers often prioritize immediate cost savings over the long-term advantages of GaN technology, slowing its widespread adoption.
Expansion in Electric Vehicle (EV) Charging Infrastructure
The rapid expansion of the electric vehicle (EV) market creates a major opportunity for GaN chargers, particularly in high-efficiency charging infrastructure. Gallium Nitride (GaN) power chips are being increasingly integrated into on-board EV adapters (OBCs) and DC–DC converters, where their ability to operate at higher switching frequencies enables much higher power densities, as well as reduced size and weight. These benefits allow automakers to design more compact and efficient charging systems, improving energy utilization and overall vehicle performance.
The surge in government and private sector investments in EV charging infrastructure is driving demand for GaN-powered solutions. The growth of public fast-charging networks and home charging systems requires compact, reliable, and thermally efficient power electronics, where GaN technology outperforms traditional silicon. As the cost of GaN devices continues to decrease due to economies of scale and technological advancements, their adoption in EV chargers is expected to rise. This positions the EV charging ecosystem as one of the most promising and high-growth areas for GaN adapters and power electronics manufacturers.
Category-wise Analysis
Product Type Insights
The 1 port GaN adapter segment is expected to lead the market, accounting for around 50% of revenue share in 2026, driven by the widespread consumer preference for single-device chargers, particularly for smartphones, tablets, and laptops. Users appreciate the compact size, portability, and efficiency that GaN technology offers in a single-port design. Many premium laptops and mobile devices are now bundled with 1 port GaN adapters, encouraging their adoption. Single-port adapters are especially appealing to cost-conscious consumers who need reliable and convenient charging for a single device. For instance, companies such as Apple and Samsung are increasingly including or recommending compact single-port USB-C GaN chargers with their smartphones and tablets.
2-port and 4-port GaN adapters are likely to represent the fastest-growing segment, driven by the increasing demand for multi-device charging in both residential and commercial environments, such as offices, co-working spaces, and homes with multiple electronic devices. These multi-port adapters allow for the simultaneous charging of laptops, phones, tablets, and wearables, offering a compact design without compromising efficiency. As consumers look for convenience and a reduction in clutter, the adoption of 2-port and 4-port GaN adapters is accelerating, positioning them as a key driver of market growth in the coming years. Brands such as Anker, Baseus, and Belkin have already launched multi-port GaN chargers designed for remote workers and travelers, fueling this trend.
Power Type Insights
The 65 W segment is projected to lead the market, capturing around 30% of the revenue share in 2026. This wattage has become the preferred choice for laptops, tablets, and mid-range electronic devices, as it strikes an ideal balance between charging speed, portability, and energy efficiency. Consumers appreciate the compact design of 65 W GaN chargers, which deliver fast charging without the bulk typically associated with traditional silicon adapters. The combination of high performance, convenience, and broad compatibility with popular devices has cemented the 65 W charger as the market leader. For instance, ultrabooks such as the Apple MacBook Air and Dell XPS models are optimized to work efficiently with 65 W GaN chargers.
The 100 W+ segment is likely to be the fastest-growing, driven by the increasing demand for high-power laptops, gaming systems, mobile workstations, and certain industrial applications that require higher energy capacity and enhanced efficiency. GaN technology enables these high-wattage adapters to remain compact and thermally stable, making them well-suited for power-intensive environments. For example, gaming laptops such as the ASUS ROG and Lenovo Legion are increasingly relying on 100 W+ USB-C GaN chargers. As both consumers and businesses adopt more power-hungry devices, the demand for 100 W+ GaN adapters is set to grow rapidly, presenting a significant growth opportunity for manufacturers in the coming decade.
Application Type Insights
The consumer electronics segment is expected to lead, accounting for 40% of the revenue share in 2026, driven by the widespread adoption of smartphones, tablets, wearables, and other portable devices that demand fast, efficient, and compact charging solutions. GaN chargers are particularly well-suited for these devices due to their smaller size, higher energy efficiency, and better thermal performance compared to traditional silicon chargers. For example, flagship smartphones from brands such as Samsung and Xiaomi are increasingly designed to support high-wattage USB-C GaN fast chargers. The combination of portability, speed, and reliability ensures that consumer electronics continue to dominate the GaN adapter market.
The automotive sector is likely to be the fastest-growing application, propelled by the rapid adoption of electric vehicles (EVs) and the expansion of charging infrastructure. High-power GaN chargers are becoming integral to on-board chargers and public fast-charging stations, offering a compact design, high efficiency, and faster energy transfer. Automakers and suppliers are incorporating GaN into EV on-board charging systems, while fast-charging stations are increasingly adopting GaN-based power modules to reduce size and improve overall efficiency. The computers and laptops segment remains strong in revenue, as high-performance laptops and workstations rely on GaN chargers for efficient and rapid charging. This highlights the strong growth potential across both the automotive and high-performance computing applications.
Regional Insights
North America GaN Adapters Market Trends
North America is anticipated to be the leading region, accounting for a market share of 35% in 2026, driven by tech-savvy consumers, high disposable incomes, and early adoption of fast-charging accessories. In particular, the U.S. is fueling demand with a growing base of premium smartphones, laptops, and ultra-portable devices that prioritize compact and efficient GaN power solutions. Leading GaN charger companies such as Anker, Belkin, and Baseus are heavily investing in R&D and creating multi-device fast-charging solutions specifically designed for North American consumers. The widespread adoption of USB-C Power Delivery standards and the popularity of work-from-anywhere lifestyles are increasing the demand for high-wattage GaN chargers.
North America is also capitalizing on GaN technology for EV charging applications. The region’s push toward electrification, supported by regulatory incentives and infrastructure funding, is driving the need for high-efficiency onboard chargers and power converters using GaN semiconductors. With the rise in EV deployments and federal initiatives supporting the development of nationwide charging networks, GaN-based power electronics are increasingly preferred for their compact size, high switching frequencies, and superior thermal efficiency. Automakers and Tier-1 suppliers are integrating GaN solutions to enhance charging efficiency and reduce vehicle weight.
Europe GaN Adapters Market Trends
Europe is likely to be a significant market for GaN adapters in 2026, driven by strong regulatory support and a high level of consumer awareness around energy efficiency and sustainability. Major European electronics retailers and e-commerce platforms are increasingly promoting GaN chargers as the preferred fast-charging solution, which is boosting visibility and accelerating adoption throughout the region. European consumers highly value compact, fast, and efficient power supplies, making GaN technology a perfect fit. The widespread adoption of USB-C charging standards across consumer devices is fueling demand for GaN adapters in both personal and professional contexts.
Europe’s ongoing shift toward electric mobility is also creating significant opportunities for GaN adoption in automotive and charging applications. High-efficiency GaN power modules are being integrated into EV on-board chargers and power-conversion systems due to their compact size, superior thermal performance, and reduced energy losses. Germany, with its strong automotive manufacturing sector, is a leading market where GaN solutions are gaining traction in EV applications, aligning with national clean energy and electrification goals. Automotive OEMs and Tier-1 suppliers across Europe are actively exploring GaN technology to meet stricter efficiency and emissions regulations.
Asia Pacific GaN Adapters Market Trends
Asia Pacific is likely to be the fastest-growing region, driven by a robust electronics manufacturing ecosystem and a vast, digitally connected consumer base. Key countries, including China, Japan, South Korea, and India, are central to this growth, thanks to large-scale production and consumption of smartphones, laptops, and smart devices that increasingly demand fast, compact charging solutions. Rising disposable incomes and the rapid adoption of premium, high-wattage consumer electronics are fueling the demand for GaN adapters, as consumers seek efficient, lightweight, and travel-friendly charging options.
Government initiatives and semiconductor development programs are strengthening Asia Pacific's position in the GaN adapters market. China’s continued investments in next-generation power electronics, India’s domestic manufacturing incentives under the Make in India initiative, and Japan’s advancements in GaN semiconductor research are all driving large-scale adoption. The growing push for electric mobility across China and Southeast Asia is boosting demand for GaN technology in high-efficiency power conversion and charging applications.
Competitive Landscape
The global GaN adapters market is moderately fragmented, driven by rapid product innovation, a variety of regional brands, and growing demand across both consumer and industrial sectors. Market participants range from semiconductor specialists to consumer electronics OEMs, fostering dispersed competition that accelerates innovation and leads to frequent product launches.
Key players in the market include Anker Innovations, Belkin, GaN Systems, Navitas Semiconductor, Xiaomi, Baseus, RAVPower, Infineon, and Delta Electronics. These companies utilize a mix of proprietary GaN ICs, licensing partnerships, and branded charger lines to serve both component and finished-product markets. The launch of new multi-port GaN products, collaborations between GaN IC suppliers and charger manufacturers, and an expansion of retail listings all highlight how R&D, channel reach, and speed to market play a crucial role in gaining a competitive edge in this rapidly evolving sector.
Key Industry Developments:
- In November 2025, TESSAN introduced its 140W Universal Travel Adapter with GaN technology, expanding its portfolio of high-performance charging solutions. Designed for international travelers, remote professionals, and students, the adapter supports multi-device fast charging in a compact, travel-friendly form factor. The launch aligns with rising mobility and the growing need for reliable, high-wattage charging solutions across diverse regional power standards.
- In October 2025, Oakter launched its 65W True GaN Charger in India, designed for fast and efficient charging of laptops and smartphones. Bundled with a 1.5-meter USB-C cable, the charger uses GaN technology to deliver high power in a compact, lightweight form factor. A key differentiator is its India-specific 3-pin plug, offering a more secure and stable fit than common two-pin designs, along with enhanced safety features for reliable everyday charging.
Companies Covered in GaN Adapters Market
- Belkin International Inc.
- GaN Systems Inc.
- CUI Inc.
- Digi-Key Electronics
- Lenovo Group Limited
- Texas Instruments Incorporated
- IOGEAR
Frequently Asked Questions
The GaN adapters market is valued at US$1.5 billion in 2026 and expected to reach US$2.3 billion by 2033, reflecting robust growth.
The primary demand drivers for the GaN adapters market are technological advancements in GaN semiconductors, which enable more efficient and compact adapters, along with growing consumer demand for fast charging in mobile and computing devices.
The 1 port power charger segment currently leads market share, while 2-port and 4-port segments exhibit faster growth rates.
North America is anticipated to dominate, capturing over 35% market share in 2026, driven by strong consumer electronics demand, robust R&D in GaN technologies, and supportive green‑energy and EV infrastructure policies.
A key opportunity in the GaN adapters market lies in the electric vehicle charging infrastructure sector, where GaN's efficiency and high-power capabilities can help meet the growing demands of EV charging.


