


- Sporting Goods & Equipment
- Sports Equipment Market
Sports Equipment Market Size, Share, Trends, and Growth Forecast, 2026 - 2033
Sports Equipment Market by Product Type (Ball over net games, Ball games, Fitness/Strength equipment, Athletic training equipment, and Others), by Distribution Channel (Specialty & sports shops, Online retail, and Department & discount stores), and Regional Analysis for 2026 - 2033
Sports Equipment Market Size and Trends Analysis
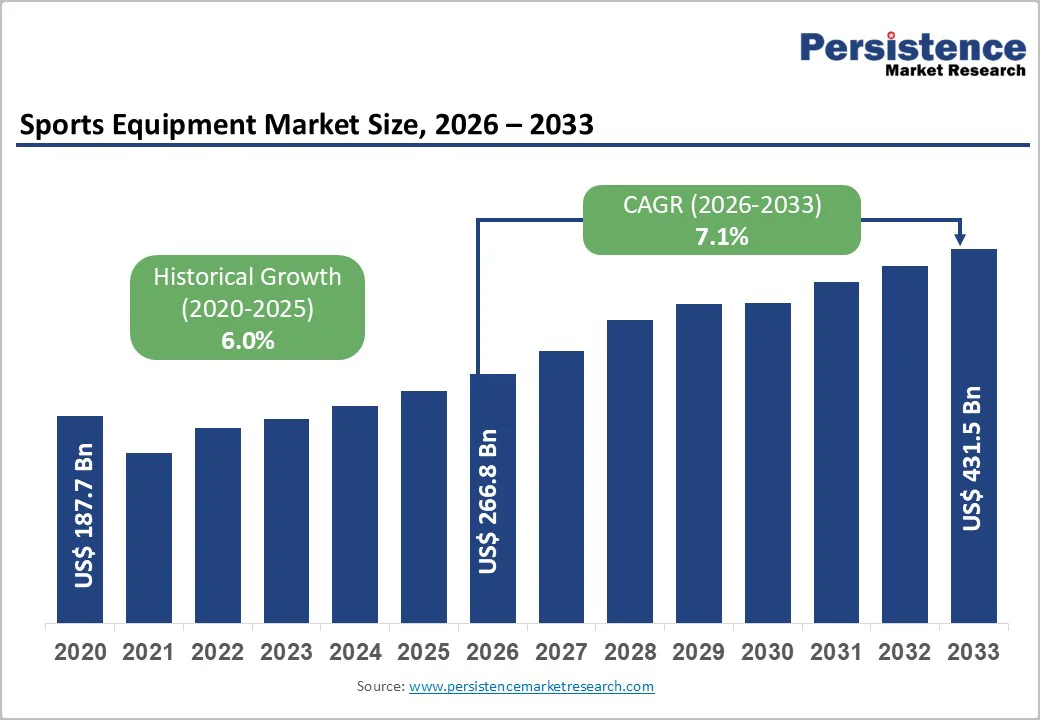
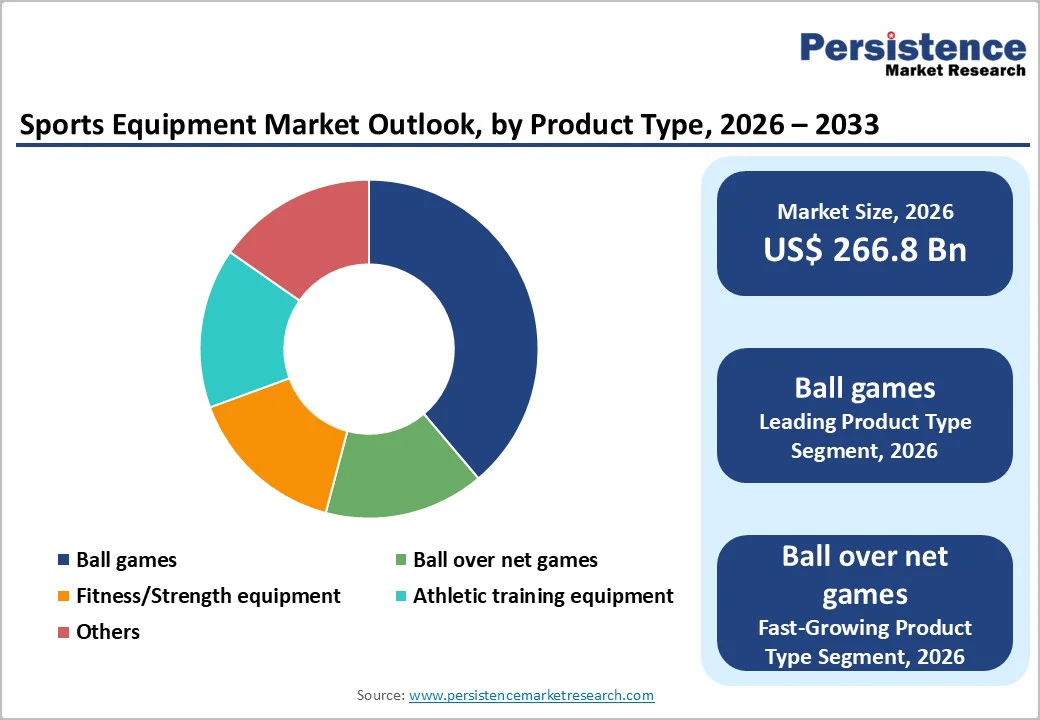
The global sports equipment market size is valued at US$ 266.7 billion in 2026 and is projected to reach US$ 431.5 billion by 2033, growing at a CAGR of 7.1% between 2026 and 2033. This robust growth is primarily driven by the increasing global health and wellness trend, which is converting fitness from a casual interest into a core lifestyle identity for many consumers.
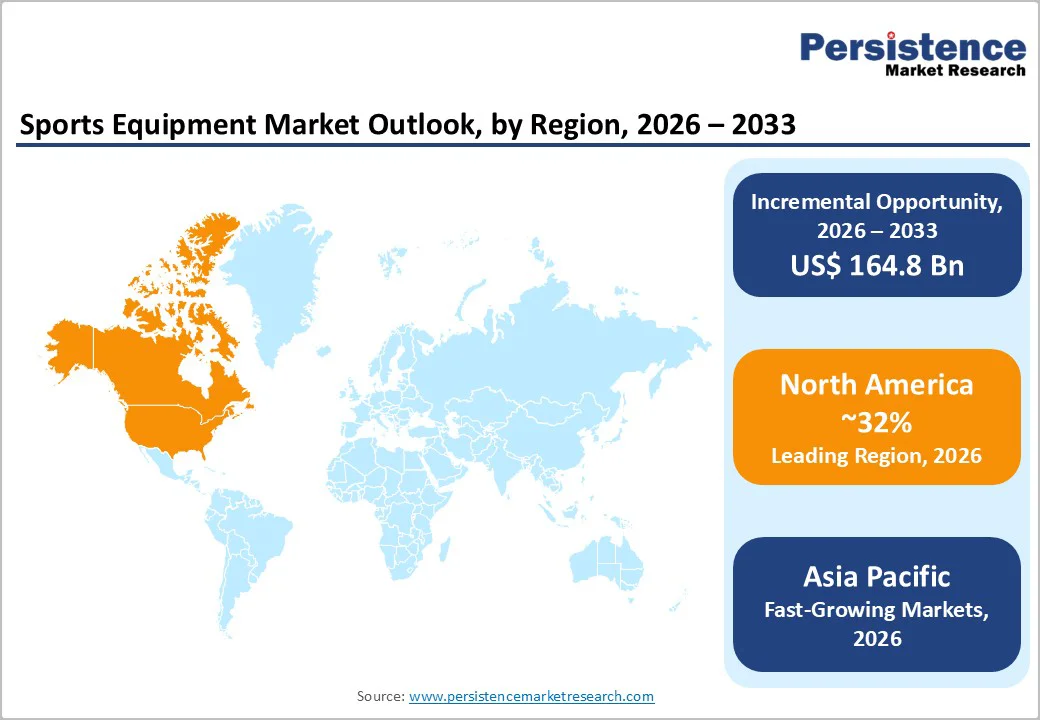
The market is further propelled by significant technological integration, such as the adoption of smart equipment with biometric sensors and carbon fiber materials, which enhances product performance and justifies premium pricing. Geographically, North America currently holds the largest revenue share (over 32%), while the Asia Pacific region is forecast to be the fastest-growing market due to rising disposable incomes, rapid urbanization, and government initiatives promoting sports participation, particularly in emerging economies like India and China.
Key Industry Highlights:
- Global physical inactivity reached 31% in 2022 and is projected to rise to 35% by 2030, representing 1.8 billion inactive adults.
- According to WHO, high-income countries in Asia reveal the highest inactivity levels at 48%, followed by South Asia at 45%, compared with only 14% in Oceania.
- Product Type Analysis: Ball game equipment leads the global market with a 35% revenue share and maintains stable growth at a 6.3% CAGR.
- Fitness and strength equipment, along with net-based sports gear, are expanding rapidly with annual growth rates exceeding 7.8%. Specialty and sports stores maintain dominance with 45% market share, while online retail accelerates as the fastest-growing channel at 7.4% CAGR.
- Premium smart fitness equipment and wearable-integrated products are growing at a strong 7.49% CAGR, driven by AI-enabled performance analytics.
- North America accounts for 32% of global sports equipment revenue and recorded a 47.7% surge in sports technology M&A transactions in 2025. Asia-Pacific is the fastest-growing region at 7.5% CAGR, with China’s outdoor and fitness orders rising 221% over 2019 levels.
- China’s demand surged sharply, with outdoor gear orders increasing 221% compared to 2019, highlighting explosive demand growth.
- India’s sports equipment market continues strong expansion, supported by rapid urbanization and growing middle-class purchasing power.
- Ball-over-net sports such as badminton and volleyball are among the fastest-growing categories, supported by Asia-Pacific school adoption.
| Key Insights | Details |
|---|---|
|
Sports Equipment Market Size (2026E) |
US$ 266.8 Bn |
|
Market Value Forecast (2033F) |
US$ 431.5 Bn |
|
Projected Growth (CAGR 2026 to 2033) |
7.1% |
|
Historical Market Growth (CAGR 2020 to 2025) |
6.0% |
Market Dynamics
Driver - Rising Global Health Consciousness and Sedentary Lifestyle Remediation
The increasing global awareness of health and fitness is the single most significant catalyst for market expansion. This is quantitatively evidenced by the shift in consumer spending, where sports equipment is moving from a discretionary purchase to an essential health infrastructure investment. As per the World Health Organization (WHO), the share of physically inactive adults reached 31% in 2022, a figure projected to rise to 35% by 2030, presenting an enormous untapped market of approximately 1.8 billion people globally. The highest rates of physical inactivity were observed in the high-income Asia Pacific (48%) and South Asia (45%), with levels of inactivity in other regions ranging from 28% in high-income Western countries to 14% in Oceania. (The Lancet Global Health, August 2024). This existential risk is simultaneously the industry’s greatest opportunity. The market impact is seen in the surge of demand for fitness/strength equipment (the fastest-growing product category in the Asia Pacific region) and individual-focused gear, as consumers seek tools to mitigate the effects of modern sedentary lifestyles, driving a CAGR of over 7.0% in the forecast period.
Technological Innovation and Smart Equipment Integration
The sports equipment market is experiencing a technological revolution that fundamentally enhances product value propositions and user engagement. Wearable technology has emerged as the number one fitness trend for 2025, with AI-powered wearables offering personalized coaching, injury prevention tips, and real-time performance analytics. Smart equipment now integrates sensors, GPS technology, and machine learning algorithms to provide comprehensive insights into heart rate variability, muscle fatigue, movement efficiency, and recovery patterns. The market for smart fitness equipment and wearables is expanding rapidly, with devices like advanced fitness trackers monitoring stress hormones, blood oxygen saturation, and early signs of illness through biometric analysis. Connected fitness devices and platforms offering live and on-demand classes, gamified challenges, and community features have transformed home fitness experiences. This technological momentum drives premium segment growth at 7.49% CAGR, as consumers increasingly invest in high-quality, technology-integrated equipment that enhances workout experiences and provides quantifiable performance improvements
Restraint - Supply Chain Disruptions and Tariff-Related Cost Pressures
The sports equipment industry faces significant headwinds from escalating tariff regimes and geopolitical trade tensions. U.S. tariff policies implemented in 2025 have increased steel and aluminum duties to as much as 50%, with tariffs expanding to machinery, electronics, and sporting goods categories. These tariff increases directly elevate costs on raw materials, including steel, aluminum, and plastics, alongside electronic components essential for smart equipment manufacturing. Reciprocal tariffs from India, the EU, Canada, and China further compound supply chain complexity and cost pressures.
Business studies indicate that tariff increases could significantly affect pricing and inventory management strategies, with companies accelerating efforts to derisk and diversify supply chains. For small recreational retailers and equipment distributors, these cost pressures directly translate to shrinking profit margins, creating inventory cutbacks and price increases that reduce consumer access to quality products. The fitness industry specifically is experiencing disruption in international supply chains, with manufacturers and retailers grappling with increased costs for imported goods and seeking alternative suppliers in non-tariff regions.
Opportunity - Participation Expansion Among Women and Children Demographics
Female and youth participation in sports demonstrates exceptional growth potential, with limited market saturation compared to traditional male-focused segments. Women's growing awareness of physical activity benefits, including improved health, mental resilience, and empowerment, continues driving participation expansion across diverse sports categories. Educational institutions, government initiatives, and grassroots programs actively encourage greater youth involvement, directly increasing demand for age-appropriate and performance-optimized equipment. Products tailored to women's and children's demographics remain relatively underdeveloped in many categories, creating first-mover advantages for manufacturers addressing these segments. According to recent data, women comprised 50% of the racket sports equipment market growth in 2022, with women's segments anticipated to expand at a 5.2% CAGR.
Category-wise Analysis
Product Type Insights
The global sports equipment market continues to evolve, with ball game equipment sustaining its position as the largest and most established product type segment. Accounting for nearly 35% of total market revenue, this category benefits from the universal appeal of sports such as soccer, basketball, tennis, and cricket—activities that require relatively low infrastructure and attract participants across income groups and age brackets. Its broad product portfolio, ranging from professional-grade balls and racquets to protective gear and training accessories, ensures strong penetration across both professional and recreational markets. Supported by leading global leagues like FIFA, the NBA, Wimbledon, and the IPL, and reinforced by widespread school-level sports participation, the segment is expected to maintain a stable 6.3% CAGR, reflecting its maturity in developed regions and ongoing expansion in emerging economies.
In contrast, ball-over-net games have emerged as the fastest-growing category, fueled by rising global interest in volleyball, badminton, and informal net-based sports. These activities offer low skill barriers, flexible play environments, and increasing adoption across Asia-Pacific schools. Alongside this surge, fitness and strength equipment is also expanding rapidly, supported by home-gym adoption, wearable integration, and personalized training technologies both segments growing above 7.8% annually and reshaping market dynamics.
Distribution Channel Insights
The global sports equipment market is undergoing a structural shift in its distribution dynamics, yet specialty and sports shops continue to hold a strong position, accounting for nearly 45% of total revenue. Their dominance stems from long-standing consumer trust, expert product guidance, and the ability to offer hands-on equipment testing advantages, particularly valuable for high-performance gear where precision fit directly influences athletic results. These retailers further reinforce loyalty through post-purchase services and community-centric engagement, although they increasingly face pressure from declining footfall and the rapid expansion of digital commerce. As a result, many are integrating omnichannel models, blending in-store expertise with online convenience to remain competitive.
In contrast, online retail is advancing as the fastest-growing distribution channel, projected to expand at a robust 7.4% CAGR through 2032. E-commerce platforms offer broad product visibility, price transparency, and 24/7 accessibility while enabling manufacturers to build direct-to-consumer relationships and leverage real-time data for assortment optimization. Innovations such as AR-based virtual try-ons, AI-driven personalization, and improved logistics networks are reducing traditional barriers related to fit and equipment suitability. Department and discount stores continue to contribute modestly by capitalizing on wide assortments and value-driven pricing strategies.
Regional Analysis
North America Strengthens Leadership Through Innovation, Premium Demand, and Expanding Technology-Driven Sports Ecosystems
North America continues to reinforce its position as the global innovation hub for sports equipment, accounting for nearly 32% of worldwide market revenue and demonstrating strong momentum across both the United States and Canada. This dominance is driven by deeply rooted sports culture, high disposable incomes, and mature recreational and professional sports ecosystems that consistently create demand for premium and technology-enabled products. Technological advancement remains the region’s defining growth pillar, with consumers rapidly adopting AI-enabled wearables, connected equipment, and performance-tracking devices. Rising health consciousness, strong fitness infrastructure, and high gym membership penetration further fuel demand, while mature e-commerce systems enhance product accessibility.
The regulatory environment anchored by ASTM and CPSC standards ensures high product safety and quality, supporting premium brand positioning despite added compliance costs. Competitive dynamics remain concentrated, with global leaders such as Nike, Adidas, and Under Armour leveraging advanced R&D, athlete endorsements, and lifestyle branding. Investment activity is accelerating, particularly in sports technology, where M&A transactions surged 47.7% in 2025, highlighting growing opportunities in youth sports professionalization, digital fitness ecosystems, and integrated technology platforms.
Rapid Expansion Positions Asia-Pacific as Global Sports Equipment Growth Hub, Powered by Urbanization, E-Commerce, and Rising Participation Levels
Asia-Pacific continues to reinforce its status as the fastest-growing regional market, projected to expand at a 7.5% CAGR. This growth trajectory is driven by a dynamic blend of mature, rapidly developing, and emerging economies, each adding unique competitive strengths and contributing to the region’s overall momentum. China remains the dominant force, driven by explosive demand for outdoor and fitness products, with orders for camping, cycling, and hiking gear rising 221% from 2019 levels. India, meanwhile, stands out as the highest-growth country, supported by rapid urbanization, rising disposable income, expanding e-commerce penetration, and major government investments in sports infrastructure. Japan sustains a premium-positioned market with refined consumer preferences, while ASEAN economies such as Vietnam, Indonesia, and the Philippines demonstrate strong momentum driven by rising sports participation and middle-class expansion.
Core growth drivers include accelerating urbanization, growing middle-income populations, and expanding digital fitness ecosystems that enhance accessibility across the region. Investment flows into sports infrastructure, technology platforms, and equipment manufacturing further strengthen Asia-Pacific’s position as a global production hub, creating significant opportunities for global brands and local innovators alike.
Competitive Landscape
The global sports equipment market operates within a moderately fragmented competitive structure comprising global mega-brands maintaining substantial market share supplemented by regional manufacturers and specialized product-focused competitors. Leading players include Nike, Inc., Adidas AG, Decathlon S.A., Under Armour, Inc., Puma SE, ASICS Corporation, and emerging technology-focused manufacturers with market concentration levels reflecting varied maturity across product categories and geographic regions. The market demonstrates consolidated characteristics in premium athletic apparel and footwear segments, where established brands leverage extensive athlete partnerships, global distribution networks, and substantial R&D capabilities, maintaining market leadership positions. Conversely, specialized sports equipment categories (tennis racquets, golf clubs, cycling gear) demonstrate lower concentration levels, with established equipment manufacturers maintaining regional dominance. E-commerce-native brands and direct-to-consumer models increasingly challenge traditional distribution hierarchies, particularly among younger demographic segments seeking authentic brand storytelling and sustainability credibility.
Key Industry Developments:
- In May 2025, Decathlon announced a $1 billion investment plan to open 100 stores in India over five years, marking a major geographic expansion aimed at capturing the region’s rapidly growing middle-class consumer base.
- In October 2024, GXO Logistics formed a strategic partnership with Forum Sport to manage its logistics operations in Spain, strengthening European supply chain resilience and enabling more efficient omni-channel fulfillment.
- In June 2024, Swiss sportswear brand On partnered with Japanese retailer Beams to launch a tennis lifestyle collection, leveraging the growing fusion of performance gear and lifestyle fashion across high-fashion Asian markets.
- In January 2024, Adidas and Reebok announced a co-branding and co-development collaboration focused on fitness technology products, combining Adidas’ design strengths with Reebok’s digital expertise to accelerate innovation in the smart fitness segment.
Companies Covered in Sports Equipment Market
- Adidas AG
- Amer Sports
- Callaway Golf Company
- Sumitomo Rubber Industries Limited
- Nike, Inc.
- Puma SE
- Mizuno Corporation
- Sports Direct International PLC
- Under Armour
- Yonex Co., Ltd
- Cabela’s incorporated
- GLOBERIDE, Inc
- Jarden Corporation
- Other Market Players
Frequently Asked Questions
The Sports Equipment market is estimated to be valued at US$ 266.8 Bn in 2026.
The key demand driver for the Sports Equipment market is the rapid rise in health, fitness, and active lifestyle adoption, fueled by growing awareness of physical well-being, rising participation in recreational and organized sports, and expanding investments in sports infrastructure across emerging and developed markets.
In 2026, the North America region will dominate the market with an exceeding 32% revenue share in the global Sports Equipment market.
Among distribution channels, specialty & sports shops has the highest preference, capturing beyond 45% of the market revenue share in 2026, surpassing other distribution channels.
Adidas AG, Amer Sports, Callaway Golf Company, Sumitomo Rubber Industries Limited, Nike, Inc., and Puma SE are a few leading players in the Sports Equipment market.


