


- Sporting Goods & Equipment
- Sporting Goods Market
Sporting Goods Market Size, Trends, Share, and Growth Forecast, 2026 - 2033
Sporting Goods Market by Product Type (Apparel, Equipment, Shoes), Sales Channel (Distributors, Supermarkets, Specialty Stores, Online Stores, Independent Stores), End-user (Beginner, Intermediate, Professional), and Regional Analysis for 2026 - 2033
Sporting Goods Market Size and Trends Analysis
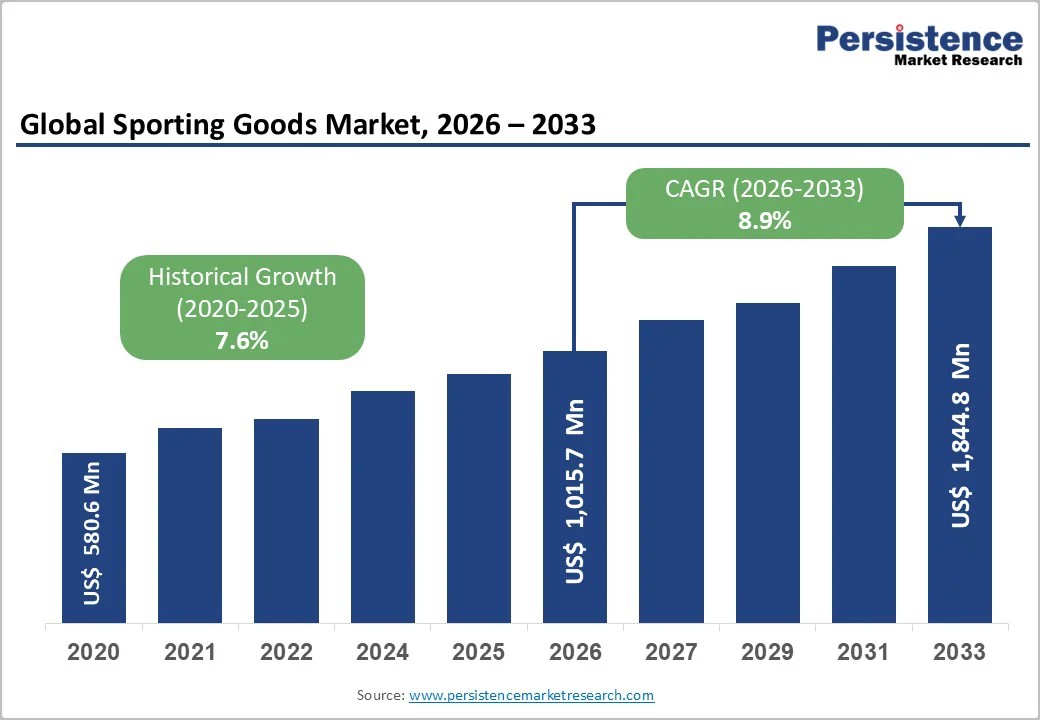
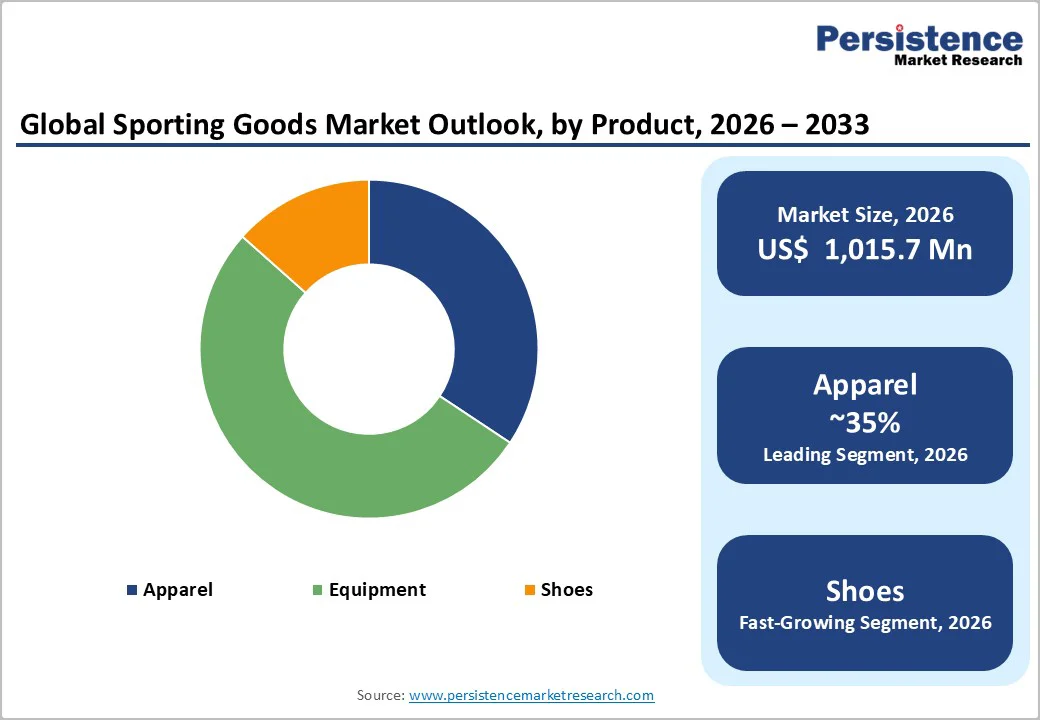
The global sporting goods market size is likely to be valued at US$1,015.7 million in 2026 and is projected to reach US$1,844.8 million by 2033, growing at a CAGR of 8.9% between 2026 and 2033.
Sports equipment, including golf clubs, soccer gear, and tennis rackets, accounted for 25% to 28% of the total market. E-commerce also accounted for a significant share of sporting goods sales in 2022 and is projected to grow at a CAGR of around 9% by 2025, driven by rising smartphone usage and digital platforms.
Key Industry?Highlights:
- Participation Trends Leadership: Increased engagement in sports and outdoor activities dominates demand, driven by heightened health consciousness and post-pandemic lifestyle shifts. Smart, connected sports equipment featuring IoT sensors, fitness tracking, and performance analytics is emerging as the fastest-growing trend, reflecting rapid consumer adoption of technology-enhanced sporting goods.
- Product Category Dynamics: Apparel remains the leading product category with 35% market share, supported by strong consumer interest in athleisure and performance wear. It is projected to grow at a robust 7.5% CAGR through 2033, while eco-friendly and recyclable sporting goods represent the fastest-expanding subcategory as sustainability becomes a key purchasing criterion.
- Channel Expansion Patterns: Online channels maintain strong momentum, significantly enhancing global product accessibility and penetrating emerging markets. E-commerce is also the fastest-growing channel, driven by wider assortment availability, aggressive digital marketing, and expanding D2C brand strategies.
- Activity-Based Demand Patterns: Outdoor sports equipment, covering hiking, cycling, and water sports, leads demand growth due to shifting recreational preferences.
- Cross-integration between traditional sports and esports is the fastest-growing opportunity area, enabling hybrid product innovation and attracting younger consumer segments.
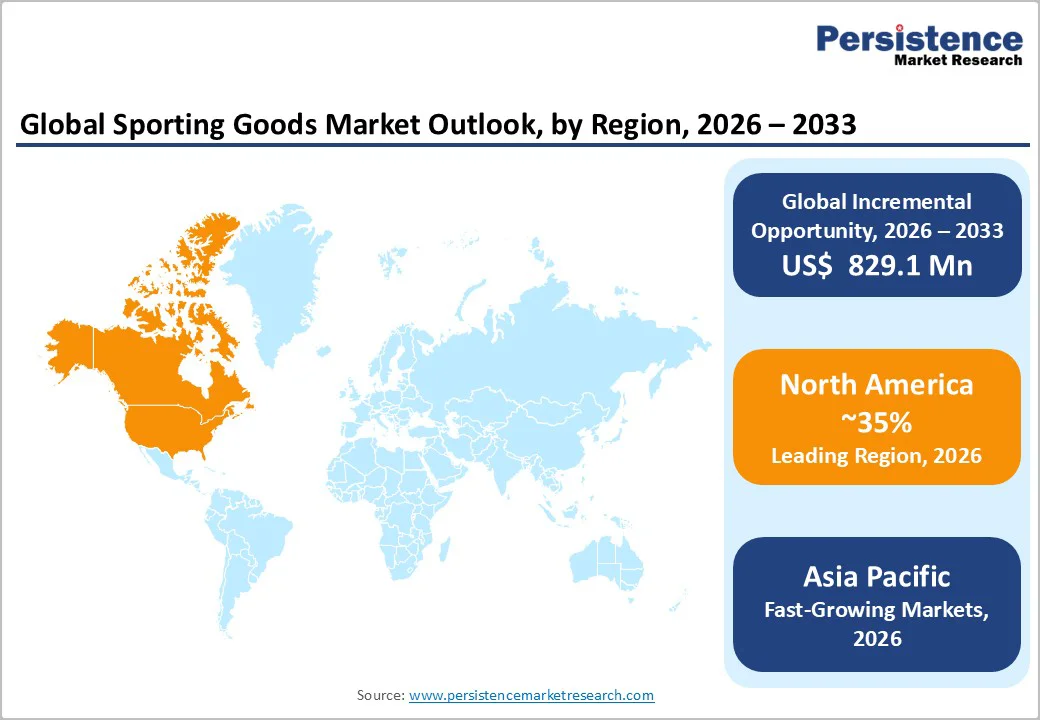
- Regional Growth Leadership: North America maintains market primacy with a 35% share in 2026, supported by high consumer spending and a mature sporting culture.
- Asia Pacific is the fastest-growing region, driven by rapid urbanization, rising health awareness, expanding middle-class participation, and strong online retail penetration.
| Key Insights | Details |
|---|---|
| Sporting Goods Market Size (2026E) | US$ 1,015.7 Mn |
| Market Value Forecast (2033F) | US$ 1,844.8 Mn |
| Projected Growth (CAGR 2026 to 2033) | 8.9% |
| Historical Market Growth (CAGR 2020 to 2024) | 7.6% |
Market Dynamics
Drivers - Rising Global Participation in Sports and Outdoor Recreational Activities
The popularity of sports, both amateur and professional, has grown in recent years. As participation in sports activities rises, it has triggered the urgency for sporting items such as equipment, footwear, and apparel. Outdoor recreational pursuits such as hiking, camping, cycling, and water sports have seen a rise in popularity during the pandemic, as users seek better ways to exercise and enjoy leisure activities.
In 2023, companies such as Oru Kayak, which specializes in foldable kayaks, and Red Paddle Co., known for their inflatable paddleboards, introduced more user-friendly and portable options to cater to new outdoor adventurers.
Technological Advancements in Sporting Goods
Technological innovations are another major growth driver for the sporting goods market. Advances in materials, design, and functionality have led to the development of performance-enhancing sports equipment and gear. For example, lightweight, durable materials like carbon fiber and advanced polymers have revolutionized products such as tennis rackets, bicycles, and running shoes, offering enhanced performance and comfort.
Wearable technology, such as fitness trackers and smart clothing, has gained widespread adoption, enabling users to monitor and optimize their physical activity. These advancements improve athletic performance and attract a broad audience, including tech-savvy consumers interested in integrating fitness into their daily routines.
The continuous evolution of smart, connected sporting goods is likely to drive further growth in the market, as more people seek data-driven ways to improve their physical performance. In 2024, companies such as Wilson developed smart basketballs and tennis rackets equipped with embedded sensors to track performance metrics, including shot accuracy, spin rate, and speed.
Restraints - Wide Availability of Unsafe Counterfeit Products Weaken Brand Loyalty
Consumers’ preferences change quickly, especially with the rise of social media and influencer marketing. Companies struggle to keep up with shifting trends and preferences, affecting their ability to produce and promote consumer-friendly products. To avoid this risk, businesses should invest in market research to keep track of current trends and collaborate closely with influencers and social media platforms.
The sporting goods industry is also vulnerable to creating and selling counterfeit items, which can weaken customer trust in authentic brands and impact product sales. Counterfeit items can also represent a safety concern to consumers who are unaware they are acquiring a counterfeit product, as these products may not meet safety regulations or go through necessary quality control inspections, thereby putting consumers in danger.
Opportunities - Expansion of Digital and Connected Sports Equipment
Integrating digital technology and Internet of Things (IoT) into sporting goods presents a transformative opportunity. Connected sports equipment, such as smart basketballs, tennis rackets, and even smart clothing, allows athletes to track their performance data in real-time.
This fusion of physical sports equipment with digital tracking and analytics offers tremendous growth potential as more amateur and professional consumers demand data-driven insights to enhance their skills and fitness levels.
Products like Wilson’s Smart Basketball or Babolat Play Smart Tennis Rackets have sensors embedded that track metrics such as ball speed, spin rate, shot accuracy and more. Paired with apps, these products provide users with performance breakdowns and tailored recommendations.
Category-wise analysis
Product Insights
Based on product type, the market is further divided into apparel, equipment, and shoes. Among these, apparel is dominant and expected to expand at a CAGR of 7.5% by 2033. It encompasses apparel and accessories designed to enhance the comfort, performance, and style of athletes and fitness enthusiasts across various sports and physical activities.
Companies in this sector continually innovate by introducing novel technologies, materials, and designs to meet the distinct needs and preferences of individuals engaged in various sports and exercise routines. The advent of athleisure wear, which combines sports performance qualities with casual styling, has broadened the market and blurred the distinction between sports apparel and everyday fashion.
Sales Channel Insights
Based on sales channel, the market is classified into distributors, supermarkets, specialty stores, online stores, and independent stores. Sales of sporting goods through independent sports stores are projected to grow at a notable CAGR over the forecast period. Independent sports stores play an important role in enhancing the variety and accessibility of sports-related products.
Independent sports stores cater to niche markets by focusing on specific sports or recreational activities and offering specialized equipment for soccer, tennis, golf, cycling, hiking, and water sports. Specializing allows sports stores to provide a tailored and curated range of merchandise, catering directly to enthusiasts of specific sports.
This specialization makes independent sports stores a compelling sales channel choice for consumers. Soccer gear accounts for particularly high sales since it is the most popular sport globally.
Regional Market Insights
North America Sporting Goods Market Trends
North America is the dominant region due to a high level of sports participation across various disciplines, from professional leagues to recreational activities. The U.S. is home to several leading sporting goods manufacturers such as Nike, Under Armour, and New Balance, which drive both domestic sales and the international market.
The growing trend of fitness and wellness, coupled with the increasing popularity of athleisure wear, has boosted the demand for sports apparel and equipment. Additionally, a robust distribution network of online and physical retail outlets enhances consumer accessibility.
The region benefits from high consumer spending on premium sporting goods, especially in well-established sports leagues. Moreover, government initiatives promoting physical activity and healthy lifestyles have encouraged the adoption of sports products, making North America a key player in the sporting goods market.
Europe Sporting Goods Market Trends
Europe represents approximately 22% of the global sporting goods market with a projected expansion to USD 315 million by 2033 at approximately 8.1% CAGR. Germany dominates the European market (approximately 35% of the European market value), driven by its manufacturing heritage and premium consumer positioning.
The United Kingdom, France, and Spain follow with comparable market dynamics; the Nordic countries demonstrate premium market positioning with the highest per-capita sporting goods spending globally.
The European Union's regulatory framework emphasizes sustainability and circular economy principles; the EU Circular Economy Action Plan and upcoming Extended Producer Responsibility (EPR) directives create compliance requirements that drive innovation in sustainable materials and take-back programs.
GDPR compliance requirements for consumer data in e-commerce platforms create operational complexity but a competitive advantage for compliant vendors. European consumers demonstrate sustainability consciousness, with approximately 58% considering environmental factors in purchasing decisions, supporting premium positioning for sustainable brands.
Asia Pacific Sporting Goods Market Trends
Asia Pacific represents approximately 25% of the global sporting goods market, with a projected expansion to USD 410 million by 2033, reflecting a 16% CAGR that substantially exceeds the global average (9.1%).
The region demonstrates the highest absolute growth velocity, reflecting rapid income growth, emerging middle-class participation in sports, and manufacturing ecosystem dominance. China commands approximately 40% of the Asia-Pacific market value, India is the fastest-growing country market at 19% CAGR, while Japan maintains mature market dynamics comparable to developed Western markets.
China's market shows concentration in urban population centers, with growing secondary-city expansion. China's sporting goods exports rose 44% year-on-year in 2024, indicating manufacturing momentum. Yiwu, a manufacturing hub, accounts for approximately 65% of global sporting goods exports.
India represents the fastest-growing market, demonstrating mass-market affordability dynamics; rising middle-class sports participation (cricket dominance, emerging fitness culture), government infrastructure investment, and e-commerce accessibility drive a 19% CAGR.
Competitive Landscape
The competitive landscape of the sporting goods market is characterized by established global brands and innovative newcomers. Key players include Nike, Adidas, Under Armour, Puma, and Decathlon, dominating the market with extensive product portfolios, strong brand equity, and vast distribution networks. These companies leverage advanced technology, sustainability initiatives, and celebrity endorsements to maintain market share.
New entrants and niche brands such as Lululemon in activewear and Babolat in smart sports equipment focus on innovation and specialized products to capture targeted consumer segments. E-commerce growth has also intensified competition, with brands like Amazon and Alibaba expanding their offerings in sporting goods. The market is highly competitive, driven by innovation, technological integration, and evolving consumer preferences.
Key Industry Developments
- In October 2023, Nike announced a three-year agreement to collaborate with Liga BBVA MX Femenil, the Mexican women's football league, underscoring its commitment to the global expansion of women's football. Nike will be the league's exclusive sports partner.
- In December 2023, Under Armour, Inc. unveiled a fresh testing approach aimed at combating fiber shedding at its origin, thereby aiding its drive to attain its sustainability objective of having 75% of its product fabrics made from low-shed materials by 2031.
Companies Covered in Sporting Goods Market
- Adidas AG
- Nike, Inc.
- Under Armour, Inc.
- PUMA SE
- AMER Sports
- Admiral Sportswear Limited
- Diadora S.p.A.
- Ellesse
- ODLO International AG
- Hummel International Sport & Leisure A/S
- Fila Holdings Corp.
- Others Key Players
Frequently Asked Questions
The Sporting Goods market is estimated to be valued at US$ 1,015.7 Mn in 2026.
The key demand driver for the Sporting Goods market is the rising global focus on health, fitness, and active lifestyles.
In 2026, the North America region will dominate the market with an exceeding 35% revenue share in the global Sporting Goods market.
Among the Product Type, Apparel holds the highest preference, capturing beyond 32.3% of the market revenue share in 2026, surpassing other Product type.
The key players in Sporting Goods are Adidas AG, Nike, Inc., Under Armour, Inc. and PUMA SE.


