


- Oil & Gas
- U.S. Natural Gas Market
U.S. Natural Gas Market Size, Share, and Growth Forecast, 2025 – 2032
Natural Gas Market by Gas Type (Ethane, Propane, Methane, Butane & Others), Source (Conventional, Unconventional), Application (Residential, Commercial, Electric Power, Industrial, Others) Analysis for 2025 – 2032
U.S. Natural Gas Market Size and Trends Analysis
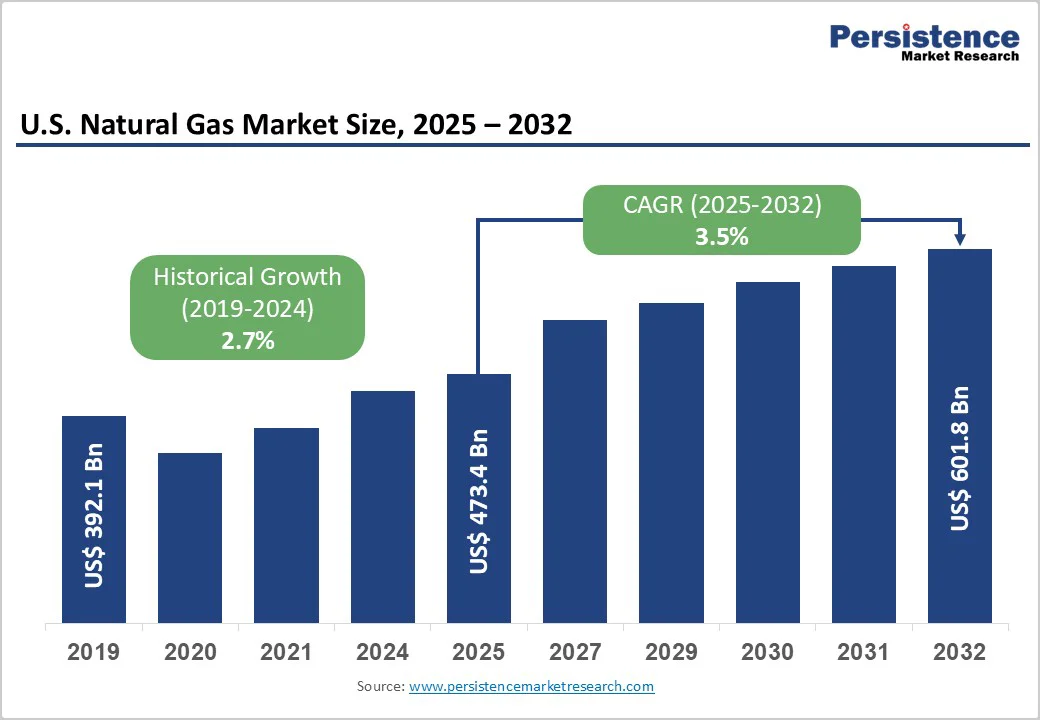
The U.S. natural gas market size is likely to value US$473.4 billion in 2025 and projected to reach US$601.8 billion, growing at a CAGR of 3.5% during the forecast period from 2025 to 2032. Expanding LNG export capacity along the Gulf Coast, rising electricity demand from AI-driven data centers, and coal displacement in power generation. The U.S. has become the world’s largest LNG exporter, with exports up 22% in the first eight months of 2025. Natural gas consumption hit a record 91.4?Bcf/d in 2025, fueled by extreme winter weather and strong residential and commercial demand.
Key Industry Highlights:
- Leading Gas Type: Methane dominates with over 85% share in 2025, driven by shale gas production, high energy efficiency, lower carbon emissions, and compatibility with existing infrastructure. Ethane is growing rapidly due to strong petrochemical demand for ethylene production in plastics and chemical manufacturing.
- Leading Source: Unconventional gas accounts for over 80% share in 2025, supported by cost-effective shale extraction and flexible supply for peak demand. Conventional gas is growing steadily due to stable infrastructure, predictable production, and investment in next-generation deepwater fields like Chevron and TotalEnergies’ Anchor development.
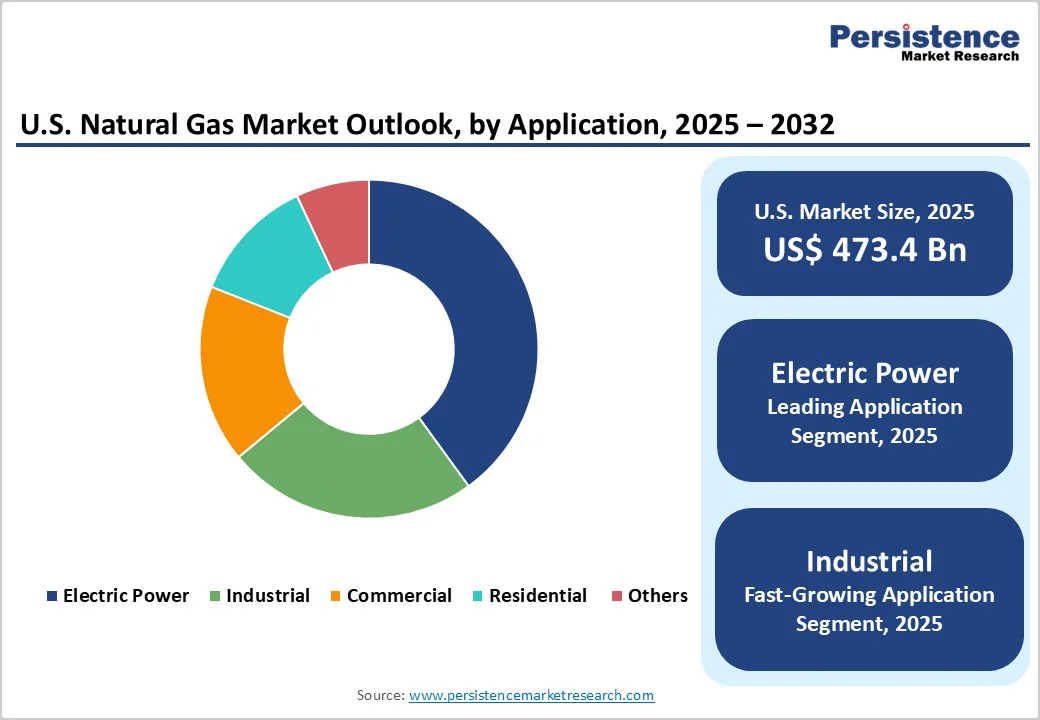
- Leading Application: Electric power sector holds nearly 40% share in 2025, supporting grid reliability and emissions reduction. Industrial applications are expected to grow at the highest rate, fueled by manufacturing, chemical processing, and heavy industry demand for cost-efficient, low-carbon energy.
- Growth Indicator: North America LNG export capacity is set to more than double from 14 Bcf/d in 2024 to 28.7 Bcf/d by 2029, with major U.S. projects driving feedgas demand growth of 5.2 Bcf/d through 2025, putting upward pressure on domestic prices. AI-driven data center growth is also boosting gas-fired power demand, with U.S. data centers projected to consume an additional 240 TWh by 2030.
- Key Opportunity: Renewable natural gas (RNG) and hydrogen blending create premium market segments. Over 400 RNG facilities are operational, with 363 more under construction or planned, representing potential 60% production capacity growth.
| Key Insights | Details |
|---|---|
| U.S. Natural Gas Market Size (2025E) | US$473.4 Bn |
| Market Value Forecast (2032F) | US$601.8 Bn |
| Projected Growth (CAGR 2025 to 2032) | 3.5% |
| Historical Market Growth (CAGR 2019 to 2024) | 2.7% |
Market Dynamics
Driver - Unprecedented LNG Export Capacity Expansion Creating Structural Demand Growth
North American LNG export capacity is projected to more than double from 14 billion cubic feet per day (Bcf/d) in 2024 to 28.7 Bcf/d by 2029, with the United States accounting for the majority of this expansion. Major facilities, including Plaquemines LNG Phase 2, Corpus Christi Stage 3, Golden Pass LNG, and Port Arthur LNG, are entering service throughout 2025-2027 Liquefied natural gas exporters in the U.S. have announced plans to more than double U.S. liquefaction capacity, adding an estimated 13.9 billion cubic feet per day by 2029. This infrastructure buildout is creating feedgas demand growth of 5.2 Bcf/d, nearly 39% increase from October 2024 to December 2025, placing significant upward pressure on domestic natural gas prices and pulling inventories below five-year average levels.
The U.S. Energy Information Administration projects that LNG exports will account for approximately 37% from 2024 to 2026, fundamentally reshaping domestic supply-demand balances and linking Henry Hub prices more directly to global LNG markets. Long-term supply agreements with international buyers, including 20-year contracts with European utilities and Asian power generators, provide revenue visibility and support sustained capital investment in upstream production and midstream infrastructure.
AI-Driven Data Center Growth Fueling Natural Gas Power Demand
The explosive growth of artificial intelligence (AI) applications is driving unprecedented electricity demand in the United States, particularly through the rapid expansion of data centers. U.S. data centers consumed approximately 180 TWh of electricity in 2024, with demand projected to rise by an additional 240 TWh by 2030. AI workloads, which currently account for 5–15% of data center power use, are expected to contribute 35–50% of consumption by 2030, according to the International Energy Agency. To meet this rising demand, gas-fired power generation for data centers is forecast to more than double, from 120 TWh in 2024 to 293 TWh by 2035, with natural gas consumption estimated between 3 and 12 billion cubic feet per day through 2030.
Major pipeline operators, including Williams Companies, Energy Transfer, and Kinder Morgan, are investing billions in new transmission infrastructure and generation capacity, with over 99 GW of gas-fired capacity planned across 38 states. This structural shift is particularly pronounced in Texas, Pennsylvania, and Louisiana, where proximity to prolific natural gas basins, established pipeline networks, and supportive regulatory frameworks facilitate rapid project development.
Federal Policy Support for Methane Emissions Reduction and Carbon Management Infrastructure
The Inflation Reduction Act's 45Q tax credits for carbon capture, utilization, and storage (CCUS) technologies are incentivizing major investments in natural gas decarbonization infrastructure, with the United States maintaining global leadership with over 20 million tonnes per annum of installed carbon capture capacity. The Environmental Protection Agency's strengthened methane emissions regulations, requiring advanced monitoring technologies and leak detection systems across the natural gas value chain, are improving the environmental profile of U.S. natural gas relative to international competitors. Companies investing in CCUS-equipped natural gas power plants access tax credits that significantly improve project economics, with the Department of Energy projecting that carbon capture deployment of 500 to 1,200 million tonnes per annum would generate $75 to $110 billion in gross value added through 2030.
Globally, total CO? capture capacity reached approximately 513 million tonnes per annum by late 2024, reflecting a 23% growth, highlighting the expanding role of carbon capture in energy transition. The European Union's Methane Regulation (EUMR) establishing measurement, reporting, and verification standards for imported energy products is creating competitive advantages for U.S. producers adopting voluntary certification programs like Oil and Gas Methane Partnership 2.0, enhancing the premium positioning of U.S. LNG in international markets.
Restraint
Natural Gas Price Volatility and Coal Competition Threatening Market Share
Natural gas prices exceeding $3.00 per million BTU can trigger switching behavior among power generators, with coal regaining market share when gas prices rise above economic switching thresholds. The Henry Hub spot price averaged $3.18/MMBtu in January 2024 and $4.13/MMBtu in January 2025, reflecting an increase of $0.95/MMBtu year-over-year. This rise was driven by colder-than-average temperatures and polar vortex events that created severe demand spikes. Such price volatility poses economic risks for industrial consumers and power generators operating under fixed-price electricity contracts.
Natural gas lost market share in the electric power sector during 2025, declining from 42% in 2024 to 40% in 2025 & 2026. Coal, solar, and wind sources expanded their contributions during this period, highlighting the potential for alternative energy adoption. Sustained high natural gas prices could further accelerate the shift toward renewables and battery storage, as these sources become more cost-competitive.
Opportunity
Renewable Natural Gas (RNG) and Hydrogen Blending Creating Premium Market Segments
The renewable natural gas (RNG) market in North America is experiencing rapid expansion, with production capacity projected to increase by over 135 million cubic feet per day in 2024. Supported by federal and state-level incentives such as the Renewable Fuel Standard, low-carbon fuel standard credits, and production tax credits, RNG projects are becoming increasingly economically viable. Utilities and corporate buyers are actively procuring RNG to meet decarbonization targets, while voluntary market contracting is growing as companies aim to reduce both Scope 1 and Scope 3 emissions.
RNG, produced from organic waste sources including landfills and agricultural residues, provides a sustainable alternative to conventional natural gas. It fuels vehicles, heat buildings, and powers industrial processes, promoting greenhouse gas reductions and circular economy principles. As of 2024, over 400 RNG facilities are operational, with an additional 130 under construction and 233 planned, representing a potential 60% increase in production capacity. The development of hydrogen blending infrastructure, supported by Section 45V Clean Hydrogen Production Tax Credits, is enabling natural gas networks to transition toward zero-carbon energy delivery while utilizing existing pipeline assets.
In-Basin Power Supply Deals Driving Natural Gas Producer Integration
Natural gas producers are capturing additional value chain margins by developing vertically integrated business models serving data center electricity demand directly through long-term power purchase agreements. EQT Corporation, the largest natural gas producer in the United States, is leveraging its integrated platform combining upstream production, midstream gathering and transmission, and downstream power generation to supply reliable, low-cost electricity to data centers in Appalachia and the Northeast.
Williams Companies announced $5 billion in "power innovation" investments, including two natural gas-fired power projects backed by 10-year fixed-price agreements with data center customers, demonstrating the attractive risk-adjusted returns available in this emerging business segment. This vertical integration strategy reduces basis risk, eliminates counterparty exposure, and allows producers to monetize natural gas molecules at power market prices rather than commodity natural gas prices, significantly improving unit economics.
Category-wise Analysis
By Gas Type, Methane Dominance Driven by Shale Gas Production and High Energy Efficiency
Methane is expected to account for more than 85% share in 2025, due to its high energy efficiency and cleaner combustion. The United States' shale gas revolution, led by horizontal drilling and hydraulic fracturing innovations, has unlocked vast methane-rich reserves in the Marcellus, Utica, Haynesville, and Permian formations, with U.S. dry natural gas production reaching 108.0 billion cubic feet per day (Bcf/d) in July 2025, marking the highest monthly production since 1973. The U.S. also exported 14.1 Bcf/d of liquefied natural gas (LNG) in July 2025, the highest monthly rate since 1997. Methane’s high energy density, lower carbon emissions, and compatibility with existing infrastructure ensure its continued dominance.
Ethane is expected to grow at a significant rate propelled by robust demand from the petrochemical industry where ethane serves as the preferred feedstock for ethylene production used in plastics, synthetic fibers, and chemical manufacturing. The U.S. ethane production grew in 2024, reaching 3.0 million barrels per day by May, with the majority exported to China where petrochemical capacity expansion is driving substantial ethylene derivative consumption. Ethane cracking processes produce fewer byproducts and offer higher conversion efficiency, making ethane-derived ethylene the economically preferred route for plastics manufacturers.
By Source, Unconventional Gas Dominating Due to Shale Extraction and Cost-Effective Supply
The unconventional segment is expected to account for over 80% share in 2025 as it directly meets the growing energy demand for cleaner and reliable fuels. The widespread adoption of shale gas extraction through hydraulic fracturing and horizontal drilling allows access to vast, previously untapped reserves, ensuring energy security. Unconventional sources also provide flexibility in meeting peak demand and reducing dependence on imports. Their cost-competitiveness and scalability align with U.S. infrastructure and economic requirements, making them the preferred choice.
Conventional is expected to grow at a significant rate due to its stable infrastructure and reliable supply, with aging fields still offering economically viable reserves supported by established pipelines and processing facilities. Major integrated energy companies are investing in conventional gas projects that offer lower decline rates and more predictable production profiles compared to shale wells, appealing to investors seeking stable cash flow generation. The Anchor field development in the deepwater Gulf of Mexico, operated by Chevron and TotalEnergies, exemplifies next-generation conventional gas projects utilizing subsea tieback infrastructure and advanced reservoir management to economically develop resources in water depths exceeding 5,000 feet.
By Application, Electric Power Sector Supporting Grid Reliability and Emissions Reduction
Electric power is expected to account for nearly 40% share in 2025, serving as the primary baseload and dispatchable resource supporting grid reliability as intermittent renewable capacity expands. The U.S. Energy Information Administration forecasts electric power sector natural gas consumption will average 36 billion cubic feet per day in 2025, though this represents a slight decline from 2024's record 36.9 Bcf/d as solar, wind, and battery storage capture marginal generation growth. It also helps meet stricter emissions regulations, as natural gas produces significantly lower CO? and particulate emissions compared to coal and oil. Combined-cycle natural gas plants, with up to 60% efficiency, fast startup times, and lower capital costs than coal or nuclear, remain economically competitive and ideal for supporting variable renewable energy.
Industrials sectors are expected to grow at the highest rate due to increasing demand for cost-efficient and reliable energy in manufacturing, chemical processing, and heavy industries. Natural gas offers a cleaner and more stable fuel alternative compared to coal or oil, helping industries meet stricter emissions and sustainability standards. Rising production activities in petrochemicals, fertilizers, and metal processing are driving steady gas consumption. The shift toward electrification and combined heat and power (CHP) systems in factories is increasing natural gas utilization. Industrial operators also benefit from long-term supply contracts and lower price volatility, supporting expansion and modernization of facilities.
Competitive Landscape
The U.S. natural gas market is moderately consolidated, with major players like ExxonMobil, Chevron, ConocoPhillips, and EQT pursuing vertical integration and infrastructure-led growth to capture value chain margins and reduce price exposure. Companies emphasize scale-driven cost efficiency through acreage consolidation and AI-driven drilling innovations that optimize productivity. Growing focus on low-carbon differentiation via methane detection, CCUS, and certified gas programs enhances competitiveness, while the synergy between gas infrastructure and data center power demands new integrated energy business models.
Strategic Developments:
- In October 2025, The Williams Companies, Inc. plans to invest $3.1 billion in two natural gas–based power projects to meet the surging electricity demand from U.S. data centers, bringing its total “power innovation” investments to $5 billion. The move aligns WMB with the growing AI-driven energy demand while leveraging its existing natural gas infrastructure for long-term, fee-based growth.
- In April 2025, ExxonMobil partnered with Calpine Corporation to capture, transport, and permanently store up to 2 million metric tons of CO? annually from Calpine’s Baytown Energy Center, a natural gas-fired cogeneration facility near Houston. The project, part of Calpine’s Baytown CCS initiative, will support the supply of low-carbon electricity and steam while expanding ExxonMobil’s total CO? under contract to about 16 MTA.
- In January 2025, Engine No. 1 and Chevron U.S.A., in partnership with GE Vernova, announced plans to develop scalable power solutions for U.S. data centers using American natural gas. The initiative aims to build the first multi-gigawatt co-located power plant and data center, supporting AI leadership in the U.S. during President Trump’s second term.
Companies Covered in U.S. Natural Gas Market
- ExxonMobil Corporation
- Chevron Corporation
- ConocoPhillips
- EOG Resources, Inc.
- Occidental Petroleum Corporation
- Hess Corporation
- Cheniere Energy
- Devon Energy Corporation
- Pioneer Natural Resources
- Southwestern Energy
- TotalEnergies SE
- Others
Frequently Asked Questions
The U.S. natural gas market is projected to be valued at US$473.4 Bn in 2025.
Rising electricity demand from data centers alongside regulatory incentives is a key growth indicator.
The U.S. natural gas market is poised to witness a CAGR of 3.5% from 2025 to 2032.
Growing adoption of renewable natural gas, hydrogen blending, carbon capture technologies, and long-term power supply contracts creates strong growth opportunities.
ExxonMobil Corporation, Chevron Corporation, ConocoPhillips, EOG Resources, Inc., Occidental Petroleum Corporation, Hess Corporation, and Cheniere Energy are among the leading key players.


