


- Electric Mobility
- U.S. Charging as a Service Market
U.S. Charging as a Service Market Size, Share, and Growth Forecast 2026 – 2033
U.S. Charging as a Service Market by Service Model (Hosted Charging as a Service, Financed Charging as a Service, Subscription-Based Charging, Pay-Per-Use Charging), Charger Type (AC Chargers, DC Chargers), End-user (Residential, Multi-Family Residential, Workplace and Commercial Offices, Retail and Commercial Sites, Fleet and Logistics Charging, Public and Government Infrastructure), and Zone Analysis, 2026–2033
U.S. Charging as a Service Market Size and Trend Analysis
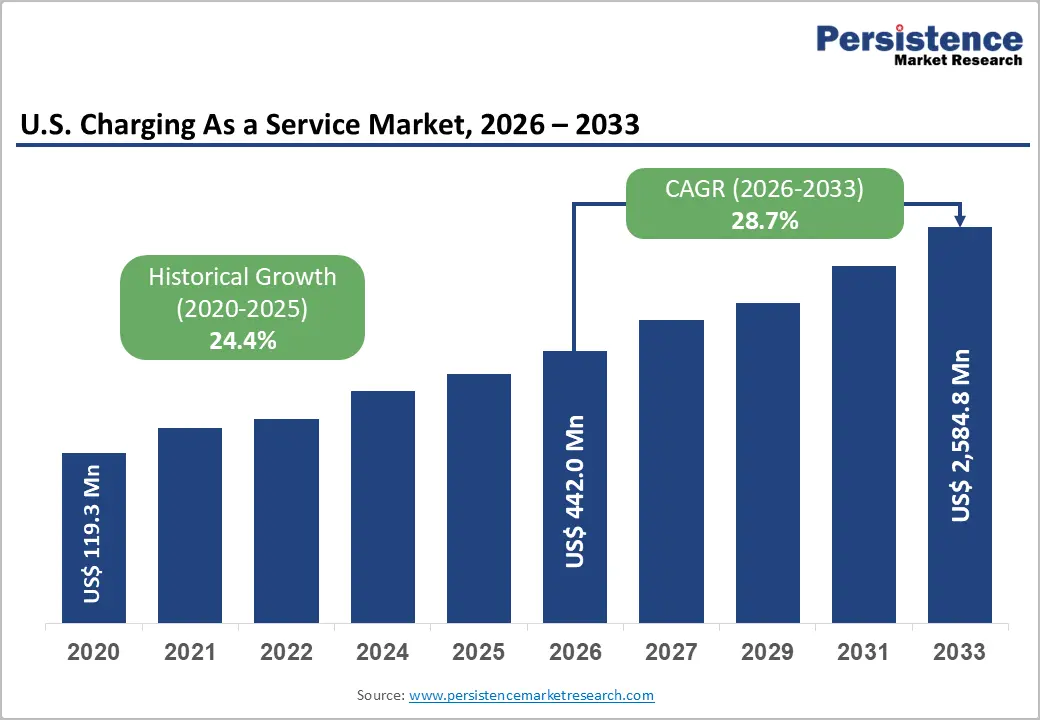
The U.S. Charging as a Service market size is expected to be valued at US$ 442.0 million in 2026 and projected to reach US$ 2,585.1 million by 2033, growing at a CAGR of 28.7% between 2026 and 2033. The market's exceptional growth trajectory is anchored in alignment of federal policy mandates, accelerating electric vehicle fleet penetration, and the fundamental economics of infrastructure-as-a-service models that redistribute upfront capital expenditure, removing the single largest barrier to widespread EV charging deployment for businesses, municipalities, and multi-family property owners.
The U.S. Environmental Protection Agency (EPA) projects that achieving its proposed multi-pollutant vehicle standards would require approximately 55 million battery electric vehicles (BEVs) on U.S. roads by 2032, implying a required annual growth rate of around 27% in public and workplace charging deployment from 2024 onward a scale of infrastructure build-out that is only commercially feasible at pace through Charging as a Service (CaaS) delivery models that eliminate individual owner capital risk.
Key Industry Highlights:
- Leading Zone: The West region leads the U.S. CaaS market with approximately US$ 140.8 million in revenue in 2025, underpinned by California's ACC II zero-emission mandates, the nation's highest EV population density, and state-backed infrastructure programs including Washington's ZEVIP.
- Fast-Growing Zone: The Southeast region is emerging as the fastest-growing U.S. CaaS sub-market, driven by major EV manufacturing investments from Hyundai and Volkswagen, strong fleet electrification momentum, and expansive highway corridor fast-charging deployment economics across Georgia, Tennessee, and the Carolinas.
- Leading Servic: Hosted charging as a service dominates the service model category with approximately 44% share in 2026, driven by its turnkey property owner value proposition that eliminates all capital expenditure, installation management, and ongoing maintenance obligations through a third-party operator model.
- Fast-growing Service: Subscription-based charging is the fastest-growing service model at a projected CAGR of 29% by 2033, fuelled by workplace and multi-family residential property operators seeking predictable per-vehicle cost structures, regulatory compliance assurance, and tenant amenity differentiation in a competitive real estate environment.
- Opportunity: The most significant market opportunity lies in next-generation ultra-fast DC charging deployments with Elektros Inc.'s patented technology targeting 6–7 minute charging times and in fleet logistics CaaS contracts tied to EPA and CARB zero-emission fleet mandates requiring rapid electrification of commercial vehicle portfolios through 2032.
DRO Analysis
Drivers - Federal Policy and Tax Incentives Structurally De-Risking CaaS Infrastructure Investment
The Inflation Reduction Act (IRA), signed into law in August 2022, has fundamentally altered the investment calculus for EV charging infrastructure deployment across the United States. In September 2024, the U.S. Department of the Treasury and the Internal Revenue Service (IRS) released expanded guidance for the Alternative Fuel Vehicle Refuelling Property Credit under the IRA, enabling eligible businesses, government entities, and qualifying communities to claim tax credits covering up to 30% of EV charging installation costs, a provision that materially improves project-level economics for CaaS providers and their end-user clients.
The U.S. General Services Administration (GSA) announced a US$ 25 million investment under the IRA to deploy electric vehicle supply equipment (EVSE) across federal buildings in 32 projects across 21 states, installing 782 EV charging ports and establishing the federal government as a landmark anchor customer for CaaS deployment at scale.
Accelerating EV Fleet Adoption: Creating Captive, High-Volume Demand for Managed Charging Services
Commercial and government fleet operators, including logistics companies, rideshare platforms, municipal transit authorities, and rental car companies, represent the most commercially compelling customer segment for CaaS providers because their high vehicle utilisation rates, predictable charging demand profiles, and need for centralised energy management make outsourced charging infrastructure categorically more attractive than capital ownership.
U.S. electric vehicle sales expanded from approximately 330,000 units in 2020 to 1.4 million units in 2023, with EVs capturing 9.1% of new light-duty vehicle sales by 2023, according to EV-Volumes. In February 2023, bp and Hertz announced a US$ 1 billion investment initiative by 2030 to expand fast-charging infrastructure across major U.S. cities, specifically targeting rental fleets, rideshare operators, and airport mobility hubs, a landmark commercial signal validating the fleet CaaS revenue model at scale.
Restraints - Federal EV Tax Credit Expiration Introducing Near-Term BEV Adoption Uncertainty
The expiration of federal EV tax credits, including the New Clean Vehicle Credit and Qualified Commercial Clean Vehicle Credit, in September 2025 introduced significant near-term demand volatility in the U.S. BEV market. Data from Omdia and the U.S. Energy Information Administration (EIA) confirmed that battery electric vehicle market share peaked at 12% in September 2025 before falling below 6% in subsequent months, marking the first annual decline in BEV sales since the market's establishment.
While total EV sales (including hybrids) reached 22% of total light-duty vehicle sales in 2026, BEV-specific deceleration directly constrains near-term demand for grid-connected public and fast-charging infrastructure, creating a challenging revenue environment for CaaS providers heavily concentrated in DC fast-charging deployment.
High Capital Intensity and Grid Upgrade Requirements Constraining Deployment Speed
Despite the CaaS model's structural advantage of eliminating upfront capital cost for end users, the charging infrastructure provider itself faces substantial balance sheet requirements to fund site acquisition, equipment procurement, grid connection upgrades, and ongoing maintenance, particularly for DC fast-charging deployments requiring 150kW to 350kW per stall.
Utility interconnection timelines in key states remain a persistent operational bottleneck: HERE Technologies and SBD Automotive data from September 2025 confirmed that while 37,000 additional charge points were installed in 2025, consumer concerns regarding charging accessibility and speed availability remained acute, reflecting infrastructure deployment that, despite its scale, has not yet achieved the density or reliability required to eliminate range anxiety as a structural CaaS demand constraint.
Opportunities - Subscription-Based CaaS Models Unlocking Recurring Revenue for Fleet and Workplace Segments
Subscription-based charging, the fastest-growing service model in the U.S. CaaS market with a projected CAGR of 29% by 2033, is creating differentiated revenue stream for operators by converting one-time infrastructure transactions into predictable, recurring monthly or annual contracts. For workplace and multi-family residential property owners, subscription CaaS eliminates equipment ownership risk, ensures software and regulatory compliance through managed services, and provides a clear cost-per-vehicle or cost-per-session billing structure that is easily passed through to tenants and employees.
The U.S. Department of Energy (DOE)'s Alternative Fuels Data Center (AFDC) reports that workplace charging availability is consistently ranked among the top three factors influencing EV purchase decisions by U.S. consumers, making subscription-based workplace CaaS a compelling tenant attraction and retention amenity for commercial real estate operators at a moment when office leasing differentiation is commercially critical.
Next-Generation Ultra-Fast Charging Technology Expanding CaaS Addressable Market
Technological advances in ultra-fast charging hardware are materially expanding the CaaS addressable market by reducing per-session dwell time the key remaining experiential barrier to broad EV adoption toward parity with conventional refueling. In April 2025, EVCS deployed 41 DC fast chargers, including ultra-fast 350kW charging systems, across Washington State through partnerships with Forth and Energy Northwest under the Washington State ZEVIP program, demonstrating the commercial viability of high-power CaaS deployments through public-private partnership structures.
In May 2026, Elektros Inc. highlighted its patented next-generation EV charging technology designed to reduce electric vehicle charging times to approximately six to seven minutes a breakthrough that, if commercialized at scale, would transform public CaaS sites into high-throughput, convenience-oriented services competitive with traditional fuel retail, dramatically improving unit economics and enabling CaaS operators to underwrite premium-location site investments previously uneconomical at conventional charging speeds.
Category-wise Analysis
Service Model Insights
Hosted Charging as a Service is the dominant service model, capturing approximately 44% of the U.S. CaaS market in 2025. In the hosted model, a third-party CaaS provider owns, operates, and maintains the charging equipment at a host site such as a retail parking lot, multi-family residential property, or commercial office campus eliminating all capital expenditure, installation coordination, and ongoing maintenance responsibility for the property owner. This turnkey value proposition is particularly compelling in the U.S. market, where the majority of property owners lack the internal technical expertise and utility relationship infrastructure required to independently manage EV charging operations.
The U.S. National Electrical Manufacturers Association (NEMA) has consistently identified upfront installation cost and operational complexity as the two primary barriers to commercial EV charging deployment, both of which the hosted CaaS model directly eliminates. Major hosted CaaS providers, including ChargePoint, Blink Charging, and EVgo, have built substantial contracted-site networks that generate recurring service and network management fees from host partners.
Charger Type Analysis
DC Chargers (Direct Current fast chargers) are the leading charger type segment in the U.S. CaaS market by revenue, accounting for approximately 58% of total CaaS revenue in 2026, reflecting their higher per-unit contract value, premium service fee structure, and strategic importance to fleet operators, public infrastructure providers, and highway corridor deployments where session time efficiency is commercially critical. A single DC fast charger installation ranging from 50kW to 350kW capacity commands a substantially higher hosted or financed CaaS contract value than an equivalent AC Level 2 installation, skewing revenue share decisively toward DC despite AC chargers representing a larger share of total installed units.
The EPA infrastructure demand analysis confirms that achieving projected 2032 BEV adoption levels would require approximately 136,000 public DC fast chargers, implying enormous forward revenue opportunity for DC-focused CaaS operators. Market commitments from charging providers, automakers, and retailers covering an estimated 182% of required public DC fast charger deployments by 2030 signal strong competitive intensity but also validate the segment's structural demand thesis.
End-user Insights
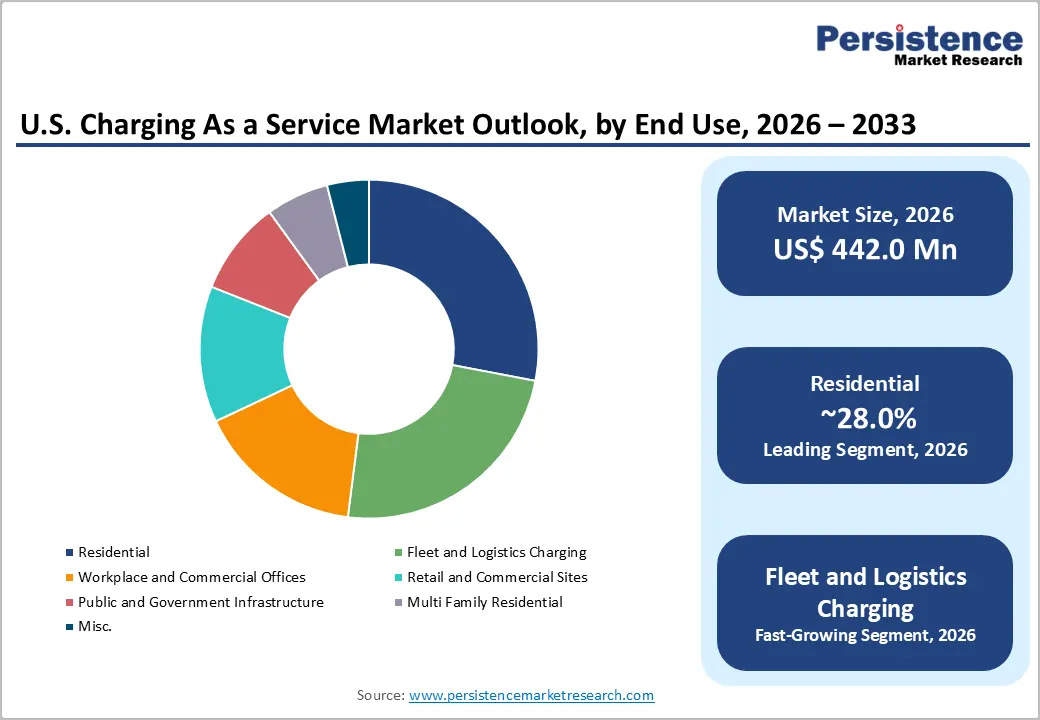
Fleet and logistics charging is the leading end-use segment in the U.S. CaaS market, representing approximately 32% of total market revenue in 2025. Fleet operators encompassing last-mile delivery companies, long-haul freight carriers, municipal bus and transit authorities, and corporate vehicle fleets generate the most commercially attractive CaaS customer profile due to their concentrated charging demand at predictable depot and distribution centre locations, multi-year contract willingness, and energy volume that supports favourable utility rate negotiation on behalf of the CaaS provider.
The transition of major U.S. fleet operators to zero-emission vehicles is being directly accelerated by both the EPA's multi-pollutant emissions standards targeting commercial vehicles and California's Advanced Clean Fleets (ACF) regulation, which requires zero-emission drayage trucks at ports and rail yards by 2024, with broader fleet mandates phasing in through 2042. EO Charging, which expanded into the U.S. market in November 2021, explicitly targets this segment by providing integrated fleet charging infrastructure and management services for car, van, truck, and bus operators across North America.
Regional Insights
U.S. Charging as a Service Market Trends and Insights
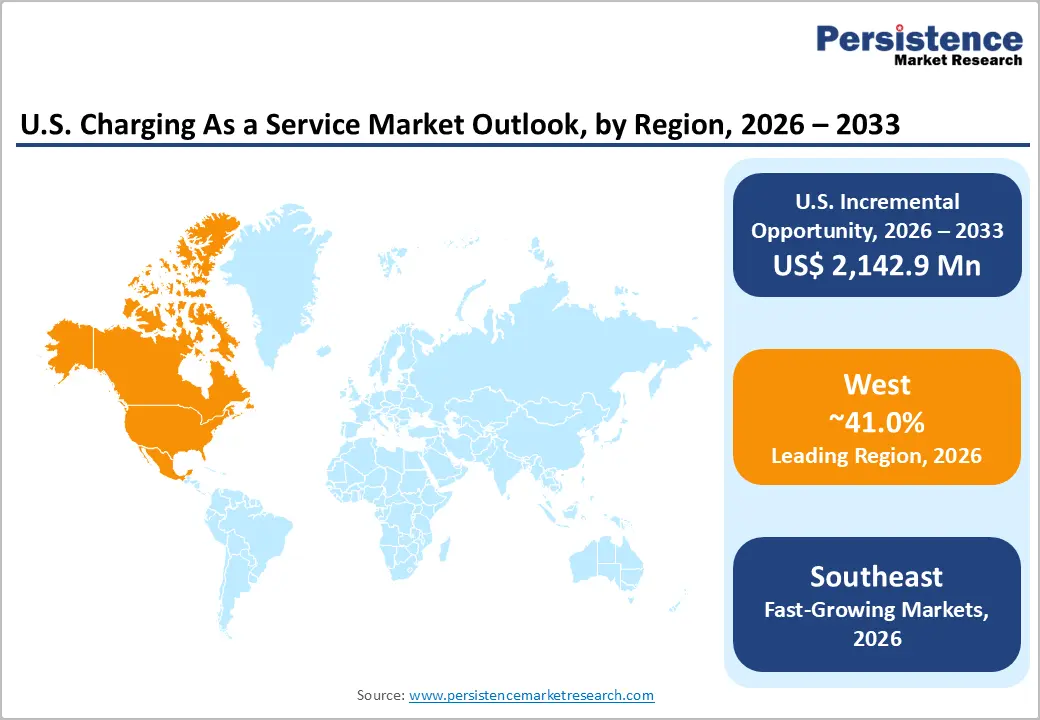
The United States is the sole geographic scope of this report, with market activity concentrated across five distinct sub-national regions that exhibit materially different EV adoption rates, regulatory environments, utility infrastructure maturity, and CaaS service model preferences. The West region, led by California, commands the largest share of U.S. CaaS revenue, driven by the nation's most advanced EV mandates and the highest absolute EV population, while the Southeast and Northeast represent distinct growth vectors defined by fleet electrification and dense urban deployment, respectively.
West Charging as a Service Market Size
The West region accounts for the largest share of the U.S. Charging as a Service market, with an estimated market value of approximately US$ 140.8 million in 2025. California's Advanced Clean Cars II (ACC II) regulation mandating 100% zero-emission new passenger vehicle sales by 2035 and the California Public Utilities Commission (CPUC)'s multi-billion-dollar utility investment mandates for EV infrastructure create an unmatched regulatory and investment environment for CaaS operators. California alone hosts over 40% of all U.S. registered EVs, providing the densest existing customer base for public and fleet CaaS deployments in the nation. Washington State's active ZEVIP program, under which EVCS deployed 41 DC fast chargers in April 2025, further reinforces the West region's leadership position as a state-supported CaaS expansion zone.
Southeast Charging as a Service Market Size
The Southeast region represents a rapidly scaling CaaS market, with an estimated market value of approximately US$ 75.5 million in 2026 and one of the highest regional growth rates nationally, driven by strong fleet electrification momentum, major automotive manufacturing investment in EV production, and the region's large landmass creating compelling highway corridor fast-charging deployment economics.
Georgia, Tennessee, and South Carolina have attracted significant EV manufacturing investment, including Hyundai's Metaplant America in Georgia and Volkswagen's Scout Motors facility in South Carolina generating OEM-linked workforce and fleet charging demand that CaaS providers are actively structuring long-term contracts to capture.
Northeast Charging as a Service Market Size
The Northeast region’s Charging as a Service market is likely to be valued at approximately US$ 45.9 million in 2026, anchored by high urban density, strong public transit electrification programs, and the multi-state Transportation and Climate Initiative (TCI) policy framework that provides regulatory alignment across key markets, including New York, Massachusetts, and Connecticut. New York City's Local Law 97, which imposes carbon penalties on large commercial buildings from 2024, is creating direct financial incentives for multi-family residential and commercial office property owners to adopt hosted CaaS models as a tenant amenity and emissions-offset mechanism, driving structured growth in the subscription-based CaaS sub-segment across the region's dense urban building stock.
Competitive Landscape
The U.S. charging as a service market is moderately fragmented, with a small number of well-capitalised network operators, ChargePoint Holdings, EVgo Inc., Blink Charging, Electrify America, and Tesla's Supercharger Network, competing for large-scale fleet and public infrastructure contracts, while a growing cohort of specialist fleet CaaS providers, including EO Charging, Voltera, and EVCS, capture segment-specific opportunities.
Key competitive differentiators include network reliability (uptime guarantees), software platform sophistication for energy management and billing, utility partnership depth for rate optimisation, and the ability to structure bankable long-term service contracts that satisfy host site and investor return requirements. Emerging business model innovations include revenue-sharing arrangements with host properties and bundled renewable energy procurement within CaaS contracts.
Key Developments:
- September 2025, HERE Technologies and SBD Automotive reported continued expansion of EV charging infrastructure across the U.S., with 37,000 additional charge points installed in 2025, highlighting increasing investment in charging-as-a-service solutions despite ongoing consumer concerns regarding charging accessibility and charging speed availability.
- April 2025, EVCS expanded its U.S. charging-as-a-service infrastructure across Washington State by deploying 41 DC fast chargers, including ultra-fast 350kW charging systems, through partnerships with Forth and Energy Northwest under the Washington State ZEVIP program, strengthening public EV charging accessibility across new urban and commuter corridor locations.
- February 2023, bp and Hertz announced plans to expand fast-charging infrastructure across major U.S. cities through a USD 1 billion investment initiative by 2030, supporting the growth of EV charging-as-a-service solutions for rental fleets, rideshare operators, airport mobility hubs, and public EV users.
Companies Covered in U.S. Charging as a Service Market
- ChargerPoint Inc.
- Tesla
- ENGIE
- Blink Charging Co
- Lightning eMotors Inc
- EV Safe Charge
- CATEC
- WattLogic
- bp pulse
Frequently Asked Questions
The U.S. Charging as a Service market is estimated at US$ 442.0 million in 2026, driven by federal policy support, fleet electrification mandates, and the structural capital-light appeal of the CaaS service delivery model for commercial and government end users.
The primary drivers are the Inflation Reduction Act (IRA)'s tax credits covering up to 30% of EV charging installation costs, as confirmed in the IRS's September 2024 expanded guidance and accelerating fleet electrification mandates from the EPA and CARB requiring an estimated 55 million BEVs on U.S. roads by 2032. These forces create captive, high-volume CaaS demand from fleet operators, commercial property owners, and public infrastructure agencies that cannot absorb the capital intensity of independent charging deployment.
The West region leads the U.S. CaaS market with approximately US$ 140.8 million in revenue in 2025, driven by California's Advanced Clean Cars II (ACC II) regulation mandating 100% zero-emission new vehicle sales by 2035, the nation's highest absolute EV population, and state utility commissions' multi-billion-dollar EV infrastructure investment mandates. Washington State's ZEVIP program, under which EVCS deployed 41 DC fast chargers, including 350kW ultra-fast systems in April 2025, further reinforces the West's leadership as the most policy-active CaaS expansion zone nationally.
The highest-value opportunity lies in subscription-based CaaS for fleet and workplace segments, the fastest-growing service model at a CAGR of 29% from 2026 to 2033 combined with next-generation ultra-fast DC charging deployments that are transforming the economics of public CaaS sites.
The leading companies in the U.S. CaaS market include ChargePoint Holdings, EVgo Inc., Blink Charging, Electrify America (a Volkswagen Group company), Tesla's Supercharger Network, EO Charging, EVCS, bp pulse, Volta Charging (Shell), ABB E-mobility, and Siemens eMobility.


