Robotic Refueling System Market Size, Share, Trends, Growth, and Forecasts (2025 - 2032)

Robotic Refueling System Market by Fuel Pumped (Gasoline, Natural Gas, Petrochemicals), by Payload-carrying Capacity (Up to 50 kg, 50.01–100 kg, 100.01–150 kg), by Frequency (Less than 1 GHz, 1 GHz to 6 GHz, More than 6 GHz), by Vertical (Mining, Automobile, Oil & Gas, Aerospace, Military & Defense, Warehouse & Logistics, Marine & Shipping, Construction), and Regional Analysis

ID: PMRREP33485
Calendar

August 2025

300 Pages

Author : Rajat Zope

Robotic Refueling System Market Size and Forecast Analysis

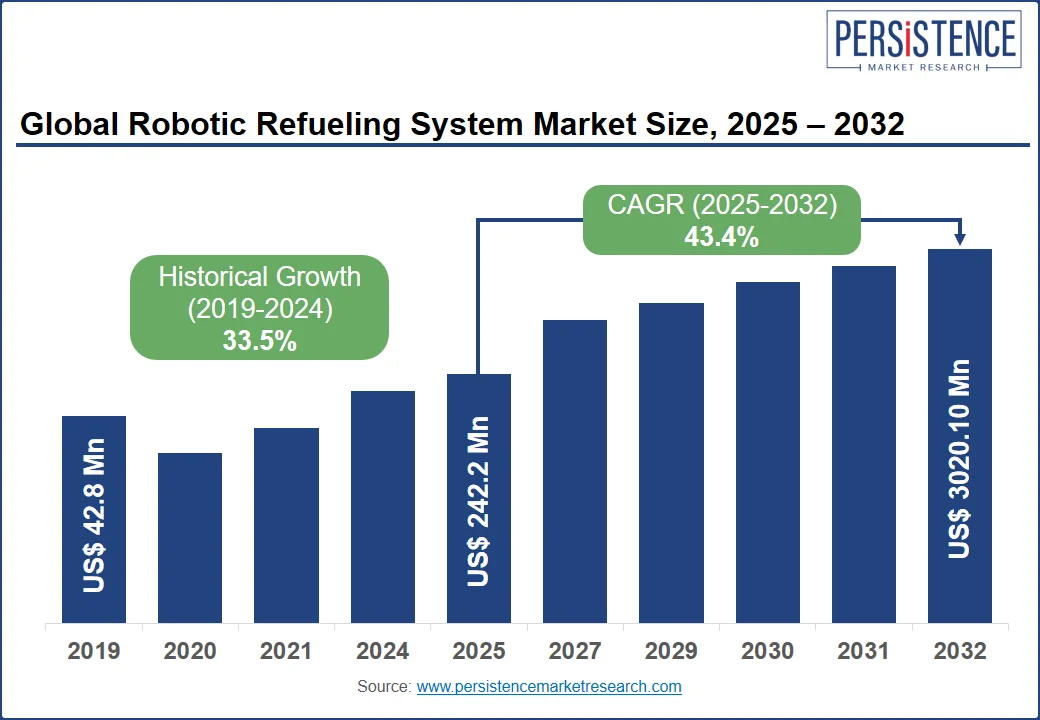
According to Persistence Market Research, robotic refueling systems sales are expected to reach US$ 242.2 million by 2025. A recent report estimates that robotic refueling systems will reach US$ 3,020.10 million by 2032, with a 43.4% CAGR.

Robotic refueling systems are continuously evolving as robotics and automation advance. Sensor technologies, navigation autonomy, fueling mechanisms, and integration with other robotic systems have all improved over the past few years. The cost-effectiveness, versatility, and adaptability of robotic refueling systems may increase as the technology matures.

Increasing interest in scientific research-based projects and studies has led to a constant demand for these robots in the marketplace. The increasing use of technologies and the availability of advanced sensors has contributed to the growth of the market.

For instance, limited initial capabilities were demonstrated for the U.S. Army Aviation and Missile Research, Development, and Engineering Center to test that theory. The demonstration introduced the Autonomous & Robotic Remote Refueling Point, or AR3P, developed by the Center's Aviation Development Directorate and Operational Energy Lab. An autonomous robot refueling operation was demonstrated to stakeholders as a proof-of-concept and a potential material set of solutions.

Robotic Refueling System Market Size 2025 - 2032

Report Attributes Details

Robotic Refueling System Market Size (2025)

US$ 242.2 Million

Robotic Refueling System Market Value (2032)

US$ 3,020.10 Million

Robotic Refueling System Market CAGR (2025 to 2032)

43.4%

2019 to 2024 Robotic Refueling System Market Outlook Compare to 2025-2032 Forecast

Persistence Market Research (PMR) estimates robotic refueling system sales will grew by 49.6% between 2019 and 2024. According to analysts, global sales will grow by 40.8% between 2025 and 2032.

There's growing interest in robotic refueling systems for commercial uses such as transportation, mining, agriculture, and construction has seen a rise in recent years. Commercial sectors have begun to use them even though they were originally designed for industrial and military purposes.

Robotic refueling has a global potential, not just limited to specific regions. In the future, the market is expected to experience significant growth worldwide as automation and efficient fueling solutions become more prevalent across industries.

As industries in these regions modernize and automate rapidly, emerging economies present significant opportunities in the future. Diverse industries will benefit from the market's continued growth as it offers numerous benefits, including cost savings, safety, and efficiency. A robotic refueling system can improve efficiency and reduce operational costs in industries where large fleets of vehicles and equipment require regular refueling.

Country-wise Insights

How much Revenue can the Robotic Refueling System Market Generate in North American Region?

Market Share for Robotic Refueling Systems in North America is Expected to Increase

United States (2025-2032) Projected Market Value

Robotic Refueling System in United States Market Size (2025)

US$ 13.5 million

Robotic Refueling System in United States Market Size (2032)

US$ 368.3 million

Robotic Refueling System in United States Market (CAGR)

39.2%

The North American robotic refueling system market is expected to dominate the global market. In 2032, PMR projects the North American robotic refueling system market to reach US$ 634.95 million.

The growth of the IT sector and the adoption of technologies are expected to drive the demand for robotic refueling systems. Over the next few years, the demand for advanced technologies and autonomous vehicles is expected to grow.

The rising demand for space technologies and products will lead to an increase in the number of robots on the market. Robotic refueling systems are growing in popularity in developed countries such as the United States and Canada due to improved infrastructure as well as the need for more efficient and reliable refueling solutions.

Military and defense industries will significantly adapt these robots in the coming years, driving sales in the market. RE2 Robotics has also been awarded contracts by the US Army to develop autonomous ground vehicle refueling (AGVR) prototypes. As a whole, North America has been a key region for the growth and adoption of robotic refuelers in the market

Is the Robotic Refueling System Projected to Grow Significantly in Asia Pacific Region?

Government Initiatives and Programs to Promote Robotic Refueling System Market

Projected Market Value (2032):

Countries Details
China US$ 673.6 million

Projected CAGR (2025 to 2032):

Countries Details
China 42.7%

Projected Market Value (2032):

Countries Details
South Korea US$ 161.9 million

Projected CAGR (2025 to 2032):

Countries Details
South Korea 41.3%

Global robotic refueling system sales are expected to be dominated by the Asia Pacific region over the forecast period. Mining and marine & shipping industries have grown substantially in these regions, increasing demand for robotic refueling systems.

In the Asia Pacific, sales of robotic refueling systems are expected to reach US$ 1,295.4 million by 2032. Emerging markets like Asia-Pacific are expanding their fuel-handling infrastructure, increasing demand for robotic refueling systems.

China and India's growing shipping and logistics industries will result in more demand in the future. In addition, safety concerns of workers and the high demand for mining activities will likely increase demand in the coming years for robotic refueling systems.

Refueling operations are also increasingly being carried out by drones, especially in the aviation industry. Moreover, robotics companies and energy firms are collaborating more frequently in the region, which should fuel the market's growth. Overall, robotic refueling systems are increasingly being adopted and growing in the Asia Pacific region.

Category-wise Insights

How do Robotic Refueling Systems Fuel Pumps Expect to grow in the Future?

The Market for Robotic Refueling Systems is Expected to be Dominated by Gasoline in the Near Future

Based on the robotic refueling system fuel pumped segment is classified into gasoline, natural gas, petrochemicals, and others. Sales of gasoline are expected to increase over the next few years. By 2032, the market is predicted to grow at a CAGR of 40.7%. The increasing number of gasoline platforms and the use of vehicles is expected to increase demand for robotic refueling systems.

Refueling operations in the military can be challenging and risky, especially in remote or hostile environments. Using robotic refueling systems, military vehicles, aircraft, and other equipment can be refueled reliably and efficiently. As a result of the deployment of these systems, logistical capabilities can be enhanced, manpower requirements can be reduced, and operational readiness can be improved.

Fully automated robotic refueling systems are offered by Autofuel and Green Fuel Technologies Corp. Using robots to refuel vehicles eliminates the need for human attendants and reduces fueling time. Asia Pacific gas stations are only beginning to install robotic refueling systems, but more stations are likely to install these systems after testing and commissioning. Though robotic refueling systems are still relatively new, they are a growing trend that is likely to gain traction in the future.

Which Application will drive the Robotic Refueling System Market in the Future?

The Mining Industry will dominate the Market for Robotic Refueling Systems

The mining robotic refueling market is predicted to dominate over the next few years. Mining is expected to grow at a CAGR of 40.6% over the next few years. Future growth of robotic refueling systems will be driven by increased investment in the mining industry.

As autonomous haulage trucks are increasingly adopted, the robotics refueling market has surged. With these systems, mining vehicles such as trucks, excavators, and other heavy equipment can be refueled with less risk, increased productivity, and reduced downtime.

Using a robotic refueling system can greatly increase the efficiency, safety, and speed of the refueling process. A reduction in costs and improved operational efficiency can be achieved through the use of this technique. It is expected that the market for robotic fueling systems will continue to grow as several companies develop systems specifically for mining. For instance, in July 2020, BHP Mitsubishi Alliance (BHA) committed approximately US$ 68 million to autonomous hauling at the Daunia coal mine.

Competitive Landscape

Throughout the years, robotic manufacturers have developed new products as well as incorporated innovations and modified existing products in order to meet the requirements of a variety of applications. As one of their key strategies, robotic refueling system vendors also increase their service centers and develop customer relationships.

  • In May 2023, new docking systems for the International Space Station will be tested. ISS uses free-flying robotic assistants called Astrobees. There are three cube-shaped robots roaming the station including Honey, Queen, and Bumble. Among the duties they perform are helping crew members complete ISS National Laboratory-sponsored experiments to test new technology that may aid future space missions. In-orbit manufacturing processes, satellite servicing, and orbital refueling all require this technology.
  • In May 2023, Thales Alenia Space, Italy's largest space company, announced that 235 million euros ($256 million) of pandemic relief funds will be awarded for an experiment to demonstrate orbital servicing in 2026. In addition to a dexterous robotic arm and test capabilities, the servicer will be able to perform refueling, component repairs, orbital transfers, and atmospheric reentry in 2026.

Companies Covered in Robotic Refueling System Market

  • Scott Technology
  • Fuelmatics AB
  • Rotec Engineering B.V.
  • Neste Oyj
  • Shaw Development LLC
  • Plug Power Inc.
  • Aerobotix
  • Airbus S.A.S
  • The Boeing Company
  • ABB Group
  • KUKA
  • Simon Group Holdings
  • FANUC Corporation
  • Husky Corporation
Frequently Asked Questions

The market is expected to reach US$ 242.2 million by 2025.

The market is projected to grow to US$ 3,020.10 million by 2032.

The market is expected to grow at a CAGR of 43.4% during this period.

They are automated systems designed to refuel vehicles or equipment without human intervention, using robotics and advanced sensors.

Growth is driven by advancements in automationsensor technologies, and increased demand for scientific research-based robotic projects.

Robotic Refueling System Industry Report Scope
Attribute Details

Forecast Period

2025 to 2032

Historical Data Available for

2019 to 2024

Market Analysis

US$ billion for Value

Key Countries Covered

  • United States
  • Canada
  • Brazil
  • Mexico
  • Germany
  • United Kingdom
  • France
  • Spain
  • Italy
  • China
  • Japan
  • South Korea
  • Singapore
  • Thailand
  • Indonesia
  • Australia
  • New Zealand
  • GCC Countries
  • South Africa
  • Israel

Key Market Segments Covered

  • Fuel Pumped
  • Payload-carrying Capacity
  • Vertical
  • Region

Key Companies Profiled

  • Scott Technology
  • Fuelmatics AB
  • Rotec Engineering B.V.
  • Neste Oyj
  • Shaw Development LLC
  • Plug Power Inc.
  • Aerobotix
  • Airbus S.A.S
  • The Boeing Company
  • ABB Group
  • KUKA
  • Simon Group Holdings
  • FANUC Corporation
  • Husky Corporation

Customization & Pricing

Available upon Request

Market Segmentation

By Fuel Pumped:

  • Gasoline
  • Natural Gas
  • Petrochemicals
  • Others
    • Hydrogen Fuel Cells
    • Lithium-ion Batteries,
    • Methanol
    • Biofuel
    • Biodiesels

By Payload-carrying Capacity:

  • Up to 50 kg
  • 50.01-100 kg
  • 100.01-150 KG

By Frequency:

  • Less than 1 GHz
  • 1 GHz to 6 GHz
  • More than 6 GHz

By Vertical:

  • Mining
  • Automobile
  • Oil & Gas
  • Aerospace
  • Military & Defense
  • Warehouse & Logistics
  • Marine & Shipping
  • Construction
  • Others
    • Nuclear Power Plants
    • Space Exploration
    • Research & Development

By Region:

  • North America
  • Latin America
  • Europe
  • Asia Pacific
  • Middle East and Africa

Related Reports

1. Executive Summary

    1.1. Global Market Outlook

    1.2. Demand-side Trends

    1.3. Supply-side Trends

    1.4. Technology Roadmap Analysis

    1.5. Analysis and Recommendations

2. Market Overview

    2.1. Market Coverage / Taxonomy

    2.2. Market Definition / Scope / Limitations

3. Market Background

    3.1. Market Dynamics

        3.1.1. Drivers

        3.1.2. Restraints

        3.1.3. Opportunity

        3.1.4. Trends

    3.2. Scenario Forecast

        3.2.1. Demand in Optimistic Scenario

        3.2.2. Demand in Likely Scenario

        3.2.3. Demand in Conservative Scenario

    3.3. Opportunity Map Analysis

    3.4. Product Life Cycle Analysis

    3.5. Supply Chain Analysis

        3.5.1. Supply Side Participants and their Roles

            3.5.1.1. Producers

            3.5.1.2. Mid-Level Participants (Traders/ Agents/ Brokers)

            3.5.1.3. Wholesalers and Distributors

        3.5.2. Value Added and Value Created at Node in the Supply Chain

        3.5.3. List of Raw Material Suppliers

        3.5.4. List of Existing and Potential Buyer’s

    3.6. Investment Feasibility Matrix

    3.7. Value Chain Analysis

        3.7.1. Profit Margin Analysis

        3.7.2. Wholesalers and Distributors

        3.7.3. Retailers

    3.8. PESTLE and Porter’s Analysis

    3.9. Regulatory Landscape

        3.9.1. By Key Regions

        3.9.2. By Key Countries

    3.10. Regional Parent Market Outlook

    3.11. Production and Consumption Statistics

    3.12. Import and Export Statistics

4. Global Robotic Refueling System Market Analysis 2019-2024 and Forecast, 2025-2032

    4.1. Historical Market Size Value (US$ Mn) & Volume (Units) Analysis, 2019-2024

    4.2. Current and Future Market Size Value (US$ Mn) & Volume (Units) Projections, 2025-2032

        4.2.1. Y-o-Y Growth Trend Analysis

        4.2.2. Absolute $ Opportunity Analysis

5. Global Robotic Refueling System Market Analysis 2019-2024 and Forecast 2025-2032, By Fuel Pumped

    5.1. Introduction / Key Findings

    5.2. Historical Market Size Value (US$ Mn) & Volume (Units) Analysis By Fuel Pumped, 2019-2024

    5.3. Current and Future Market Size Value (US$ Mn) & Volume (Units) Analysis and Forecast By Fuel Pumped, 2025-2032

        5.3.1. Gasoline

        5.3.2. Natural Gas

        5.3.3. Petrochemicals

        5.3.4. Others - Hydrogen Fuel Cells, Lithium-ion Batteries, Methanol, Biofuel, Biodiesels

    5.4. Y-o-Y Growth Trend Analysis By Fuel Pumped, 2019-2024

    5.5. Absolute $ Opportunity Analysis By Fuel Pumped, 2025-2032

6. Global Robotic Refueling System Market Analysis 2019-2024 and Forecast 2025-2032, By Payload-carrying Capacity

    6.1. Introduction / Key Findings

    6.2. Historical Market Size Value (US$ Mn) & Volume (Units) Analysis By Payload-carrying Capacity, 2019-2024

    6.3. Current and Future Market Size Value (US$ Mn) & Volume (Units) Analysis and Forecast By Payload-carrying Capacity, 2025-2032

        6.3.1. Up to 50 kg

        6.3.2. 50.01 - 100 kg

        6.3.3. 100.01 - 150 kg

    6.4. Y-o-Y Growth Trend Analysis By Payload-carrying Capacity, 2019-2024

    6.5. Absolute $ Opportunity Analysis By Payload-carrying Capacity, 2025-2032

7. Global Robotic Refueling System Market Analysis 2019-2024 and Forecast 2025-2032, By Vertical

    7.1. Introduction / Key Findings

    7.2. Historical Market Size Value (US$ Mn) & Volume (Units) Analysis By Vertical, 2019-2024

    7.3. Current and Future Market Size Value (US$ Mn) & Volume (Units) Analysis and Forecast By Vertical, 2025-2032

        7.3.1. Mining

        7.3.2. Automobile

        7.3.3. Oil & Gas

        7.3.4. Aerospace

        7.3.5. Military & Defense

        7.3.6. Warehouse & Logistics

        7.3.7. Marine & Shipping

        7.3.8. Construction

        7.3.9. Others - Nuclear Power Plants, Space Exploration, Research & Development

    7.4. Y-o-Y Growth Trend Analysis By Vertical, 2019-2024

    7.5. Absolute $ Opportunity Analysis By Vertical, 2025-2032

8. Global Robotic Refueling System Market Analysis 2019-2024 and Forecast 2025-2032, By Region

    8.1. Introduction

    8.2. Historical Market Size Value (US$ Mn) & Volume (Units) Analysis By Region, 2019-2024

    8.3. Current Market Size Value (US$ Mn) & Volume (Units) Analysis and Forecast By Region, 2025-2032

        8.3.1. North America

        8.3.2. Latin America

        8.3.3. Europe

        8.3.4. Asia Pacific

        8.3.5. MEA

    8.4. Market Attractiveness Analysis By Region

9. North America Robotic Refueling System Market Analysis 2019-2024 and Forecast 2025-2032, By Country

    9.1. Historical Market Size Value (US$ Mn) & Volume (Units) Trend Analysis By Market Taxonomy, 2019-2024

    9.2. Market Size Value (US$ Mn) & Volume (Units) Forecast By Market Taxonomy, 2025-2032

        9.2.1. By Country

            9.2.1.1. U.S.

            9.2.1.2. Canada

        9.2.2. By Fuel Pumped

        9.2.3. By Payload-carrying Capacity

        9.2.4. By Vertical

    9.3. Market Attractiveness Analysis

        9.3.1. By Country

        9.3.2. By Fuel Pumped

        9.3.3. By Payload-carrying Capacity

        9.3.4. By Vertical

    9.4. Key Takeaways

10. Latin America Robotic Refueling System Market Analysis 2019-2024 and Forecast 2025-2032, By Country

    10.1. Historical Market Size Value (US$ Mn) & Volume (Units) Trend Analysis By Market Taxonomy, 2019-2024

    10.2. Market Size Value (US$ Mn) & Volume (Units) Forecast By Market Taxonomy, 2025-2032

        10.2.1. By Country

            10.2.1.1. Brazil

            10.2.1.2. Mexico

            10.2.1.3. Rest of Latin America

        10.2.2. By Fuel Pumped

        10.2.3. By Payload-carrying Capacity

        10.2.4. By Vertical

    10.3. Market Attractiveness Analysis

        10.3.1. By Country

        10.3.2. By Fuel Pumped

        10.3.3. By Payload-carrying Capacity

        10.3.4. By Vertical

    10.4. Key Takeaways

11. Europe Robotic Refueling System Market Analysis 2019-2024 and Forecast 2025-2032, By Country

    11.1. Historical Market Size Value (US$ Mn) & Volume (Units) Trend Analysis By Market Taxonomy, 2019-2024

    11.2. Market Size Value (US$ Mn) & Volume (Units) Forecast By Market Taxonomy, 2025-2032

        11.2.1. By Country

            11.2.1.1. Germany

            11.2.1.2. U.K.

            11.2.1.3. France

            11.2.1.4. Spain

            11.2.1.5. Italy

            11.2.1.6. Rest of Europe

        11.2.2. By Fuel Pumped

        11.2.3. By Payload-carrying Capacity

        11.2.4. By Vertical

    11.3. Market Attractiveness Analysis

        11.3.1. By Country

        11.3.2. By Fuel Pumped

        11.3.3. By Payload-carrying Capacity

        11.3.4. By Vertical

    11.4. Key Takeaways

12. Asia Pacific Robotic Refueling System Market Analysis 2019-2024 and Forecast 2025-2032, By Country

    12.1. Historical Market Size Value (US$ Mn) & Volume (Units) Trend Analysis By Market Taxonomy, 2019-2024

    12.2. Market Size Value (US$ Mn) & Volume (Units) Forecast By Market Taxonomy, 2025-2032

        12.2.1. By Country

            12.2.1.1. China

            12.2.1.2. Japan

            12.2.1.3. South Korea

            12.2.1.4. Singapore

            12.2.1.5. Thailand

            12.2.1.6. Indonesia

            12.2.1.7. Australia

            12.2.1.8. New Zealand

            12.2.1.9. Rest of Asia Pacific

        12.2.2. By Fuel Pumped

        12.2.3. By Payload-carrying Capacity

        12.2.4. By Vertical

    12.3. Market Attractiveness Analysis

        12.3.1. By Country

        12.3.2. By Fuel Pumped

        12.3.3. By Payload-carrying Capacity

        12.3.4. By Vertical

    12.4. Key Takeaways

13. MEA Robotic Refueling System Market Analysis 2019-2024 and Forecast 2025-2032, By Country

    13.1. Historical Market Size Value (US$ Mn) & Volume (Units) Trend Analysis By Market Taxonomy, 2019-2024

    13.2. Market Size Value (US$ Mn) & Volume (Units) Forecast By Market Taxonomy, 2025-2032

        13.2.1. By Country

            13.2.1.1. GCC Countries

            13.2.1.2. South Africa

            13.2.1.3. Israel

            13.2.1.4. Rest of MEA

        13.2.2. By Fuel Pumped

        13.2.3. By Payload-carrying Capacity

        13.2.4. By Vertical

    13.3. Market Attractiveness Analysis

        13.3.1. By Country

        13.3.2. By Fuel Pumped

        13.3.3. By Payload-carrying Capacity

        13.3.4. By Vertical

    13.4. Key Takeaways

14. Key Countries Robotic Refueling System Market Analysis

    14.1. U.S.

        14.1.1. Pricing Analysis

        14.1.2. Market Share Analysis, 2024

            14.1.2.1. By Fuel Pumped

            14.1.2.2. By Payload-carrying Capacity

            14.1.2.3. By Vertical

    14.2. Canada

        14.2.1. Pricing Analysis

        14.2.2. Market Share Analysis, 2024

            14.2.2.1. By Fuel Pumped

            14.2.2.2. By Payload-carrying Capacity

            14.2.2.3. By Vertical

    14.3. Brazil

        14.3.1. Pricing Analysis

        14.3.2. Market Share Analysis, 2024

            14.3.2.1. By Fuel Pumped

            14.3.2.2. By Payload-carrying Capacity

            14.3.2.3. By Vertical

    14.4. Mexico

        14.4.1. Pricing Analysis

        14.4.2. Market Share Analysis, 2024

            14.4.2.1. By Fuel Pumped

            14.4.2.2. By Payload-carrying Capacity

            14.4.2.3. By Vertical

    14.5. Germany

        14.5.1. Pricing Analysis

        14.5.2. Market Share Analysis, 2024

            14.5.2.1. By Fuel Pumped

            14.5.2.2. By Payload-carrying Capacity

            14.5.2.3. By Vertical

    14.6. U.K.

        14.6.1. Pricing Analysis

        14.6.2. Market Share Analysis, 2024

            14.6.2.1. By Fuel Pumped

            14.6.2.2. By Payload-carrying Capacity

            14.6.2.3. By Vertical

    14.7. France

        14.7.1. Pricing Analysis

        14.7.2. Market Share Analysis, 2024

            14.7.2.1. By Fuel Pumped

            14.7.2.2. By Payload-carrying Capacity

            14.7.2.3. By Vertical

    14.8. Spain

        14.8.1. Pricing Analysis

        14.8.2. Market Share Analysis, 2024

            14.8.2.1. By Fuel Pumped

            14.8.2.2. By Payload-carrying Capacity

            14.8.2.3. By Vertical

    14.9. Italy

        14.9.1. Pricing Analysis

        14.9.2. Market Share Analysis, 2024

            14.9.2.1. By Fuel Pumped

            14.9.2.2. By Payload-carrying Capacity

            14.9.2.3. By Vertical

    14.10. China

        14.10.1. Pricing Analysis

        14.10.2. Market Share Analysis, 2024

            14.10.2.1. By Fuel Pumped

            14.10.2.2. By Payload-carrying Capacity

            14.10.2.3. By Vertical

    14.11. Japan

        14.11.1. Pricing Analysis

        14.11.2. Market Share Analysis, 2024

            14.11.2.1. By Fuel Pumped

            14.11.2.2. By Payload-carrying Capacity

            14.11.2.3. By Vertical

    14.12. South Korea

        14.12.1. Pricing Analysis

        14.12.2. Market Share Analysis, 2024

            14.12.2.1. By Fuel Pumped

            14.12.2.2. By Payload-carrying Capacity

            14.12.2.3. By Vertical

    14.13. Singapore

        14.13.1. Pricing Analysis

        14.13.2. Market Share Analysis, 2024

            14.13.2.1. By Fuel Pumped

            14.13.2.2. By Payload-carrying Capacity

            14.13.2.3. By Vertical

    14.14. Thailand

        14.14.1. Pricing Analysis

        14.14.2. Market Share Analysis, 2024

            14.14.2.1. By Fuel Pumped

            14.14.2.2. By Payload-carrying Capacity

            14.14.2.3. By Vertical

    14.15. Indonesia

        14.15.1. Pricing Analysis

        14.15.2. Market Share Analysis, 2024

            14.15.2.1. By Fuel Pumped

            14.15.2.2. By Payload-carrying Capacity

            14.15.2.3. By Vertical

    14.16. Australia

        14.16.1. Pricing Analysis

        14.16.2. Market Share Analysis, 2024

            14.16.2.1. By Fuel Pumped

            14.16.2.2. By Payload-carrying Capacity

            14.16.2.3. By Vertical

    14.17. New Zealand

        14.17.1. Pricing Analysis

        14.17.2. Market Share Analysis, 2024

            14.17.2.1. By Fuel Pumped

            14.17.2.2. By Payload-carrying Capacity

            14.17.2.3. By Vertical

    14.18. GCC Countries

        14.18.1. Pricing Analysis

        14.18.2. Market Share Analysis, 2024

            14.18.2.1. By Fuel Pumped

            14.18.2.2. By Payload-carrying Capacity

            14.18.2.3. By Vertical

    14.19. South Africa

        14.19.1. Pricing Analysis

        14.19.2. Market Share Analysis, 2024

            14.19.2.1. By Fuel Pumped

            14.19.2.2. By Payload-carrying Capacity

            14.19.2.3. By Vertical

    14.20. Israel

        14.20.1. Pricing Analysis

        14.20.2. Market Share Analysis, 2024

            14.20.2.1. By Fuel Pumped

            14.20.2.2. By Payload-carrying Capacity

            14.20.2.3. By Vertical

15. Market Structure Analysis

    15.1. Competition Dashboard

    15.2. Competition Benchmarking

    15.3. Market Share Analysis of Top Players

        15.3.1. By Regional

        15.3.2. By Fuel Pumped

        15.3.3. By Payload-carrying Capacity

        15.3.4. By Vertical

16. Competition Analysis

    16.1. Competition Deep Dive

        16.1.1. Scott Technology

            16.1.1.1. Overview

            16.1.1.2. Product Portfolio

            16.1.1.3. Profitability by Market Segments

            16.1.1.4. Sales Footprint

            16.1.1.5. Strategy Overview

                16.1.1.5.1. Marketing Strategy

                16.1.1.5.2. Product Strategy

                16.1.1.5.3. Channel Strategy

        16.1.2. Fuelmatics AB

            16.1.2.1. Overview

            16.1.2.2. Product Portfolio

            16.1.2.3. Profitability by Market Segments

            16.1.2.4. Sales Footprint

            16.1.2.5. Strategy Overview

                16.1.2.5.1. Marketing Strategy

                16.1.2.5.2. Product Strategy

                16.1.2.5.3. Channel Strategy

        16.1.3. Rotec Engineering B.V.

            16.1.3.1. Overview

            16.1.3.2. Product Portfolio

            16.1.3.3. Profitability by Market Segments

            16.1.3.4. Sales Footprint

            16.1.3.5. Strategy Overview

                16.1.3.5.1. Marketing Strategy

                16.1.3.5.2. Product Strategy

                16.1.3.5.3. Channel Strategy

        16.1.4. Neste Oyj

            16.1.4.1. Overview

            16.1.4.2. Product Portfolio

            16.1.4.3. Profitability by Market Segments

            16.1.4.4. Sales Footprint

            16.1.4.5. Strategy Overview

                16.1.4.5.1. Marketing Strategy

                16.1.4.5.2. Product Strategy

                16.1.4.5.3. Channel Strategy

        16.1.5. Shaw Development LLC

            16.1.5.1. Overview

            16.1.5.2. Product Portfolio

            16.1.5.3. Profitability by Market Segments

            16.1.5.4. Sales Footprint

            16.1.5.5. Strategy Overview

                16.1.5.5.1. Marketing Strategy

                16.1.5.5.2. Product Strategy

                16.1.5.5.3. Channel Strategy

        16.1.6. Plug Power Inc.

            16.1.6.1. Overview

            16.1.6.2. Product Portfolio

            16.1.6.3. Profitability by Market Segments

            16.1.6.4. Sales Footprint

            16.1.6.5. Strategy Overview

                16.1.6.5.1. Marketing Strategy

                16.1.6.5.2. Product Strategy

                16.1.6.5.3. Channel Strategy

        16.1.7. Aerobotix

            16.1.7.1. Overview

            16.1.7.2. Product Portfolio

            16.1.7.3. Profitability by Market Segments

            16.1.7.4. Sales Footprint

            16.1.7.5. Strategy Overview

                16.1.7.5.1. Marketing Strategy

                16.1.7.5.2. Product Strategy

                16.1.7.5.3. Channel Strategy

        16.1.8. Airbus S.A.S

            16.1.8.1. Overview

            16.1.8.2. Product Portfolio

            16.1.8.3. Profitability by Market Segments

            16.1.8.4. Sales Footprint

            16.1.8.5. Strategy Overview

                16.1.8.5.1. Marketing Strategy

                16.1.8.5.2. Product Strategy

                16.1.8.5.3. Channel Strategy

        16.1.9. The Boeing Company

            16.1.9.1. Overview

            16.1.9.2. Product Portfolio

            16.1.9.3. Profitability by Market Segments

            16.1.9.4. Sales Footprint

            16.1.9.5. Strategy Overview

                16.1.9.5.1. Marketing Strategy

                16.1.9.5.2. Product Strategy

                16.1.9.5.3. Channel Strategy

        16.1.10. ABB Group

            16.1.10.1. Overview

            16.1.10.2. Product Portfolio

            16.1.10.3. Profitability by Market Segments

            16.1.10.4. Sales Footprint

            16.1.10.5. Strategy Overview

                16.1.10.5.1. Marketing Strategy

                16.1.10.5.2. Product Strategy

                16.1.10.5.3. Channel Strategy

        16.1.11. KUKA

            16.1.11.1. Overview

            16.1.11.2. Product Portfolio

            16.1.11.3. Profitability by Market Segments

            16.1.11.4. Sales Footprint

            16.1.11.5. Strategy Overview

                16.1.11.5.1. Marketing Strategy

                16.1.11.5.2. Product Strategy

                16.1.11.5.3. Channel Strategy

        16.1.12. Simon Group Holdings

            16.1.12.1. Overview

            16.1.12.2. Product Portfolio

            16.1.12.3. Profitability by Market Segments

            16.1.12.4. Sales Footprint

            16.1.12.5. Strategy Overview

                16.1.12.5.1. Marketing Strategy

                16.1.12.5.2. Product Strategy

                16.1.12.5.3. Channel Strategy

        16.1.13. FANUC Corporation

            16.1.13.1. Overview

            16.1.13.2. Product Portfolio

            16.1.13.3. Profitability by Market Segments

            16.1.13.4. Sales Footprint

            16.1.13.5. Strategy Overview

                16.1.13.5.1. Marketing Strategy

                16.1.13.5.2. Product Strategy

                16.1.13.5.3. Channel Strategy

        16.1.14. Husky Corporation

            16.1.14.1. Overview

            16.1.14.2. Product Portfolio

            16.1.14.3. Profitability by Market Segments

            16.1.14.4. Sales Footprint

            16.1.14.5. Strategy Overview

                16.1.14.5.1. Marketing Strategy

                16.1.14.5.2. Product Strategy

                16.1.14.5.3. Channel Strategy

17. Assumptions & Acronyms Used

18. Research Methodology

Research Methodology Framework for Market Research Excellence

At Persistence Market Research, we implement a comprehensive, validated, and multi-dimensional approachto market analysis that delivers actionable insights across complex market landscapes. Our methodology combines the analytical rigor of leading consulting firms with innovative research techniques, ensuring robust market assessments that guide strategic decision-making with confidence.

Core Research Philosophy

Our methodology is built on four foundational pillars:

Research Philosophy Image

At Persistence Market Research, our methodology is designed to transcend conventional market studies by combining analytical rigor, multi-source validation, and future-focused insights.

We integrate advanced research frameworks, robust data collection strategies, cutting-edge analytics, and innovative technologies to deliver a 360-degree view of complex markets.

We integrate advanced research frameworks, robust data collection strategies, cutting-edge analytics, and innovative technologies to deliver a 360-degree view of complex markets.

Each stage spanning from strategic scoping and hypothesis-building to competitive intelligence, quality validation, and actionable recommendations is engineered to provide clients with unmatched clarity, precision, and confidence in decision-making.

By embedding innovation and technology at the core, our approach ensures that insights are not only comprehensive but also predictive, empowering businesses to seize opportunities, mitigate risks, and achieve sustainable growth

Research Philosophy Image

Capturing Key Information and Events

During this phase, key research objectives focus on essential information and data points for assessing the market, including:

Research Philosophy Image

TAM-SAM-SOM Framework Implementation

We employ both top-down and bottom-up approaches to ensure accurate market sizing.

Top-Down Market SizingBottom-Up Market Sizing
Universe Definition: Total global/regional market identificationUnit Economics: Average transaction values, purchase frequencies, customer lifecycle
Segmentation Filters: Geographic, demographic, and behavioral constraintsCustomer Segmentation: Detailed buyer persona development and sizing
Market Share Analysis: Competitive landscape assessment and share allocationPenetration Analysis: Market penetration rates by segment and geography
Growth Rate Application: Historical trends and forward-looking growth assumptionsScaling Methodology: Extrapolation techniques with confidence intervals

Validation & Cross-Verification

  • Triangulation: Comparing top-down and bottom-up results for consistency
  • Sensitivity Analysis: Testing key assumptions and parameter variations
  • Peer Benchmarking: Comparison with analogous markets and industry benchmarks
  • Expert Review: External validation through industry specialist consultation

Research Philosophy Image

Forecasting & Projection Modeling

Our proprietary forecasting models incorporate multiple variables and scenarios.

Forecasting Components

  • Historical Trend Analysis: 10-year historical growth patterns and cyclical variations
  • Driver-Based Modeling: Economic indicators, demographic shifts, technology adoption
  • Scenario Planning: Base case, optimistic, and conservative projections
  • Monte Carlo Simulations: Probability-weighted outcomes and risk assessments

Model Validation

  • Back-Testing: Historical accuracy assessment over 3–5-year periods
  • Cross-Validation: Multiple modeling approaches for result comparison
  • External Benchmarking: Comparison with established market forecasts
  • Continuous Calibration: Quarterly model updates based on new data

Comprehensive Data Collection Strategy

Our secondary research phase establishes a robust knowledge base utilizing diverse, credible sources.

Secondary Data Sourcess

  • Industry Publications & Reports
  • Government & Regulatory Data
  • Financial Intelligence (filings & reports)
  • Academic Research & Digital Intelligence

Quality Assurance Protocol

  • Source credibility assessment and publication date validation
  • Data consistency checks across multiple sources
  • Bias identification and neutralization techniques
  • Information gap tracking for primary research prioritization

Research Philosophy Image

Primary Research Excellence

Our primary research methodology employs best-in-class techniques to capture unique market insights.

Quantitative Research Methods

  • Large-Scale Surveys: Statistically representative samples with 95% confidence intervals
  • Survey Methodology: Multi-channel deployment (online, telephone, in-person)
  • Question Architecture and Response Optimization

Qualitative Research Methods

  • Executive Interviews
  • Focus Groups
  • Expert Consultations

Quality Assurance & Validation Framework

Multi-Stage Validation Process

  • Source Verification and Consistency Testing
  • Outlier Detection and Bias Assessment
  • Peer Review Process and External Validation
  • Sensitivity Analysis and Confidence Intervals

Research Philosophy Image

Methodology Validation & Credibility

Our research methodology has been extensively validated through:

  • Academic Partnerships: Collaborations with top-tier business schools and research institutions
  • Client Success Stories: Documented case studies demonstrating research impact and ROI
  • Continuous Benchmarking: Performance comparison with leading global research firms

This comprehensive methodology framework positions Persistence Market Research at the forefront of market intelligence, combining the analytical sophistication of top-tier consulting firms with innovative research techniques. Our approach ensures that every market assessment delivers precise, actionable, and strategically valuable insights that drive business success in competitive market environments.

Ready to unlock your market potential? Contact our research experts to discuss how our validated methodology can transform your strategic decision-making with data-driven market intelligence.

Copyright © 2026 Persistence Market Research. All Rights Reserved

Connect With Us -